Market Movers: Last Mile
Market Movers highlights key activities and developments before the U.S. market opens each morning.
Market Movers highlights key activities and developments before the U.S. market opens each morning.

Bob Savage
Time to Read: 19 minutes
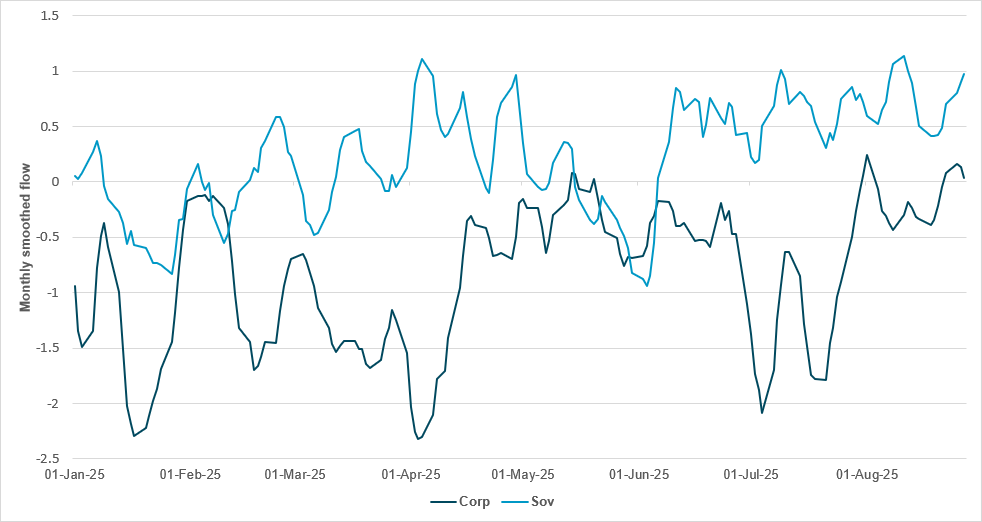
EUROZONE CORPORATE FLOW STRENGTHENS DESPITE GROWING POLITICAL RISK
Source: BNY
As political gyrations in France and the Netherlands carry on, the market continues to behave in a relatively benign manner. There have been some movements in French yields, spreads and equities, but there is very little sign of contagion risk. There seems to be a general view of “diminishing returns” to negativity on such topics, and, if anything, the market is far more focused on the state of EU-U.S. trade talks and monetary policy. After all, if the ECB’s direction of travel remains toward gradual easing or at least keeping financial conditions relatively loose, the risk of an adverse reaction will be limited, even with France’s current deficit metrics. We are sympathetic to such views, but there is a difference between not being negative and being outright positive. Looking at the Eurozone and broader European corporate space for example, we can see that Eurozone corporate flow is now at its strongest point this year, whereas sovereign bond flow seems to be topping out. There is no indication of selling of sovereign bonds (or equities) to indicate that rotation is taking place, which means that investors may now see corporate credit in Europe as the only regional asset class with remaining value. Similar trends are surfacing in the U.S. However, the sovereign-corporate link is never far away, and there are dangers in moving up the risk curve just as political volatility is picking up.
This is the last trading day of August, and for many the summer is ending with equity markets mixed to lower. The monthly trend of Chinese shares up and Japan down continued for equities and in FX. The EMEA markets continued to post losses, with the focus on weaker German economic data (retail sales) and Italian GDP. Global bonds are mostly down, with the focus on EU inflation, which is lower but not enough to clearly signal another ECB cut, with stall-speed growth. French 10y OATs were down 3bp, while U.S. 30y climbed back above 4.90% and 2y rates were near-flat at 3.63%; Japanese 10y rates fell 2bp to 1.59% as the country’s CPI slowed. The FX markets saw a modest USD bounce-back led by IDR, where protests spooked markets, along with KRW, after the government surprised with a bigger spending plan. Emerging markets are a key worry for rebalancing, with ZAR weaker. For the U.S. session ahead, core PCE will matter along with consumer inflation expectations and the overall mood; however, the personal income and spending data are likely more important, as the health of the consumer remains in doubt. The question for September will be whether FOMC rate cuts are sufficient medicine to stabilize growth uncertainty in the rest of the year. Growth was close to stall-speed in Q2, apart from imports dropping dramatically, and consumers’ role in driving growth was less than the investment in AI for the quarter. Markets are waiting for the bounce-back, with the Fed being a key part of that hope. The Fed’s newly dovish Governor Christopher Waller made clear that he is sticking to a 25bp cut in September, and three potential more cuts to follow will be even more data-dependent. This makes today’s core PCE prices report trickier for investors, given the risk that it could come in above 3% y/y. The last mile in the race to return inflation to 2% still looks to be the most difficult. Not finishing the job may cost more than the political noise and debt servicing costs for the economy into the year ahead.
France’s Q2 GDP grew 0.3% q/q after 0.1% in Q1, supported by inventories (+0.5 points), while foreign trade detracted (-0.3 points). Household consumption was flat: energy spending fell by 2.4% but was offset by gains for food (+1.6%) and accommodation services (+2.3%). Gross fixed capital formation declined by 0.1% for a second successive quarter, dragged down by construction (-0.4%) and transport equipment (-2.0%), though business services rose 1.2%. Government consumption grew by 0.4%. Exports rebounded by 0.5% on strong pharmaceuticals, but imports jumped 1.3% on higher inflows of pharmaceuticals, transport equipment (+7.0%) and refinery products. Household purchasing power rose by 0.2%, the savings rate climbed to 18.9%, and non-financial corporate profit margins fell to 30.7% from 31.4%. CAC40 -0.475% to 7725.7, EURUSD -0.086% to 1.1673, 10y OAT +2.6bp to 3.504%.
Italy’s Q2 GDP fell 0.1% q/q but rose 0.4% y/y, confirming the preliminary estimate, with 2025 carryover growth at 0.5%. Final consumption was flat, while gross fixed investment increased by 1.0%. Imports rose by 0.4% and exports fell by 1.7%, leaving net trade with a negative contribution of 0.7 percentage points. Investment added 0.2 points to GDP, and inventories 0.4. Value added decreased in agriculture (-0.6%) and industry (-0.3%), while services were stable. Hours worked and labor units increased 0.2%, though jobs fell 0.1%. Per-capita employee compensation rose 0.9%. The weak result reflected flat household and public consumption against stronger investment and inventory growth, offset by external trade weakness. FTSEMIB -0.463% to 42250.36, EURUSD -0.086% to 1.1673, 10y BTP +3.5bp to 3.572%.
In Japan, Tokyo CPI eased further in August from 2.9% y/y to 2.6%, while the core ex-fresh food and energy measure was dipped to 3.0% y/y from 3.1% in July. The headline CPI was primarily pulled down by a -8.8% y/y fall in fuel, light and water charges, while food price inflation remain elevated at 6.9% y/y. Elsewhere, the furniture and housing component dropped from 3% y/y to 2%, and transportation was the only component to post a y/y rise, from 3.0% to 3.3% y/y. Elsewhere, Japan’s July preliminary industrial production dropped sharply, coming in at -1.6% m/m, -0.9% y/y from 2.1% m/m, 4.4% y/y, while retail sales slowed to 0.3% y/y from 2.0% y/y. Consumer confidence for July rose to 34.9 to 33.7, with the income growth and employment components both up, to 39.4 (+0.9 m/m) and 39.3 (+1.7), respectively. In terms of price expectations, the percentage expecting prices to go up was 93.4% in August, an increase of 1.0 percentage points from the previous month. Nikkei -0.258% to 42718.47, USDJPY +0.103% to 147.08, 10y JGB -1.8bp to 1.602%.
Thailand’s Constitutional Court has dismissed Prime Minister Paetongtarn Shinawatra for an ethics violation after just one year in office, making her the sixth Shinawatra-backed leader removed by the military or judiciary in two decades of political turmoil. The ruling centered on a leaked June phone call with Cambodian Senate President Hun Sen during a border standoff, which later erupted into five days of fighting. Her removal weakens the Pheu Thai Party’s fragile coalition and opens the way for parliament to elect a new premier, with Deputy PM Phumtham Wechayachai leading in a caretaker role. Potential successors include ex-attorney general Chaikasem Nitisiri and former deputy premier Anutin Charnvirakul. The decision deepens political uncertainty amid stalled reforms and weak economic growth projected at 2.3% this year. SET -0.902% to 1238.81, USDTHB +0.047% to 32.388, 10y TGN -0.5bp to 1.294%.
German August national CPI is expected to come in at 0.0% m/m, 2.1%y/y (2.0% HICP).
U.S July personal income is forecast up, at 0.4% m/m from 0.3% in June, while spending is expected up 0.5% m/m from 0.1% – both key for consumer health.
U.S. July core PCE consensus is for a rise to 2.9% y/y from 2.8% y/y, with the headline rate expected up 0.2% m/m, 2.6% y/y after 0.3% m/m, 2.6% y/y.
U.S. July advance goods trade balance is expected at $-90bn deficit from $84.9bn.
U.S. July wholesale inventories are forecast flat at 0.1% m/m from 0.1% m/m in June.
U.S. August MNI Chicago PMI is expected to ease from 47.1 to 46.5.
U.S. July final University of Michigan consumer sentiment consensus forecast is unchanged vs. flash estimate at 58.6.
Mood: iFlow Mood is shifting toward the risk-neutral zone, with sentiment gradually improving in the equities markets and easing demand for core sovereign bonds.
FX: Mixed and light currencies with no significant flows. CLP, IDR and MYR posted the most outflows, while HUF, NZD and CNY saw the most inflows. Elsewhere, EUR, JPY and NZD were bought, against outflows into USD, AUD and GBP. EUR and JPY scored holdings continue to drift higher, at 0.85 and 2.2, respectively.
FI: Strong demand across the G10, led by U.S. Treasurys, U.K. gilts and Eurozone government bonds. Elsewhere, good demand was seen in Chilean, Polish and South African bonds, against broad selling pressure in APAC, led by Indonesia government bonds.
Equities: Eurozone, U.K., Czech, Hungarian and Malaysian equities were most sold against buying in Israel, Norway, New Zealand, Sweden and Singapore. Within DM EMEA, the health care sector recorded the most buying, while the financials, information technology and industrials sectors were most sold.
“All endeavor calls for the ability to tramp the last mile, shape the last plan, endure the last hour’s toil.” – Henry David Thoreau
“There is no mile as long as the final one that leads back home.” – Katherine Marsh
Euro area July ECB consumer expectations survey showed median perceived inflation over the past 12 months unchanged at 3.1%, with expectations steady at 2.6% for the next year and 2.1% for five years ahead, while three-year expectations edged up to 2.5%. Nominal income growth expectations fell to 0.9% from 1.0% but expected spending growth rose to 3.3% from 3.2%. Economic growth expectations weakened to -1.2% from -1.0%, while the expected unemployment rate in 12 months rose to 10.6% from 10.3%. Home prices were expected to rise 3.3% versus 3.1% previously, and mortgage rates to 4.5% from 4.3%. Credit access tightened slightly, with 16.0% of consumers applying for credit in July, up from 15.6% in April. Euro Stoxx 50 -0.538% to 5367.68, EURUSD -0.086% to 1.1673, BBG AGG Euro Government High Grade EUR -2.5bp to 2.86%.
Germany’s July retail sales fell 1.5% m/m in real terms and 1.0% m/m in nominal terms, reversing June’s revised gains of 1.0% (real) and 0.8% (nominal). Compared with July 2024, sales rose 1.9% in real terms and 3.1% in nominal terms. Food retailing declined 1.8% m/m in real terms and 1.2% in nominal terms but was up 0.1% in real terms and 2.8% in nominal terms y/y. Non-food sales dropped 0.7% m/m in real terms and 0.5% in nominal terms but increased 3.5% in real terms and 4.2% in nominal terms y/y. Internet and mail-order trade fell sharply by 3.8% m/m in real terms and 3.1% in nominal terms, though it posted strong annual growth of 13.8% in real terms and 14.1% in nominal terms. Employment was flat m/m on a seasonally adjusted basis at 45.8 million, following declines in May and June, and was unchanged y/y. Unadjusted employment fell by 44,000 or 0.1% m/m, in line with the July average of recent years. The number of unemployed people reached 1.74 million, up 149,000 or 9.4% y/y, raising the jobless rate to 3.9% compared with 3.6% a year earlier. Seasonally adjusted unemployment was 1.64 million, up slightly by 1,000 m/m, leaving the adjusted jobless rate steady at 3.7% for the third consecutive month. DAX -0.45% to 23931.69, EURUSD -0.086% to 1.1673, 10y Bund +1.8bp to 2.713%.
Germany’s Q2 nominal wages rose 4.1% y/y, while consumer prices increased 2.1%, leaving real wages up 1.9% and continuing the positive trend. The strongest nominal wage gains were seen in financial and insurance services (+7.6%), professional, scientific and technical services (+7.6%), and other business services (+5.5%). Lower increases were recorded in trade and vehicle repair (+2.7%), arts, entertainment and recreation (+2.7%), and transport and storage (+1.7%), while energy supply saw a decline of 0.2%. Full-time employees overall saw wages rise 4.3%, with the lowest-earning quintile gaining 6.5% and the highest-earning quintile only 2.5%. Apprentices recorded above-average nominal growth of 5.5%, while marginally employed workers saw just 0.6%.
Germany’s labor market showed initial signs of stabilization in August, though economic weakness remained evident. Unemployment and underemployment increased with the summer break, but fell on a seasonally adjusted basis. The risk of job loss stayed comparatively low though rising, while chances of leaving unemployment for work were at a historic low. Employers were cautious in reporting new vacancies. Social security employment rose on a seasonally adjusted basis in June to 34.90 million. Short-time work remained elevated but continued its gradual YTD decline. Early indicators suggested recent trends will persist. By late summer, 129,000 of 477,000 training positions were unfilled, while 98,000 of 430,000 applicants lacked placements.
Germany’s July import prices fell 1.4% y/y, unchanged from June, and were down 0.4% m/m. The decline was driven by energy, particularly crude oil (-22.7% y/y), coal (-17.9%) and mineral oil products (-12.9%), although electricity rose sharply (+30.5%). Excluding energy, import prices were 0.2% lower y/y. Intermediate goods prices fell 1.5% y/y, and capital goods were down 0.5%, while consumer goods rose 1.6% and agricultural goods increased by 1.9%. Food imports saw strong y/y gains, including orange juice (+41.6%), coffee (+34.5%) and beef (+30.9%). Export prices rose 0.6% y/y but fell 0.2% m/m, with higher prices for consumer goods (+1.7%) and capital goods (+0.4%), while intermediate goods were flat. Energy exports increased by 0.3% y/y, with gas up 10.2% but mineral oil products down 11.3%. Agricultural export prices fell 0.7% y/y.
France’s August CPI is expected to rise 0.9% y/y after 1.0% in July on preliminary figures, reflecting slower service price growth, especially in transport, while energy prices should decrease more slowly. Food and tobacco prices are set to rise at the same rate as in July, and manufactured goods should fall slightly faster. On a m/m basis, CPI is projected up 0.4% after 0.2% in July, driven by the seasonal rebound in manufactured goods, particularly clothing, with smaller increases in services and food, while energy should edge lower. The HICP is forecast to rise 0.8% y/y after 0.9% and 0.5% m/m after 0.3%. CAC40 -0.475% to 7725.7, EURUSD -0.086% to 1.1673, 10y OAT +2.6bp to 3.504%.
France’s July industrial producer prices rose 0.6% m/m after 0.1% in June, though they were flat y/y (-0.1%). Home market prices rebounded 0.4% m/m, with energy and water up 0.9%, while foreign market prices accelerated by 1.3%. Refined petroleum product prices slowed to +3.8% m/m but remained sharply lower y/y (-14.6%). Mining, quarrying, energy and water rose 0.9% m/m but were still down 2.6% y/y. Transport equipment increased 0.3% m/m and 0.7% y/y, while electronic equipment and machinery fell 0.2% m/m and was flat y/y. Food and beverages were stable m/m, up 3.2% y/y. Import prices fell 0.2% m/m after rising in June and dropped 1.9% y/y, with petroleum products up 2.1% m/m but electronic equipment stable and beverages unchanged.
France’s Q2 payroll employment rose 0.2% (+51,900 jobs) after a slight decline in Q1, leaving total employment broadly flat y/y but 5.0% above end-2019. Private payrolls increased by 0.2% (+43,400) but remained 0.1% below Q2 2024, while public payrolls were stable (+8,500) and up 0.4% y/y. Temporary employment edged up 0.2% (+1,300) after nine quarters of decline but was still 3.3% lower y/y and 8.4% below pre-crisis levels. By sector, agriculture was stable, industry slipped 0.1% and construction fell 0.3% (-1.7% y/y). Market services excluding temporary work rose 0.3% (+39,900), with strong gains in accommodation and food services (+21,100) and other services (+11,900). Non-market services increased by 0.2% (+19,100), led by health and social work (+16,300), and stood 0.5% higher y/y.
Italy’s August CPI rose 1.6% y/y, easing from 1.7% in July, and increased 0.1% m/m. The slowdown was mainly due to regulated energy prices (+12.9% vs. +17.1%) and non-regulated energy (-5.9% vs. -5.2%), alongside weaker communication services (+0.2%). Offsetting pressures came from food, with unprocessed food up 5.6% and processed food up 3.0%, as well as recreational, cultural and personal services (+2.9%) and transport services (+3.5%). Core inflation edged up to 2.1% from 2.0%. Goods inflation slowed to 0.6%, while services accelerated to 2.7%, widening the gap to 2.1 points. The “shopping basket” rose 3.5% y/y, while the harmonized HICP fell 0.2% m/m on summer sales and was steady at 1.7% y/y. Acquired inflation for 2025 stood at 1.7% (general) and 2.1% (core). FTSEMIB -0.463% to 42250.36, EURUSD -0.086% to 1.1673, 10y BTP +3.5bp to 3.572%.
Italy’s June industrial turnover rose 1.2% m/m in value terms and 1.9% in volume terms, while services turnover increased 0.9% by value and 0.5% by volume, with wholesale trade up 1.4% by value and 1.3% by volume. Broken down by industry, turnover fell for energy (-2.6%) but rose for capital goods (+3.0%), intermediate goods (+0.8%) and consumer goods (+0.7%). In Q2, industrial turnover fell 1.0% by value and 0.8% by volume, while services rose 0.3% and 0.6%, respectively. On a y/y basis, industrial turnover edged up 0.3% by value and 0.7% by volume, with domestic sales up 1.7% but foreign sales down 2.0%. Services turnover grew 3.6% by value and 3.5% by volume, driven by other services (+5.7%) and wholesale (+1.8%).
Spain’s August flash CPI held steady at 2.7% y/y, unchanged from July, with core inflation edging up to 2.4%. On a monthly basis, headline CPI rose 0.0% while core prices increased 0.3%. The harmonized CPI (HICP) also recorded 2.7% y/y, flat on the month. Separately, July retail sales at constant prices rose 4.7% y/y on a calendar and seasonally adjusted basis, though they fell 0.4% m/m. In the original series, retail sales rose 4.3% y/y and jumped 7.1% m/m. Retail sector employment increased 2.0% y/y. The current account in June narrowed to €5bn from €6.4bn in May. IBEX 35 -0.935% to 14954, EURUSD -0.086% to 1.1673, 10y Bono +2.3bp to 3.318%.
Sweden’s Q2 job openings fell 13% y/y to 147,500, of which 113,800 were advertised and 33,700 recruited by other means. Immediate-fill positions totaled 92,800, while job vacancies excluding substitutes stood at 115,100. The business sector accounted for 114,400 openings and public administration for 28,700, with municipalities at 16,300. Human health and social work had the highest number of openings, while administrative and support services showed the largest relative demand. Over half of openings were in Stockholm, Västra Götaland and Skåne, though Västernorrland had the highest number per employment. In June, employment was stable at 5.26 million, worked hours were unchanged, unemployment rose to 5.5%, up 0.3 percentage points y/y, and total gross pay reached SEK 210bn. OMX -0.533% to 2629.651, EURSEK -0.12% to 11.0594, 10y Swedish GB 0bp to 2.615%.
Sweden’s GDP grew by 0.5% q/q and 1.4% y/y in Q2 2025, driven by higher gross fixed capital formation, household consumption and exports. Inventory changes contributed strongly to growth, adding 1.1 percentage points, mainly from trade inventories. Gross fixed capital formation rose 1.7%, supported by investments in machinery, equipment and weapon systems. Household consumption increased by 0.4%, led by transport, recreation, culture and food, while government consumption edged up 0.2%. Exports rose 0.7%, but a 3.1% jump in imports weighed on growth, with net exports subtracting 1.3 percentage points. Business sector value added increased 0.6%, while labor productivity rose 1.2%. Household real disposable income grew 2.5%, and the public budget surplus widened to SEK 26.3bn.
Sweden’s July retail sales volume rose 0.3% m/m, with durables down 0.3% and consumables excluding alcohol up 0.8%. Over May-July, sales fell 1.4% compared with the prior three months, with durables down 1.2% and consumables down 1.1%. On a y/y basis, sales grew 2.9% in constant prices, driven by a 4.7% increase in durables and a 0.4% rise in consumables. In non-working-day-adjusted terms, total retail trade also rose 2.9% y/y, with durables up 4.8% and consumables up 0.4%. Measured in current prices, turnover climbed 4.6% y/y, including 5.0% growth in durables and 4.1% in consumables.
Norway’s July retail trade sales rose 0.6% m/m on a seasonally adjusted basis, following a 1.1% increase over the May-July period versus the prior three months. On a y/y basis, retail sales volumes were up 5.1%. By category, non-specialized stores gained 1.6% m/m and food and beverages rose 0.8%, while automotive fuel fell 0.6%. ICT equipment climbed 1.3% and was up 18.9% y/y, while sales of other goods rose 1.2% m/m and 11.1% y/y. Household equipment edged up 0.2% m/m, cultural and recreation goods fell 2.6%, and trade not in stores dropped 1.7%. Wholesale trade excluding motor vehicles increased 0.7% m/m and 7.0% y/y. Overall, wholesale and retail trade including motor vehicles rose 0.6% m/m and 8.1% y/y. OSE +0.435% to 1643.3, EURNOK -0.045% to 11.7567, 10y NGB 0bp to 3.98%.
U.K. business confidence rose two points to 54 in August, though optimism in the economy slipped three points to 44, the first decline since April, according to the Lloyds Business Barometer. Economic optimism remains well above its long-term average of 19. Confidence in trading prospects climbed five points to 63, the strongest showing since 2014. Manufacturing confidence surged 14 points to 62, the highest since 2015, while retail rose 13 points to 57. However, construction fell five points to 40, a four-month low, and services declined eight points to 53. Regionally, London, the East of England and the West Midlands saw sharp gains, while Wales dropped 13 points but remained among the three most confident areas. FTSE 100 -0.282% to 9190.85, GBPUSD -0.356% to 1.3465, 10y gilt +2.8bp to 4.727%.
Czech Q2 GDP rose 0.5% q/q and 2.6% y/y, driven by higher final consumption and inventories, while gross fixed capital formation and net trade weighed negatively. Gross value added increased by 0.5% q/q and 2.8% y/y, supported by trade, transport, accommodation and food services (+1.7% q/q; +3.8% y/y), industry (+0.3% q/q; +2.2% y/y) and construction (+1.9% q/q), while finance and insurance fell (-4.6% q/q). Household consumption grew by 1.0% q/q and 3.4% y/y, and government consumption by 1.2% q/q and 2.2% y/y. Gross fixed capital formation rose 0.5% q/q but slipped 0.2% y/y. Inventories contributed CZK 36.7bn, up CZK 27.2bn y/y. Exports increased by 0.3% q/q and 4.2% y/y, while imports rose 1.5% q/q and 6.0% y/y, leaving the trade surplus at CZK 118.8bn, down CZK 11.0bn y/y. Prague SE -0.496% to 2271.09, EURCZK -0.176% to 24.492, 10y CZGB +0.2bp to 4.294%.
Poland’s August flash CPI rose 2.8% y/y, down from 3.1% in July, with the index at 102.8. On a monthly basis, prices fell 0.1% (index 99.9). Food and non-alcoholic beverages increased 4.8% y/y but were flat m/m. Electricity, gas and other fuels rose 2.3% y/y and 0.1% m/m. Fuels for personal transport dropped sharply, down 7.7% y/y and 1.9% m/m. The decline in headline inflation kept CPI slightly above the 2.5% target but closer to the range observed in early 2024, marking the lowest rate since March 2024. WIG -0.895% to 105082.1, EURPLN +0.024% to 4.2665, 10y PGB -1.7bp to 5.515%.
Türkiye’s July unemployment rate fell 0.4 percentage points to 8.0%, with male unemployment at 6.5% and the female rate at 10.9%. The number of unemployed people dropped by 164,000 to 2.83 million, while employment rose by 18,000 to 32.58 million, keeping the employment rate stable at 49.1% (66.1% for men, 32.4% for women). The labor force participation rate decreased by 0.3 percentage points to 53.3% (70.6% for men, 36.4% for women). Youth unemployment (15-24) declined to 15.0%, down 0.9 percentage points. Average weekly actual working hours reached 42.6, up 1.2 hours from June. The composite measure of labor underutilization eased by 3.1 percentage points to 29.6%, while the combined underemployment and unemployment rate was 19.1%. BI 100 -0.085% to 11359.08, USDTRY +0.273% to 41.1493, 10y TGB -9bp to 31.05%.
Australia’s July private sector lending rose 0.7% m/m, above the 0.6% forecast, following 0.6% in June. Business lending led the gain, with non-financial business lending up 1.4% m/m and selected financial lending up 1.5%. Housing lending increased 0.5% m/m, steady versus June, while owner-occupier and investor housing lending rose 0.5% and 0.6%, respectively. Other personal lending slowed slightly to 0.4% m/m. On a y/y basis, total lending expanded 7.2% versus 6.9% in June. Business lending grew strongly at 10.0% y/y, with non-financial lending maintaining double-digit growth. Housing lending rose 6.0% y/y, while investor housing loans accelerated to 6.6% y/y. Broad money rose 6.4% y/y, while M3 increased 6.6% y/y. ASX -0.308% to 4975.26, AUDUSD -0.046% to 0.6529, 10y ACGB -1.1bp to 4.275%.
South Korea’s government has proposed a budget of ₩728tn ($525bn) for 2026, aiming to significantly boost R&D and AI spending to drive future economic growth. The proposed 2026 budget marks an 8.1%, or ₩54.7tn, increase from the government’s budget proposal for this year, a sharp acceleration from increases of 2.8% y/y and 3.2% y/y in 2024 and 2025, respectively. The debt-to-GDP ratio is projected to increase from 47.4% in 2024 to 49.1% in 2025 and further rise to 58.0% by 2029. KOSPI -0.323% to 3186.01, USDKRW +0.513% to 1391.95, 10y KTB -0.7bp to 2.815%.
South Korea’s industrial output, retail sales and facility investment all rose from a month earlier in July. Industrial production edged up 0.3% m/m, marking the second consecutive month of increase, or 5.0% y/y. Retail sales, a gauge of private spending, went up 2.5% m/m, also marking the second consecutive monthly increase, or 2.4% y/y. Facility investment saw a sharper increase in July, gaining 7.9% m/m, ending four consecutive months of decline through June. The country’s July cyclical leading index was up 0.5% m/m, the best since November 2020, or 0.69% y/y from a low of -0.2% at the start of the year. The upward trend in the leading index bodes well for GDP growth ahead. Note that the BoK has revised 2025 GDP up to 0.9%, with a further rise to 1.6% for 2026. Broken down by quarter, Q3 GDP is projected to surge 1.1% q/q, 1.6% y/y, before falling back to 0.2% q/q, 1.5% y/y in Q4 2025 and 0.3% q/q in Q1 and Q2 2026.
Philippines July exports grew more strongly than expected, up 17.3% y/y to $7.340bn, but eased from an upwardly revised 26.9% y/y in June. Imports grew 2.3% y/y to $11.380bn, producing a trade deficit of $4.050mn or -17% y/y. By commodity group, electronic products continued to be the country’s top exports in July 2025, with total earnings of $3.92bn or 53.5% of the country’s total exports during the period. This was followed by other mineral products with an export value of $522.39mn (7.1%). By major trading partner, exports to the U.S. represented the highest export value, at $1.16bn or a 15.8% share of the country’s total exports in July 2025. Elsewhere, exports were $1.12bn to Hong Kong (15.2%); $996.44mn to Japan (13.6%); $832.57mn to China (11.3%); and $317.25mn to the Netherlands (4.3%). PSEi -0.559% to 6155.57, USDPHP +0.041% to 57.143, 10y PHGB +0.2bp to 5.932%.
Indonesian assets were rocked by the protests in Jakarta. The Indonesian JCI equity index was down 2%, and the 10y INDOGB yield surged 4bp to 6.35%, unwinding the gains to back to last Friday’s close. USDIDR is 0.7% higher and nearing the top of the recent trading range at around 16500 points. Thousands of students, workers and activists have clashed with riot police over lawmakers’ housing allowances, which are IDR 50mn ($3,075) per month – nearly ten times the Jakarta minimum wage. Protestors have demanded the abolition of such perks, branding them excessive alongside parliamentary salaries. Tensions remain high amid the country’s ongoing austerity drive. JCI -1.529% to 7830.493, USDIDR +0.888% to 16490, 10y IDGB +4.9bp to 6.359%.
Thailand’s economy softened in July as services and manufacturing slowed from temporary factors, though merchandise exports rose. Headline inflation fell 0.7% m/m, while employment was unchanged. Private consumption declined 0.2%, and private investment fell 0.4%. Government expenditure excluding transfers increased 1.3%. Merchandise exports excluding gold rose 0.3% m/m, led by electronics and appliances, while imports excluding gold dropped sharply by 6.0%. Tourist arrivals increased by 2.0%, supported by higher Chinese inflows, though tourism revenue per trip declined. The current account surplus stood at $2.2bn. Manufacturing output fell due to refinery maintenance and automobile production adjustments, but underlying production excluding these disruptions improved. Employment conditions remained broadly stable, though unemployment claims edged higher. Key risks included U.S. trade policy, tourism performance and border developments with Cambodia. SET -0.902% to 1238.81, USDTHB +0.047% to 32.388, 10y TGN -0.5bp to 1.294%.