Market Movers: Employment
Market Movers highlights key activities and developments before the U.S. market opens each morning.
Market Movers highlights key activities and developments before the U.S. market opens each morning.

Bob Savage
Time to Read: 14 minutes
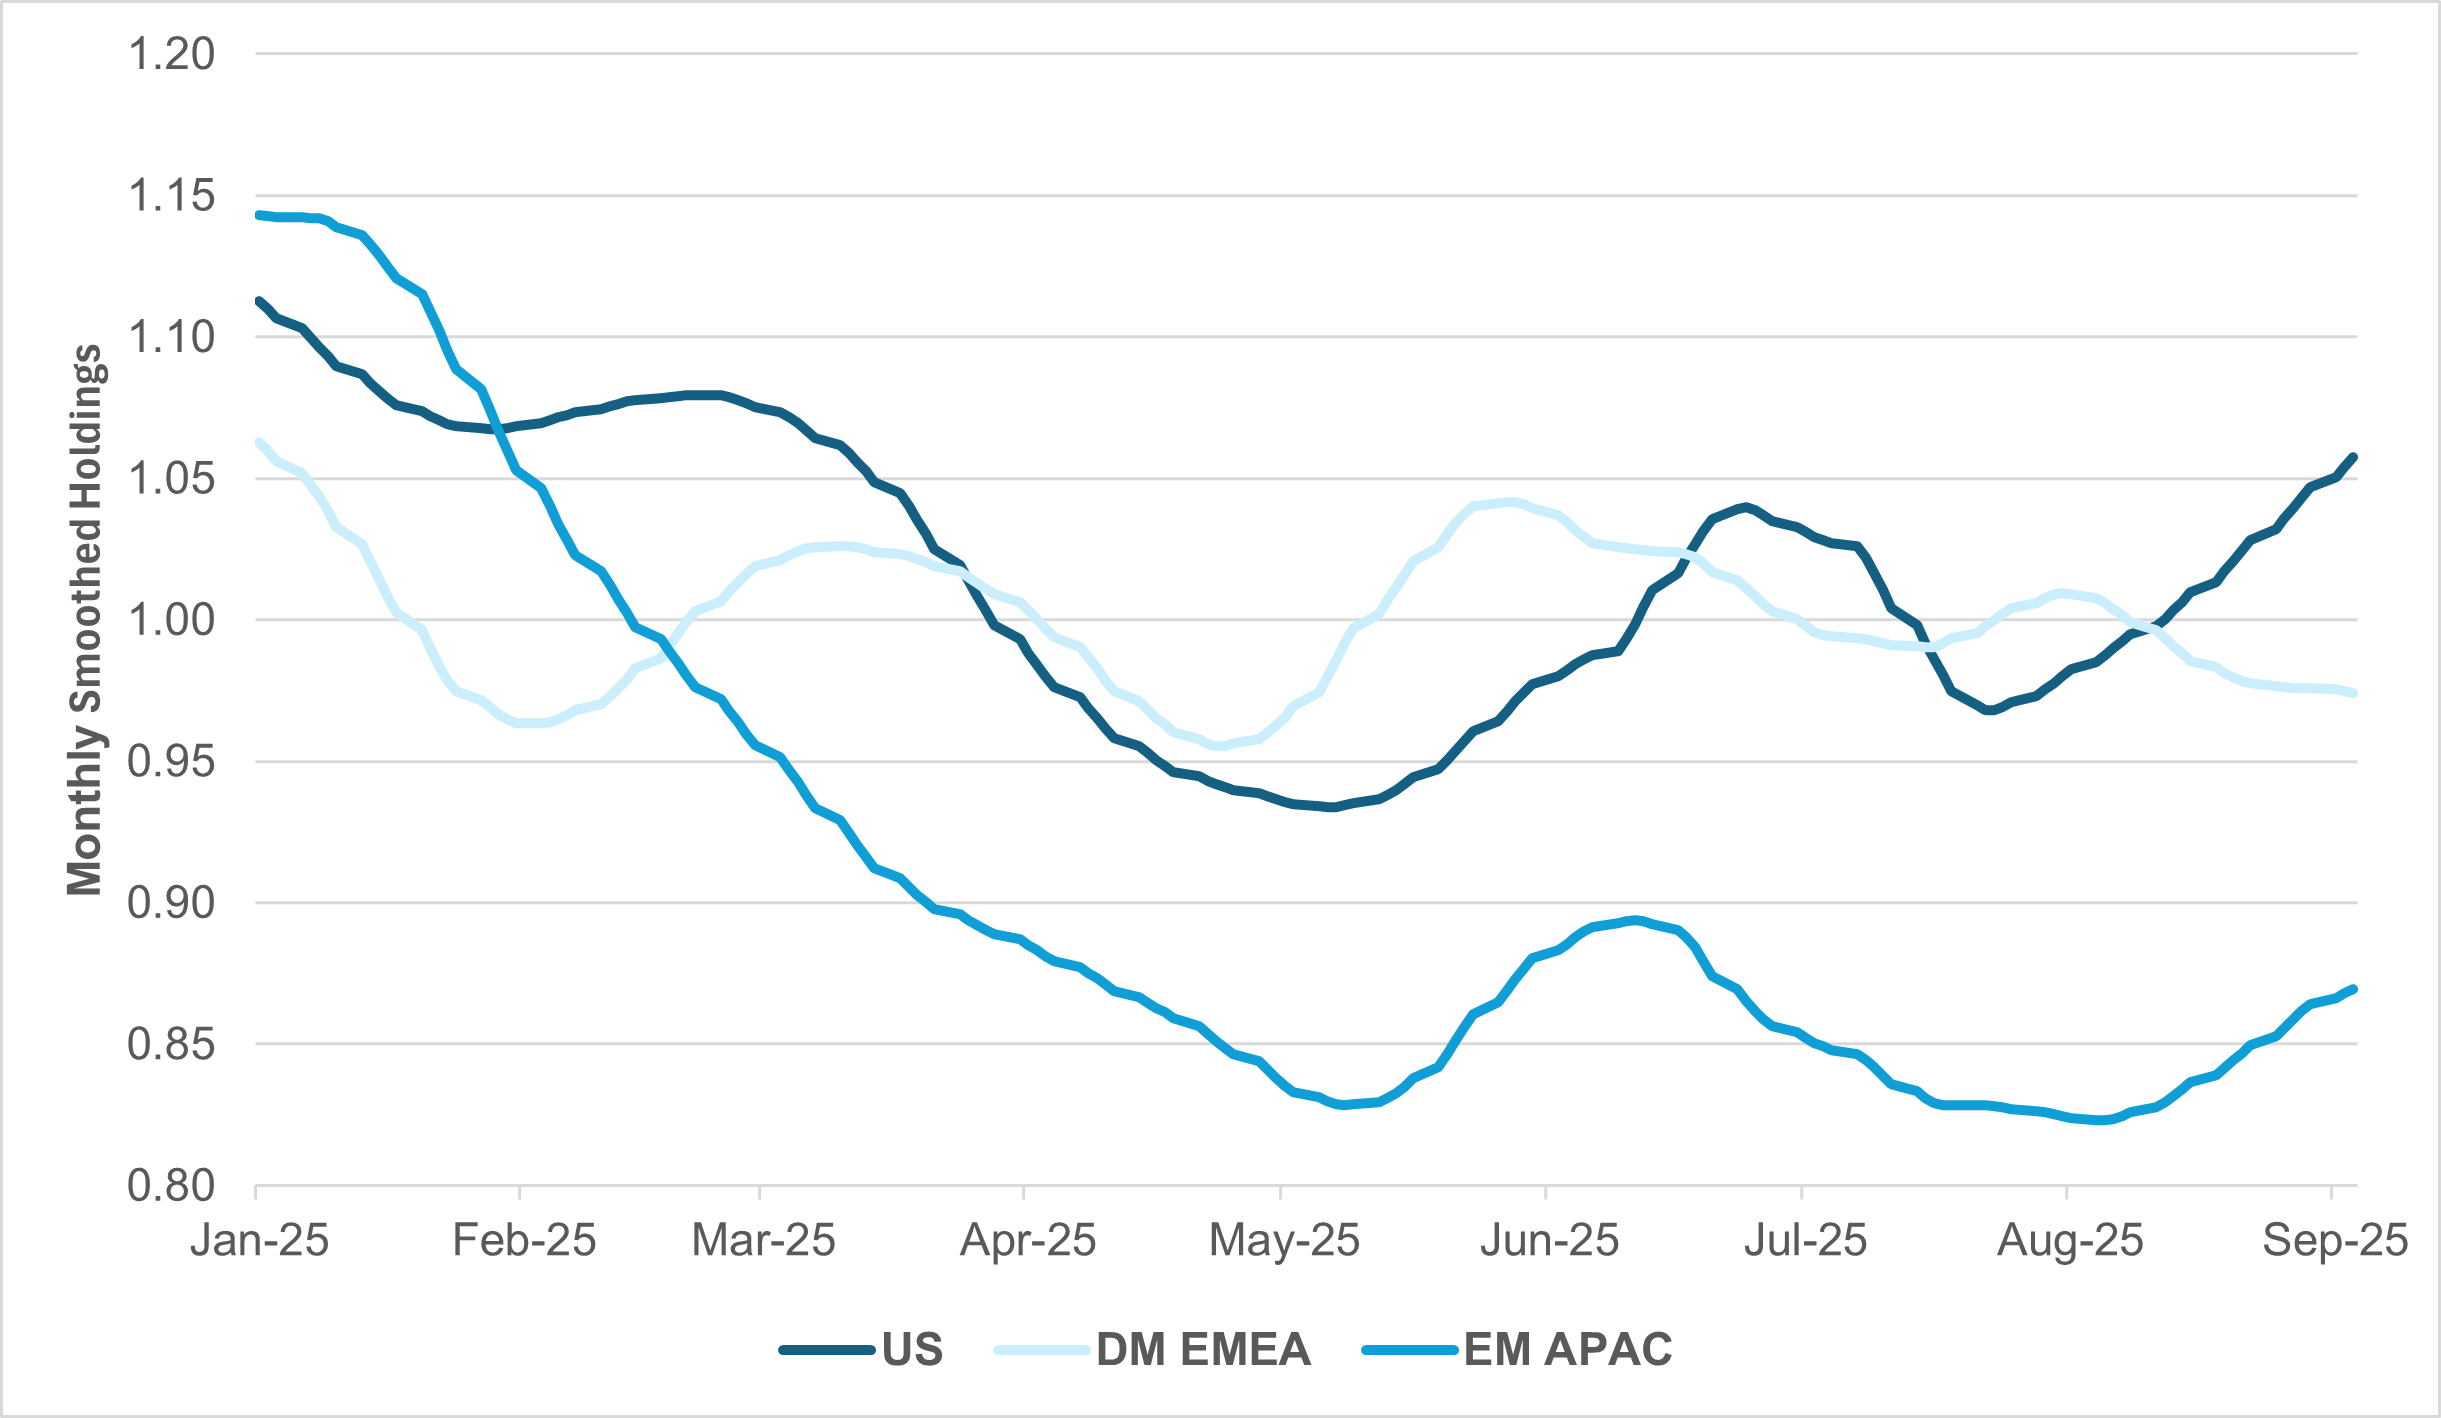
Retail equity holdings, U.S. vs. DM EMEA and EM APAC
Source: BNY
If markets are becoming even more cautious on U.S. households and consumer spending on fears of a weakening labor market, that certainly isn’t showing in equities at present. Wage growth is robust across the developed world, but as economic expectations adjust, there is no guarantee that incremental disposable income will be spent on either goods or services. As seasonal demand for services globally begins to wane, we would expect nerves to start jangling ahead of the Q4 retail season, and that is even before taking into account the tariff-related pricing adjustments. Nevertheless, YTD equity holdings show very little indication of a correction, especially in developed markets, where the U.S. consumer is dominant. We note that consumer discretionary shares are now at their best-held position since early March, while consumer staples are also close to their best-held status this year. If we use U.S. retail as the benchmark and compare it against the world’s other two core economic regions, DM EMEA and EM APAC, the gap is striking. Retail equity holdings in both the latter two regions are below the rolling 12-month average, and in Europe’s case are only slightly above the year’s lows. Household spending was never expected to drive Europe forward and public investment is the main theme for the region, as borne out by very high industrial and defense equity holdings. However, for the market to expect so little spillover from fiscal expansion is a surprise. In EM APAC, holdings are clearly off their YTD lows, but that is a very poor benchmark. Even now, retail equity holdings are struggling to get to just 90% of the rolling one-year average. Clearly the market is not expecting APAC consumers to embark on a year-end spending binge, despite better fiscal support in 2025.
Global markets have rallied, gold has rallied, USD is lower. Markets are awaiting the U.S. employment report with expectations of a “just right” number: weak enough to ensure a Fed rate cut, but not so feeble as to worry about growth. The range for that outcome rests on non-farm payrolls coming in somewhere between 25,000 and 125,000. Too strong a number would also bother investors, as it might mean fewer rate cuts ahead and more trouble with the data. The August jobs report has a long history of being a disappointment, undershooting its forecast 70% of the time. This has been blamed on the adjustments linked to holidays, the weather and the way education, leisure and other jobs are skewed by the return to school. There is another problem, namely the denominator, as the size of the U.S. workforce has shifted because of demographics, immigration policy and the cost of living. There is no doubt that the actual participation rate and unemployment rate will matter to how the headline NFP number is seen. Then there are revisions, with a risk that July will be marked down to nearer the three-month average of 35,000. All of this puts today’s U.S. data front and center in understanding the U.S. consumer, the Q3 growth rate and how markets see the fair value of bonds, stocks and the dollar. Pressure to rethink the current late-summer trends will follow any surprise. However, there is an inherent weakness in the logic of making a single data point the ultimate driver for risk, and that seems clear from the headlines overnight, where European and Asian politics and growth are all competing for attention and capital. The waiting process being almost over leaves room for more thematic worries into the week ahead, including CPI numbers, the ECB meeting, Chinese economic data and the conundrum of how to set up for more bond issuance. There is plenty of work for investors as they scale the wall of worry.
Denmark’s central bank governor Christian Kettel Thomsen said the country should consider adopting the euro to deepen EU integration and gain influence in monetary decision-making. He noted Denmark is “already a euro country” due to its krone being pegged to within 2.25% of the euro, but joining would provide greater security amid global uncertainty and allow stronger participation in European cooperation. Denmark has held an opt-out since 1992, reaffirmed in a 2000 referendum, and public opinion remains the most skeptical among non-euro EU states. While Bulgaria prepares to adopt the euro in January, Thomsen stressed that Denmark’s choice remains a political one, though adoption could offer added protection in volatile times. OMX 20 0.197% to 1576.147, EURDKK -0.003% to 7.4646,10y DGB -1bp to 2.552%.
Euro area GDP grew 0.1% q/q in Q2 2025, slowing from 0.6% in Q1, while EU GDP rose 0.2%. Compared with Q2 2024, GDP increased by 1.5% in the euro area and 1.6% in the EU. Denmark posted the strongest growth at 1.3%, followed by Croatia and Romania at 1.2%, while Germany (-0.3%) and Italy (-0.1%) contracted. Household consumption rose 0.1% in the euro area and government spending was up 0.5%, while gross fixed capital formation fell by 1.8% and exports by 0.5%. Employment increased by 0.1% q/q in both the euro area and EU, up 0.6% y/y and 0.4% y/y, respectively, with Bulgaria (+1.1%) leading job growth and Lithuania (-0.9%) recording the sharpest decline. Euro Stoxx 50 +0.197% to 5357.22, EURUSD +0.284% to 1.1682, BBG AGG Euro Government High Grade EUR -1.4bp to 2.897%.
China’s Ministry of Commerce has issued a preliminary ruling in the anti-dumping investigation into EU pork and pork by-products, confirming dumping, injury to the domestic industry and causality. It has decided to impose provisional measures in the form of deposits, with rates of 15.6% for Spain’s Litera Meat, 31.3% for Denmark’s Danish Crown, 32.7% for the Netherlands’ Vion Boxtel, 20.0% for other cooperating EU firms and 62.4% for non-cooperating firms. It stressed, however, that China applies trade remedies prudently and will continue the investigation in line with Chinese law and WTO rules before making a final decision. CSI 300 +2.179% to 4460.33, USDCNY -0.052% to 7.1379, 10y CGB +1.7bp to 1.774%.
Anutin Charnvirakul has secured enough votes to become Thailand’s next Prime Minister. Anutin, a former deputy prime minister and health minister known for legalizing cannabis in 2022, has secured enough support from opposition blocs, including the People’s Party, make it likely he will achieve the 247 votes needed. Their backing is conditional on fresh elections within four months, however. His expected rise marks another setback for the Shinawatra dynasty, whose dominance has been eroded by legal and political challenges, including Thaksin Shinawatra facing a Supreme Court ruling next week. SET +1.209% to 1267.69, USDTHB -0.427% to 32.195, 10y TGN -0.3bp to 1.241%.
U.S. August non-farm payrolls forecast at 75k vs. 73k in July.
U.S. August unemployment rate expected to rise to 4.3% from 4.2% y/y.
U.S. August average hourly earnings forecast at 0.3% m/m, 3.7% y/y from 0.3% m/m, 3.9% y/y in July.
Mood: Sentiment continues to normalize, led by increasing appetite for equities, against easing demand for core sovereign bonds. iFlow Mood is negative but in the risk-neutral zone.
FX: Currencies flows were mixed and light except for significant HUF inflows against ILS outflows. Within the G10, USD and CHF were lightly sold, against inflows into AUD and NZD. LatAm currencies were sold, led by CLP. In APAC, flows were dominated by INR inflows vs. SGD outflows.
FI: U.S. Treasurys, U.K. gilts and Eurozone government bonds posted the most buying, while Danish, Singapore and Poland government bonds were most sold.
Equities: European, Canadian, U.K., Japanese and U.S. equities were sold, against better buying in APAC and LatAm, led by Singapore, South Korea, Taiwan, Brazil and Peru.
“The two most important days in your life are the day you are born and the day you find out why.” – Ernest Campbell
“It’s not the employer who pays the wages. Employers only handle the money. It is the customer who pays the wages.” – Henry Ford
Euro area total market production fell 0.7% m/m in June 2025 after a 0.5% rise in May, while EU output decreased 0.5% m/m. Compared with June 2024, production was down 1.0% in the euro area and 0.8% in the EU, with capital goods posting the steepest y/y decline at -3.5% in the euro area and -2.9% in the EU. Intermediate goods fell 2.3% and 1.9%, respectively, while energy output decreased by 0.8% and 0.2%. By contrast, consumer non-durables grew 1.6% in the euro area and 1.7% in the EU. Services production also fell 0.1% m/m in June, though it rose 2.9% y/y in the euro area and 3.3% y/y in the EU, with the strongest gains recorded in Greece, Estonia and Poland. Euro Stoxx 50 +0.197% to 5357.22, EURUSD +0.284% to 1.1682, BBG AGG Euro Government High Grade EUR -1.4bp to 2.897%.
U.K. retail sales volumes fell by 0.6% q/q in the three months to July 2025. This was mainly due to declines in food stores, sports equipment, games and toys stores, and household goods stores, partially offset by a 2.5% rise in non-store retailing, predominantly online. Monthly sales volumes increased by 0.6% in July following a 0.3% rise in June, with a 1.1% rise over the year to July. Non-food stores rose 0.6% m/m, driven by a 2.5% increase in clothing stores, marking the largest annual rise since January 2023. Online spending values grew by 2.0% m/m and 3.7% y/y, with total retail spend rising 1.0% m/m, taking the online sales share to 27.8% in July from 27.5% in June. Sales volumes remain 2.2% below pre-pandemic levels. FTSE 100 +0.264% to 9241.21, GBPUSD +0.246% to 1.3467, 10y gilt -1.4bp to 4.706%.
U.K. house prices rose 0.3% m/m in August 2025, the third consecutive monthly increase, taking the average property price to a record £299,331. Annual growth eased slightly to 2.2% from 2.5% in July, while quarterly growth stood at 0.4%. First-time buyer affordability improved, with the average price for this group falling 0.6% vs. May to £237,577. By region, Northern Ireland led annual growth at 8.1%, followed by Scotland at 4.9% and northern regions of England at rates above 4%, while the South West posted a 0.8% decline. London recorded modest growth of 0.8%, remaining the U.K.’s most expensive region at an average price of £541,615. Transaction volumes and mortgage approvals rose y/y, indicating resilient demand.
Germany’s manufacturing sector recorded a 2.9% m/m fall in real order intake in July 2025, seasonally and calendar-adjusted, following a revised 0.2% decrease in June. The drop was largely driven by a 38.6% fall in new orders in other vehicle manufacturing (including aircraft, ships, trains, and military vehicles), which had seen a high volume of large orders in June, and a 16.8% decrease in electrical equipment production. Conversely, the automotive industry experienced a 6.5% increase in orders. Investment goods orders fell by 2.4% and intermediate goods by 5.3%, while consumer goods orders rose by 4.3%. Foreign orders declined by 3.1%, with Eurozone orders down 3.8% and non-Eurozone orders down 2.8%. Domestic orders decreased by 2.5%. Meanwhile, real manufacturing turnover rose by 0.9% m/m in July and was up 2.3% y/y, with June turnover revised up to a 1.4% m/m increase. DAX +0.185% to 23814.23, EURUSD +0.284% to 1.1682, 10y Bund -0.7bp to 2.712%.
France’s July 2025 trade deficit narrowed by €0.2bn to €6.5bn as imports rose €0.3bn to €57.7bn and exports increased €0.5bn to €51.2bn. The energy balance improved by €0.3bn to -€3.6bn due to lower import volumes and stronger exports, while the non-energy balance slipped €0.1bn. Manufactured goods trade worsened by €0.2bn, with consumer goods down €0.2bn to -€1.1bn as imports climbed €0.2bn against flat exports. Investment goods and intermediate goods balances remained stable at -€2.0bn and -€1.7bn, respectively, with both imports and exports rising €0.2bn. The 12-month cumulative trade deficit improved to €80.3bn. CAC40 +0.116% to 7707.85, EURUSD +0.284% to 1.1682, 10y OAT -1.1bp to 3.48%.
Italy’s July 2025 retail sales were flat m/m by value, while volumes fell 0.2%. Food sales declined 0.4% in value terms and 0.9% in volume terms, whereas non-food sales increased 0.3% by both value and volume. Over May-July, sales rose 0.6% by value and 0.1% by volume, with both food (+1.1% value, +0.1% volume) and non-food goods (+0.4% value, +0.2% volume) showing gains. Year on year, retail sales grew 1.8% by value but were flat by volume, with food up 2.9% by value but down 0.8% by volume, and non-food up 1.0% by value and 0.5% by volume. By product group, perfumes and personal care rose 3.7%, while household appliances, radios and TVs fell 3.1%. All distribution channels posted y/y growth, led by large-scale retail (+2.8%) and e-commerce (+2.9%). FTSEMIB +0.082% to 42024.1, EURUSD +0.284% to 1.1682, 10y BTP -2bp to 3.549%.
Spain’s Q2 2025 housing price index rose 12.7% y/y, with new housing up 12.1% and second-hand housing up 12.8%. On a quarterly basis, prices increased 4.0%, with new housing rising 2.6% and second-hand housing climbing 4.2%. Meanwhile, the Q2 2025 merchandise stock index for trade grew 0.9% y/y and 1.1% q/q. Motor vehicle sales and repair led with a 6.4% y/y rise and 2.7% q/q increase, while wholesale trade edged up 0.3% y/y and 0.4% q/q. Retail trade declined 1.4% y/y despite a 1.4% q/q increase. IBEX 35 +0.019% to 14933, EURUSD +0.284% to 1.1682, 10y Bono -1.7bp to 3.288%.
Switzerland’s consumer sentiment index as calculated by the State Secretariat for Economic Affairs (Seco) fell by 5.3 points y/y to -39.9, reflecting a significant deterioration in confidence. The drop is largely attributed to the 39% tariffs imposed by President Trump on Swiss products in early August. The expected economic development sub-index declined particularly steeply: it was almost back to its April level, when sentiment had deteriorated to -42.4 before partially recovering. In contrast, the sub-indices for past financial situation, expected financial situation and timing for major purchases remained stronger than the previous year. Sentiment also weakened m/m, with July’s -32.8 points down 7.1 points. SMI +0.283% to 12418.54, EURCHF -0.017% to 0.93852, 10y Swiss GB -2.2bp to 0.285%.
Norway’s July 2025 market-oriented services turnover fell 1.1% m/m but rose 5.4% y/y, with declines in transportation (-1.7% m/m) and professional, scientific and technical activities (-4.0% m/m), partly offset by gains in information and communication (+0.1% m/m) and administrative and support services (+0.5% m/m). Accommodation and food service turnover slipped 0.1% m/m. On production, services output grew 1.5% m/m, lifting y/y growth to 5.1%. Information and communication (+1.7% m/m) and administrative and support services (+4.7% m/m) led gains, while transportation (+0.3% m/m) and accommodation and food services (+0.4% m/m) posted smaller increases. Professional, scientific and technical activities rebounded 1.4% m/m after declines earlier in the year. OSE +0.108% to 1631.48, EURNOK -0.163% to 11.735, 10y NGB -0.1bp to 4.006%.
Norway’s July 2025 production in extraction, mining, manufacturing and electricity rose 0.4% m/m and 1.0% q/q, though output was down 3.5% y/y. Manufacturing was flat m/m, with food, beverages and tobacco up 2.0%, while refined petroleum, chemicals and pharmaceuticals fell by 2.6% and basic metals by 2.9%. Electricity, gas and steam surged 6.3% m/m. Turnover for the sector increased by 1.4% m/m but shrank by 3.6% q/q and 0.6% y/y, totaling NOK 214.7bn. Mining and quarrying turnover jumped 22.8% m/m and 10.8% y/y, while ships, boats and oil platforms rose 13.0% m/m and 19.4% y/y. By contrast, refined petroleum products turnover fell 9.8% y/y and basic metals dropped 9.5% y/y.
Sweden’s August 2025 housing market showed largely unchanged prices for both tenant-owned apartments and houses, with overall levels flat compared to last year. Condominium prices were stable in Greater Gothenburg, Central Stockholm and Central Gothenburg, while rising 0.8% in Greater Malmö but falling 1.1% in Greater Stockholm. Annually, Malmö led with a 3.5% increase, while Stockholm was flat. House prices were unchanged in Gothenburg and Malmö, but down 1.5% in Greater Stockholm, with annual changes ranging from +1.5% in Malmö to -0.8% in Stockholm. Sales reached 13,800 in August, in line with last year, while January-August transactions rose 4% y/y to 109,300. OMX +0.947% to 2632.226, EURSEK -0.192% to 11.0013, 10y Swedish GB 0bp to 2.613%.
Sweden’s central government posted a budget surplus of SEK 42.9bn in August 2025, exceeding the Debt Office’s forecast of SEK 32.6bn by SEK 10.3bn, mainly due to lower net lending to government agencies. The primary balance was SEK 1.3bn stronger than expected, though tax revenues were SEK 1bn lower. Net lending to agencies was SEK 9.8bn below forecast, driven by higher deposits from the Swedish Pension Agency and Defence Materiel Administration. Interest payments were SEK 0.9bn higher than forecast. For the 12 months to August, central government payments showed a deficit of SEK 107.8bn, with central government debt standing at SEK 1.102tn.
Czech July retail sales rose 2.5% y/y in real terms but declined 0.3% m/m. Excluding motor vehicles, sales were down 0.3% m/m, with non-food down 0.4%, food down 0.2% and fuel flat. Year on year, automotive fuel sales jumped 8.3% and non-food sales rose 3.5%, while food fell 0.9%. Strong gains were seen in cosmetics (+7.9%), medical goods (+5.9%), cultural and recreation goods (+4.5%) and internet/mail order sales (+6.7%). Sales fell in information and communication equipment (-5.3%), clothing and footwear (-1.5%) and food in specialized stores (-1.4%). Motor vehicle sales, including repairs, rose 1.5% m/m and 4.8% y/y, with vehicle sales up 5.2% and repairs up 3.0%. Prague SE +0.428% to 2285.3, EURCZK -0.095% to 24.429, 10y CZGB -0.4bp to 4.386%.
Hungary’s industrial production registered a 1.0% y/y fall in July while increasing by 2.0% m/m, based on seasonally and working-day-adjusted data. The production volume fell y/y in most manufacturing subsectors, with notable output rises in transport equipment, food products, beverages, tobacco, and computer, electronic and optical products. Conversely, the manufacture of electrical equipment experienced a decrease. For the first seven months of the year, industrial production was 3.5% lower than in the same period in the previous year. The working-day-adjusted index matched the non-adjusted figure, confirming the robustness of the reported changes. Budapest SI -0.174% to 104281.1, EURHUF -0.097% to 392.61, 10y HGB -1bp to 7.14%.
Japan July labor cash earnings rose to 4.1% y/y (consensus: 3.0%) from 2.5% y/y, while real cash earnings turned positive for the first time since December 2024, at +0.5% y/y. This marks the fastest increase in seven months, while real wages advanced 0.5% y/y in the first rise this year. Base salaries increased 2.5%, with a stable measure for regular workers up 2.4%. The wage growth momentum follows union-led pay rise pledges exceeding 5% for a second consecutive year, the largest gains in 34 years. Summer bonuses contributed, with a 7.9% increase vs. June. Household consumption grew 1.4% y/y in July, driven by transport and communications. Despite positive domestic demand, export prospects remain uncertain due to U.S. trade policies, with exports declining for three months, including the sharpest fall in four years in July. Nikkei +1.03% to 43018.75, USDJPY -0.223% to 148.16, 10y JGB -1.8bp to 1.58%.
South Korean banks’ bad-loan ratio remained unchanged vs. Q1 2025, at a four-year high. Loans classified as substandard or below (SBL) held by local banks came to ₩16.6tn ($11.9bn) as of end-June, the same level as three months earlier, according to the data from the Financial Supervisory Service. The ratio of SBLs to total outstanding loans stood at 0.59% at the end of June, unchanged from three months ago, which marks the highest level in four years. KOSPI +0.134% to 3205.12, USDKRW -0.355% to 1390.35, 10y KTB -3.1bp to 2.88%.
Philippines August inflation rose more than expected from 0.9% y/y to 1.5% y/y, against a consensus of 1.2%. Core inflation climbed to 2.7% y/y, the highest level since December 2024 (2.8% y/y). On the month, both headline and core CPI surged to 0.6% m/m (the highest since December 2024) and 0.5% m/m, the most since February 2023. The uptrend in overall inflation in August 2025 was primarily attributable to the annual increase in the heavily weighted index of food and non-alcoholic beverages (+0.9% y/y; July: -0.2%) and the slower annual decrease for transport, at -0.3% vs. -2% y/y in July 2025. Rice price inflation was -17% y/y, from -15.9% y/y in July. PSEi +0.691% to 6149.13, USDPHP -0.255% to 56.92, 10y PHGB -1.7bp to 5.945%.
Taiwan’s August headline CPI rose from 1.53% to 1.60% y/y, while core CPI was 1.74% y/y from a downwardly revised 1.69%. On the month, August CPI rose 0.46% m/m, the most since January 2025 (0.55% m/m), driven by higher vegetable prices (27.69% m/m) due to heavy rains cause by Typhoons Danas and Podul. August PPI was 1.75% m/m, -4.98% y/y, mainly because of lower prices for chemical material (-11.89% y/y), pharmaceuticals (-11.19% y/y), petroleum and coal products (-7.81% y/y) and electronic parts (-5.79% y/y), while the indices for poultry and livestock, and electricity supply rose 6.51% and 5.54%, respectively. TAIEX 1.302% to 24494.58, USDTWD -0.333% to 30.598, 10y TGB -0.4bp to 1.365%.