Market Movers: Discipline
Market Movers highlights key activities and developments before the U.S. market opens each morning.
Market Movers highlights key activities and developments before the U.S. market opens each morning.

Bob Savage
Time to Read: 16 minutes
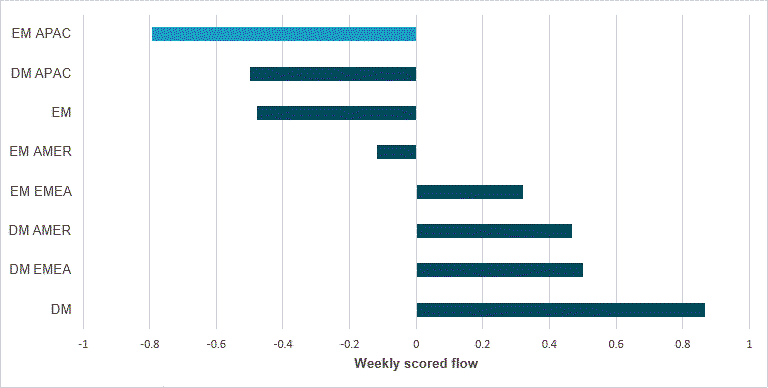
WEEKLY SOVEREIGN BOND FLOWS BY REGION
Source: BNY
The market has been squarely focused on developments in European bond markets, especially in the U.K. and France. Undoubtedly, fiscal sustainability and stagflation in the developed world remain risks to bonds, but we don’t see any substantial change in fundamentals that would justify a sense of panic. Tracking the flows seen across global sovereign markets over the past week, we observe that DM EMEA is the best-performing market. The U.K. Debt Management Office reported record demand for a 10y issue. In contrast, the best “funded” region, namely EM APAC, is seeing strong outflows. This region continues to struggle with low yields and growth weakness. Unless a true fiscal crisis materializes in developed Europe, we believe wider yield differentials will continue to undermine APAC, while idiosyncratic factors should not be dismissed either. Breaking down the individual flows in EM APAC sovereign debt over the past week, the three markets that have experienced net sales are Thailand, Indonesia and China. We have already addressed the first two of these earlier this week, as domestic factors are clearly playing a role; for now, these do not have direct fiscal implications, so we are witnessing a simple risk aversion stance. For China, we also believe the outflows are idiosyncratic and reflect rotation away from bond markets and into equities. This underscores another source of “steepening risk” for APAC: bond holdings, especially among locals, have already been so strongly anchored that it is going to be difficult for further flattening to take place at the long end, especially with governments now starting to move fiscally. The difference between EM APAC and developed markets is that funding stimulus through domestic resources is largely out of the question, so steepening would reflect inflation risk rather than term premiums. The best-performing EM APAC market at present is the Philippines, which is wholly consistent with our view that the BSP will lean away from an overtly dovish stance; even the PHP has briefly moved into overheld territory of late, indicating higher yield preference.
The mixed tape for the day reflects the imposition of discipline on speculators by Chinese regulators, along with rising expectations of FOMC rate cuts. Yesterday’s weaker Fed Beige Book report, which showed stalling growth and lower wages, sets the stage for 25bp of easing in two weeks’ time, if the economic data ahead don’t deliver any surprises. Today’s important releases – the ADP employment report, labor costs, service ISM and weekly jobless claims – will help keep the focus on rates and foreshadow Friday’s U.S. jobs report. Overnight, successful bond sales in Japan and France eased debt concerns while leaving room for risk parity models to play, with bonds, stocks and carry trades all back in vogue for investor flows. However, the problem of the day is the dollar, which is up, defying the link to lower rate hopes or further hedging pressures on buying of U.S. assets. Discipline in the month ahead will rest on liquidity over leverage, as tax season payments and significant supply from private and government issues test the sustainability of market pricing and asset allocation mixes. This is the bedrock of the seasonality, where credit spread tightening clashes with the slowing economy and tariff pressures on corporate margins. The focus on where the money to fuel the ongoing asset gains is coming from starts today. Wages are an area that matters to U.S. consumer spending, while safe-haven gold is another for investors. Putting money to work requires more certainty and some discipline to find the best returns with the lowest volatility. Many remain dazzled by AI investments, with the headlines about Apple and Google providing a distraction from a broader and potentially wider rotation risk for all markets into the weeks ahead.
China’s financial regulators are considering several cooling measures to address concerns over a rapid $1.2tn stock market rally since August. Proposals include removing some short-selling restrictions and curbing speculative trading to prevent sharp reversals that could harm retail investors. Authorities have tasked banks with investigating illicit credit fund use in stocks and instructed brokerages to limit aggressive promotion of new account openings, which surged 166% m/m in August. Regulators have also warned social media platforms against amplifying bullish market content and illegal stock recommendations, with platforms such as WeChat pledging to restrict or ban offending accounts. Some firms have raised margin deposit requirements, exemplified by Sinolink Securities increasing its margin ratio to 100% from 80%. Despite these measures, no official interventions have been confirmed, as regulators seek to maintain market stability amid heightened trading volumes and record margin transactions. CSI 300 -2.122% to 4365.21, USDCNY -0.033% to 7.1398, 10y CGB +0.7bp to 1.758%.
Japan and the U.S. are close to finalizing a tariff reduction deal that will lower U.S. duties on Japanese automobile imports from 27.5% to 15%, expected to take effect by the end of September following a presidential executive order. The order, still pending signature by President Trump, will stipulate that the 15% levy will not be stacked onto items subject to higher tariffs, while goods with lower tariffs will be adjusted up to 15%. The deal, first agreed in July, also includes Japan’s commitments to expand U.S. rice imports, purchase U.S.-made aircraft and deliver a $550bn U.S.-bound investment package through equity, loans and guarantees from state-owned banks. Nikkei +1.529% to 42580.27, USDJPY +0.108% to 148.26, 10y JGB -3.4bp to 1.598%.
Switzerland’s Consumer Price Index (CPI) declined by 0.1% m/m, bringing the index to 107.7 points (December 2020 = 100), while annual inflation slowed to 0.2%, highlighting muted price pressures. The m/m fall was mainly driven by lower prices for international package holidays, supplementary accommodation, air transport and private vehicle hire, while housing rentals, clothing and footwear prices rose. Core inflation, excluding energy, fuel and seasonal products, also slipped by 0.1% but remained up 0.7% y/y, reflecting subdued underlying price dynamics. Imported goods fell 1.3% annually, offsetting domestic price gains of 0.6%. The Harmonized Index of Consumer Prices (HICP) dropped 0.1% m/m and remained flat y/y, underscoring limited inflationary pressures compared with the country’s European peers. SMI +1.312% to 12360.07, EURCHF -0.028% to 0.93747, 10y Swiss GB -5.2bp to 0.272%.
Bank Negara Malaysia (BNM) kept its benchmark interest rate unchanged at 2.75% with an upbeat overall growth assessment. BNM noted upside potential for global growth on the back of favorable outcomes from the U.S. trade negotiations and pro-growth policies in major economies. It is also upbeat on the domestic growth outlook, commenting that 2026 growth will continue to be supported by resilient domestic demand and by continued demand for electrical and electronic goods and robust tourism activity. On the inflation front, BNM sees headline inflation for 2025 and 2026 remaining moderate, supported by contained global cost conditions. It expects core inflation to be stable and close to the long-term average. BNM also expects the current overnight policy rate (OPR) to be “appropriate and supportive” of the economy amid price stability, suggesting that it will likely keep the rate at 2.75% at the next policy meeting in November, the last for 2025. KLCI -0.023% to 1578.15, USDMYR +0.083% to 4.2305, 10y MGB +1.8bp to 3.421%.
U.S. August ADP private employment change expected to ease to 80k from 104k in July.
U.S. Q2 final nonfarm productivity forecast to improve from 2.4% flash to 2.7% q/q; the unit labor cost is expected to ease from a preliminary 1.6% q/q to 1.4% q/q.
U.S. weekly initial jobless claims expected to come in at 230k vs. 229k in the previous week.
U.S. July trade balance forecast to widen to $-78bn from $-60bn in June.
U.S. August ISM services index is seen improving from 50.1 to 50.9.
Central bank speakers: John C. Williams, President of the New York Fed, will talk at a Signature Luncheon at the Economic Club of New York, sharing his views on the economic outlook, monetary policy and how to navigate a changing environment amid uncertainty
U.S. Treasury sells $100bn in 4-week bills and $85bn in 8-week bills.
Mood: Risk sentiment has continued to improve, with ongoing normalization of iFlow Mood, led by rising demand in the equities market along with further easing of demand for core sovereign bonds.
FX: HUF stood out with the most inflows amid mixed and light flows within the iFlow universe. USD, JPY and CHF were lightly sold within the G10, against better demand for NZD and AUD.
FI: Denmark, Singapore, Poland and Mexico government bonds were most sold. U.S. Treasurys, U.K. gilts and Eurozone government bonds were in demand. Elsewhere, Chinese and Indonesian government bonds were lightly sold.
Equities: Equities outflows were concentrated in Canada, the Eurozone and the U.K., followed by Japan and the U.S. There was better equities buying in Singapore, South Korea, Colombia, Sweden and Denmark. Within DM EMEA, the health care sector was the most bought, against selling in the materials and financials sectors.
“Self-discipline is when your conscience tells you to do something and you don’t talk back.” – W.K. Hope
“Discipline is the bridge between goals and accomplishment.” – Jim Rohn
The euro area’s retail trade volume declined by 0.5% m/m in July, following a 0.6% increase in June, while the EU saw a 0.4% m/m decrease after a 0.5% rise in June, according to Eurostat. On a y/y basis, retail sales rose by 2.2% in the euro area and 2.4% in the EU. Sector-wise, m/m July changes in the euro area included a 1.1% decrease for food, drinks and tobacco, a 0.2% increase for non-food products excluding automotive fuel and a 1.7% decline for automotive fuel sales. The EU showed similar trends, with a 0.9% drop for food and tobacco, a 0.2% rise for non-food products and a 1.3% fall for automotive fuel. Croatia (-4.0%), Estonia (-2.0%) and Germany (-1.5%) recorded the largest m/m declines in retail sales, while Lithuania (+1.5%), Latvia (+1.4%) and the Netherlands (+1.1%) posted the highest increases. Annually, retail volumes grew across all sectors in both regions, with Cyprus (+8.5%), Portugal (+6.1%) and Bulgaria (+6.0%) leading gains, and Slovenia (-0.7%) the only country to record a decrease. Euro Stoxx 50 -0.065% to 5321.57, EURUSD -0.112% to 1.1649, BBG AGG Euro Government High Grade EUR -2.7bp to 2.911%.
Eurozone August construction activity remained in decline but contracted at the slowest pace since February 2023, with the HCOB PMI rising to 46.7 from 44.7 in July. New orders fell for the 41st consecutive month, though at a softer rate, while housing remained the weakest subsector and commercial construction saw its steepest drop since November 2024. Civil engineering expanded for the second time in three months. Employment and purchasing activity both declined, but job cuts eased in Germany while Italy added staff. Input price inflation fell to a four-month low, and subcontractor usage contracted sharply. Business confidence was highly pessimistic, reaching its lowest level since January.
Germany’s construction sector contracted in August, as the HCOB PMI slipped to 46.0 from 46.3 in July. New orders continued to slide, weighed down by weak demand and high costs. Civil engineering provided the only bright spot, expanding solidly, while commercial activity fell to its lowest level since March and housing eased to its softest decline in two-and-a-half years. Employment cuts slowed for the third consecutive month, with August marking the weakest job shedding since April 2022. Input prices rose for the sixth month running but at a subdued pace, while subcontractor charges increased at their strongest rate in over a year. Business confidence deteriorated to a four-month low. DAX +0.285% to 23662.01, EURUSD -0.112% to 1.1649, 10y Bund -2.7bp to 2.713%.
U.K. construction activity fell for an eighth consecutive month in August, though the decline eased slightly with the PMI rising to 45.5 from July’s five-year low of 44.3. Residential building contracted sharply, with output at 44.2, while civil engineering dropped to 38.1, its fastest fall since October 2020. Commercial activity showed resilience, easing at a slower pace with an index of 47.8. New orders decreased for the eighth month in a row, though at the softest rate since January. Employment fell at the quickest pace since May, while subcontractor usage contracted markedly. Input cost inflation slowed to a ten-month low, but business optimism dropped to its weakest level since December 2022. FTSE 100 -0.017% to 9176.47, GBPUSD +0.008% to 1.3445, 10y gilt -2.6bp to 4.722%.
The BoE’s August DMP survey showed realized annual own-price growth rose by 0.1 percentage points to 3.7% in the three months to August, with year-ahead own-price inflation expectations steady at 3.7%. Year-ahead CPI inflation expectations increased by 0.1 percentage points to 3.3% on a three-month basis, while three-year ahead CPI expectations rose by 0.1 percentage points to 2.9%. Annual wage growth was 4.6%, down 0.1 percentage points from July, with expected year-ahead wage growth unchanged at 3.6%. Realized annual employment growth declined by 0.4 percentage points to -0.5%, and employment growth expectations fell by 0.3 percentage points to 0.2%. In response to April’s employer NIC changes, 66% of firms lowered profit margins, 34% raised prices, 46% reduced employment and 20% cut wages, with fewer firms taking these actions than anticipated earlier in the year.
France’s August construction PMI rose to 46.7 from July’s ten-month low of 39.7, marking the slowest decline since January 2023, though it remains in contraction. Residential building was again the main drag, while commercial activity saw a slower downturn after July’s sharpest fall in five years. Civil engineering expanded moderately for the second time in three months. New orders continued to decline, but at the softest pace since April, extending a three-and-a-half-year run of contraction. Job losses accelerated to their steepest rate since May 2020, and purchasing volumes fell sharply. Input costs continued rising, though inflation eased to a four-month low, while business sentiment remained pessimistic. CAC40 -0.335% to 7693.84, EURUSD -0.112% to 1.1649, 10y OAT -3.5bp to 3.507%.
Italy’s August construction activity contracted further, with the HCOB PMI falling to 47.7 from 48.3 in July, its lowest in a year. Output and new orders both dropped at the fastest rates in twelve months, while housing and commercial activity hit 13-month and 24-month lows, respectively. Civil engineering was the only segment to grow, posting its strongest expansion since late 2023. Employment continued to rise marginally, but at one of the weakest rates in the current 12-month sequence, while subcontractor usage dropped at the steepest pace in over five years. Input cost inflation remained subdued, and optimism improved slightly but stayed below historical averages. FTSEMIB +0.003% to 41786, EURUSD -0.112% to 1.1649, 10y BTP -3.6bp to 3.577%.
Switzerland’s unemployment rate rose to 2.8% in August 2025, up 0.1 percentage points from July, with total registered unemployed reaching 132,105 (+2.3% m/m, +18.6% y/y). Youth unemployment (15-24) climbed sharply, rising 19.0% m/m to 13,682, pushing the youth jobless rate to 3.2%. Among older workers (50-64), unemployment edged up 0.6% to 35,848, with their rate at 2.5%. The total number of job seekers eased slightly to 209,090 (-0.2% m/m) but remained 16.0% higher than a year earlier. Reported open positions dropped by 1,940 (-4.9%) to 37,865, though they were still up 4.5% versus August 2024. Short-time work affected 12,116 employees in May, a 1.2% increase. While the labor market remains historically tight, slower hiring and rising unemployment signal emerging stress. SMI +1.276% to 12355.72, EURCHF -0.044% to 0.93732, 10y Swiss GB -5.2bp to 0.272%.
Sweden’s August flash CPI inflation rate was 1.1% y/y, up from 0.8% in July, while CPI fell 0.4% m/m. Preliminary CPIF inflation rose to 3.3% y/y from 3.0% in July, with a 0.2% m/m decline. CPIF-XE (excluding energy) eased to 2.9% y/y from 3.2% in July, falling 0.5% m/m. Statistics Sweden noted that while overall inflation edged higher, CPIF-XE decreased. The flash estimates, published five working days before the official release, cover only CPI, CPIF and CPIF-XE at the aggregate level. The country’s Q2 current account surplus was SEK 84.5bn, down SEK 51.5bn from a year earlier, mainly due to lower primary income, driven by large dividend payments abroad and a wider services deficit. The trade surplus stood at SEK 81.0bn, down SEK 6.1bn, with exports at SEK 578.7bn and imports at SEK 497.7bn. Services recorded a deficit of SEK 40.1bn versus SEK 21.5bn a year earlier. Primary income surplus fell to SEK 71.0bn from SEK 97.0bn, while the secondary income deficit widened slightly to SEK 27.5bn. The financial account showed net borrowing of SEK 49.0bn. Sweden’s net international investment position rose to SEK 3,417.5bn, an increase of SEK 188.8bn from Q1. OMX +0.291% to 2604.767, EURSEK +0.174% to 11.008, 10y Swedish GB -1.7bp to 2.621%.
Norway’s Q2 2025 household financial accounts showed assets rising to NOK 7,712bn from NOK 7,444bn in Q1, while liabilities increased to NOK 4,841bn from NOK 4,752bn, lifting net financial assets to NOK 2,871bn. Net lending grew to NOK 62bn from NOK 53bn, with the debt-to-income ratio easing slightly to 217.2% and debt growth at 4.2%. Household disposable income was NOK 508.3bn, up from NOK 495.7bn in Q1, while savings rose to NOK 52.5bn, raising the savings ratio to 9.4%. The current account surplus stood at NOK 234.2bn, down from NOK 300.5bn in Q1, while the financial account posted net lending of NOK 277.3bn. OSE +0.536% to 1627.67, EURNOK +0.371% to 11.7515, 10y NGB -1.4bp to 4.009%.
Norway’s Q2 2025 price index for new dwellings rose to 172.1 (2015=100) from 165.0 in Q1, marking a 6.3% y/y increase after 4.5% in Q1. Detached house prices increased to 153.7 points from 150.8, up 4.5% y/y, while multi-dwelling prices climbed to 181.7 from 172.2, up 7.1% y/y. A year earlier, detached house prices had stood at 147.1 index points, with multi-dwellings at 169.6. The data show continued strong growth in multi-dwellings, which outpaced detached houses on both a quarterly and annual basis. Registered transfers of real estate increased by 6.3% y/y in Q2, driven by a 13% y/y gain in open market sales.
Hungary’s retail sales in July were 1.7% higher y/y but down 0.5% m/m, with domestic retail sales reaching HUF 1,739bn at current prices. Food retailing volumes increased by 2.3%, driven by a 3.4% rise among non-specialized food and beverage shops, while specialized food shops recorded a 1.2% fall. Non-food retail sales grew by 2.9%, supported by a 5.4% increase in pharmaceutical and cosmetics shops and a 3.6% rise in non-specialized manufactured goods stores, though declines were seen in textiles (-1.2%), books and computer equipment (-0.9%) and second-hand goods (-1.6%). Mail order and internet retailing expanded by 6.8%. Automotive fuel sales decreased by 2.4%, while motor vehicle and parts sales not belonging to retail data rose by 17%. For January-July, the retail trade volume increased by 2.9% y/y, with food up 2.8%, non-food up 4.2% and automotive fuel up 0.5%. Budapest SI +0.91% to 104066, EURHUF +0.056% to 393.89, 10y HGB 0bp to 7.15%.
Czech August flash CPI rose 2.5% y/y, easing from 2.7% in July, while prices increased 0.1% m/m. Excluding energy, inflation stood at 3.5% y/y, down from 3.7% in July. Services prices rose 4.7% y/y, up from 4.8% in July, with a 0.5% m/m increase, while goods prices grew 1.1% y/y after 1.4% previously, falling 0.2% m/m. Food, alcohol and tobacco rose 4.0% y/y, down slightly from 4.9%, while unprocessed food inflation came in at 7.8% y/y from 7.8% in July, falling 0.7% m/m. Energy prices remained a drag, falling 4.4% y/y after a 4.6% decline in July, and were down 0.4% m/m. Final August figures will be published on September 10. Prague SE +0.386% to 2268.61, EURCZK +0.009% to 24.435, 10y CZGB +1bp to 4.381%.
Australia July household spending rose 0.5% m/m, 5.1% y/y from 0.3% m/m, 4.6% y/y. The largest increases were in health (+1.8%), transport (+1.5%) and miscellaneous goods and services (+1.5%). Meanwhile, Australia July exports eased to 3.3% m/m from 6.3% m/m, while imports declined by -1.3% m/m after -1.5% in June, resulting in a larger trade surplus of $7.310bn. Rural goods rose 5.9% to $6.6bn, led by other rural products (+7.3%) and meat preparations (+7.2%). Non-rural goods gained 1.9% to $33.1bn, driven by mineral fuels (+5.1%) and metals (+7.4%). Imports of consumption goods fell 2.6% to $12.0bn, while capital goods rose 2.6% to $9.8bn and intermediate goods increased 1.1% to $15.6bn. Export gains were supported by higher LNG (+8.9%), thermal coal (+10.0%) and iron ore lump volumes (+10.7%), although iron ore fines fell 13.5%. ASX +0.085% to 4964.17, AUDUSD -0.291% to 0.6524, 10y ACGB -6.5bp to 4.354%.
New Zealand’s Q2 total building volume fell -1.8% q/q vs. an upwardly revised 1.3% q/q in Q1 2025 (from 0%), within which residential fell -2.9% q/q (vs. Q1: +2.8% q/q) and non-residential fell -0.4% q/q (Q1: -1.3% q/q). Residential construction prices were flat, while non-residential prices rose 0.4%. The actual value of building work was $7.8bn, down 8.5% y/y, comprising $4.8bn in residential (-9.1%) and $3.1bn in non-residential (-7.5%). By region, values fell in Auckland (-10%), Waikato (-13%), Wellington (-9.8%), “Rest of North Island” (-13%) and Canterbury (-3.6%), but rose 1.0% in “Rest of South Island”. For the year to June, key non-residential segments were offices and public buildings at $2.3bn (+3.2%), hospitals at $2.0bn (+6.2%), factories at $1.7bn (-1.8%) and education buildings at $1.6bn (-17%). NZX 50 +0.447% to 13133.2, NZDUSD -0.239% to 0.5864, 10y NZGB -4.9bp to 4.428%.
Japan weekly portfolio update, as of August 29, 2025: Japanese investors are back in foreign bonds. Japanese equities were sold for the second week, with seasonal biases toward further outflows. Japanese investors net bought a large ¥1.42tn of foreign bonds and net bought ¥482bn of foreign equities. Foreign investors net bought a low ¥397bn of JGBs, but YTD remains at record pace. Foreigners net sold Japanese equities for the second week, by ¥-786bn. Japan’s Chief Cabinet Secretary Yoshimasa Hayashi stated that it was “not true” that the government had decided to compile economic measures. He stressed that the government needs to manage the economy and finances in a way which ensures market confidence and “avoids sudden rise in long-term rates.” Nikkei +1.529% to 42580.27, USDJPY +0.088% to 148.23, 10y JGB -3.4bp to 1.598%.
South Korea’s July current account surplus came in at $10.778bn vs $14.265bn in June. The goods account recorded a $10.269bn surplus, as exports increased by 2.3% y/y to $59.78bn and imports decreased by 0.9% y/y to $49.51bn. The services account posted a $2.144bn deficit, owing to deficits in the travel and other business services accounts. The primary income account recorded a $2.946bn surplus due to an increase in income on equity. The secondary income account recorded a $293mn dollar deficit. Within the financial account, net assets increased by $11.08bn during July. Direct investment assets increased by $3.41bn and direct investment liabilities by $1.72bn, resulting in a net increase of $1.69bn. There was a $10.10bn increase in portfolio investment assets and a $7.64bn increase in portfolio investment liabilities, leading to a net increase of $2.46bn. Financial derivatives posted a net decrease of $0.24bn. Other investments saw a net increase of $5.12bn as a result of a $3.16bn increase in assets and a $1.96bn decrease in liabilities. Reserve assets increased by $2.05bn. KOSPI +0.515% to 3200.83, USDKRW +0.292% to 1393.4, 10y KTB +3.9bp to 2.911%.
India’s Finance Minister Nirmala Sitharaman has announced reduced GST rates, to take effect from September 22, 2025. She describes the move as “not just GST rate rationalization, but a structural reform which will ease compliance.” The GST council will reduce the tax slabs from four (5%, 12%, 18%, 28%) to two (5% and 18%), with a special 40% rate for “sin” goods such as tobacco, pan masala, carbonated beverages and luxury vehicles. From September 22, 2025, items such as ultra-high temperature milk, paneer and Indian breads will be nil-rated. Staples including namkeen, sauces, noodles, coffee, ghee, butter and chocolates move to 5%, while cement drops from 28% to 18%. Life-saving drugs fall to nil, as do insurance policies. Consumer durables, vehicles, buses and auto parts mostly shift to 18%, with motorcycles and small cars cut to 12%. SENSEX +0.123% to 80667.15, USDINR +0.073% to 88.1337, 10y INGB -2.4bp to 6.519%.