Market Movers: Brooms
Market Movers highlights key activities and developments before the U.S. market opens each morning.
Market Movers highlights key activities and developments before the U.S. market opens each morning.

Bob Savage
Time to Read: 15 minutes
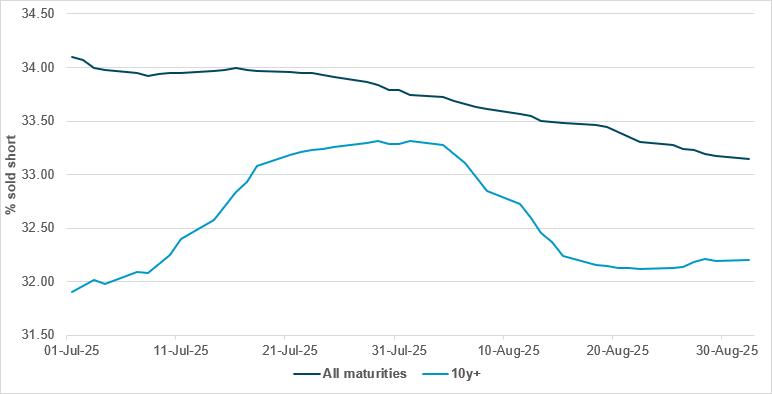
U.S. TREASURY SHORT UTILIZATION STABLE FOR NOW ACROSS TENORS
Source: BNY
The long end of developed market government bond curves remains in focus, as U.K. borrowing costs in the 30y space hit new levels not seen since the first days of Tony Blair’s government. However, it is not all one-way traffic: the Debt Management Office also noted the U.K. raised a record £14bn from a sale of 10y gilts, with higher yields helping to draw more than £141bn of orders, with 40% of the allocation going to international investors. Despite the weak narrative, such market behavior resembles what happened to the U.S. Treasury market in Q2. Despite fears of a large move by global investors away from U.S. Treasury markets, the yields were seen as attractive and further enhanced by a weaker dollar. If anything, we believe that current GBP valuations are inhibiting further bids from international investors, as 40% participation by this group is already above the average level of ownership. Meanwhile, we can see that although U.S. yields are moving higher in sympathy with Europe, there is no material change in short utilization in longer dates, while over the past quarter short utilization for all maturities has fallen. In absolute terms, levels are already adequate to reflect steepening risk; if there is a true risk of contagion in Europe, U.S. Treasurys will fall back to reserve status and likely see further purchases rather than additional liquidation.
The bounce-back in EMEA equities comes despite ongoing trouble at the long end of bonds, with a continued focus on the U.K. budget. The comments from BoE Governor Andrew Bailey and others will matter in this context, and, as the ECB and Fed make clear, monetary policy can clash with fiscal policy. The U.S. Beige Book and JOLTS report on July jobs will be important in supporting easing views, with the U.S. bond markets catching up to the U.K. pain trade amid curve steepening and 30y yields back testing 5%. Hopes that rates will be cut despite sticky inflation are central to understanding the current mood. This conflicts with the supporting factor for risk overnight, which came from better-than-expected PMI reports from APAC and EMEA. For Australia, higher growth is seen as a block to faster RBA easing, and that – coupled with trade noise and Chinese profit-taking – left the region’s equities weaker. Bonds remain in control despite a modest bounce-back for European shares and U.S. futures, with a risk today that good economic news is bad for stocks. Politics remains a drag globally beyond the U.K.; ongoing protests in Indonesia are spreading, with broom-wielding woman marching on Parliament. There is a limit to spending as a solution to politics everywhere, and that political clean-up process is showing up in markets via volatility and correlation shifts. Of course, it matters who controls the clean-up, and the show of power overnight from the Chinese military parade and Xi’s speech leaves the Trump administration begging for a new broom. USD isn’t the flexible economic tool it used to be, with higher rates not helping and alternatives like gold still glittering.
U.S. officials recently informed TSMC of their decision to end the Taiwanese chipmaker’s “validated end user” (VEU) status for its Nanjing site. This move aligns with similar actions against Samsung Electronics and SK Hynix’s China operations, requiring suppliers to obtain individual U.S. export licenses for shipments, including manufacturing gear and chemicals. TSMC’s Nanjing plant, which began operating in 2018 and produces 16-nanometer technology, contributes a small fraction of the company’s revenue. The U.S. Department of Commerce aims to close export control loopholes that disadvantage U.S. firms, though it plans to issue licenses to maintain facility operations. The revocation introduces uncertainty due to a backlog of license requests, underscoring U.S. control over global semiconductor supply chains despite the foreign ownership of these plants. S&P Mini 0.327% to 6446.5, DXY -0.071% to 98.328, 10y UST +2.8bp to 4.289%.
ECB President Christine Lagarde addressed the ninth annual European Systemic Risk Board (ESRB) conference in Frankfurt, emphasizing the challenge of discerning enduring financial risks amid rapid systemic changes driven by geopolitical fragmentation, climate change and digital innovation. She highlighted that while Europe’s non-bank financial sector now exceeds 3.8 times GDP, surpassing the U.S. at 3.1 times GDP, the fundamental financial functions and associated risks – credit, market, liquidity, underwriting and operational – remain constant. Lagarde underscored the importance of a stable global regulatory framework, such as Basel standards and the Financial Stability Board’s initiatives, to manage these risks effectively. Using stablecoins as a case study, she noted persistent liquidity risks and regulatory gaps, particularly in multi-issuance schemes involving EU and non-EU entities, advocating for robust equivalence regimes and international cooperation to prevent regulatory arbitrage and safeguard financial stability. Euro Stoxx 50 +0.562% to 5320.78, EURUSD +0.104% to 1.1652, BBG AGG Euro Government High Grade EUR -2.5bp to 2.86%.
The Eurozone composite PMI rose marginally to 51.0 in August, from 50.9 in July. This represented a 12-month high, though growth remained subdued. Services activity slowed to 50.5 from 51.0, while manufacturing output posted its strongest rise in almost three-and-a-half years. New business expanded for the first time since May 2024, led by factory sales, although export orders contracted at the fastest pace since March. Employment grew for a sixth consecutive month, with the pace of job creation at a 14-month high, supported by services, while backlogs of work shrank only slightly. Input cost inflation accelerated to the fastest rate since March, pushing output prices higher. Among major economies, Spain led growth, Italy also strengthened, Ireland and Germany slowed, and France remained the weakest performer despite edging closer to stabilization.
China RatingDog August China General Services PMI rose from 52.6 to 53.0. The upturn was supported by faster growth in overall new orders and a stronger rise in new export business. The improvement in sales also drove a further accumulation of backlogged work. Additionally, sentiment among service providers regarding the one-year outlook for business activity remained positive. However, despite the solid rise in new orders, companies trimmed their headcounts in August. Turning to prices, average output charges decreased slightly after rising in July. This was amid a softer increase in input costs and reports of intense market competition. CSI 300 -0.682% to 4459.83, USDCNY +0.115% to 7.1465, 10y CGB -1.8bp to 1.754%.
Australia Q2 GDP came in stronger than expected at 0.6% q/q, 1.8% y/y from 0.2% q/q, 1.3% y/y in Q1 2025. Economic growth rebounded in the June quarter following subdued growth in the March quarter, which was heavily impacted by weather events. Domestic final demand was the main driver of growth, led by household and government spending. Public investment was the largest detractor from growth. Net trade also contributed to GDP growth, led by mining commodity exports. Household spending rose 0.9% in the June quarter after a 0.4% rise in the March quarter. Discretionary spending led the rise, increasing by 1.4%, while essential spending increased by 0.5%. Public investment fell 3.9% and was the largest detractor from growth, the largest fall since September 2017 (excluding COVID). Government final consumption expenditure rose 1.0% in the June quarter after recording 0.3% growth in the March quarter. Private investment was little changed, increasing by 0.1% in the June quarter, following a 0.6% rise in the March quarter. Increases for intellectual property products and housing investment were offset by falls for non-dwelling construction. Net trade contributed to growth in the June quarter, adding 0.1 percentage points to GDP. The household saving to income ratio fell to 4.2% in the June quarter, from 5.2% in the March quarter. The 0.6% rise in gross disposable income was outpaced by a 1.5% rise in nominal household spending. ASX +0.218% to 4937.73, AUDUSD +0.092% to 0.6526, 10y ACGB +6.1bp to 4.418%.
National Bank of Poland is expected to cut its base rate by 25bp to 4.75%.
U.S. July JOLTS report: openings forecast to drop to 7.373 million from 7.437 million, with quits steady and layoffs up 70k to 1.675 million.
U.S. July factory orders expected to post a second monthly decline at -1.4% m/m from -4.8% in June.
U.S. July final durable goods orders ex-transportation are projected to be unchanged from the flash report at 1.1%, with a headline rate of -1.3% m/m after -4.8% m/m.
U.S. Federal Reserve to release Beige Book with key focus on prices and jobs.
Central bank speakers: St. Louis Fed President Alberto Musalem speaks at the Peterson Institute on the economy and monetary policy.
U.S. Treasury sells $65bn in 17-week bills.
Mood: iFlow Mood has continued to normalize at a fast pace, led by a sharp reduction in demand for core sovereign bonds while equity inflow momentum was maintained.
FX: Mixed and light flows except for large CLP outflows vs. strong HUF inflows. Elsewhere, USD and CHF were lightly sold, while CZK and INR saw inflows.
FI: U.K. gilts and Canada, Eurozone and Philippines government bonds posted inflows, while Denmark and Singapore government bonds were most sold.
Equities: European, U.K., Canadian and Czech equities were most sold, against good buying in Colombian, Chilean, South Korean and Singapore equities.
“A new broom sweeps clean, but an old broom knows the corners.” – Chinese proverb
“The person who sweeps the floor should choose the broom.” – Howard Behar
Euro area industrial producer prices increased by 0.4% m/m in July, following a 0.8% rise in June, while the EU saw a 0.6% m/m increase after 0.7% in June. Compared with July last year, prices rose by 0.2% in the euro area and 0.4% in the EU. In July, euro area prices fell 0.2% for intermediate goods, rose 1.5% for energy, 0.1% for capital goods and 0.2% for durable consumer goods, and were flat for non-durable consumer goods; total industry excluding energy remained stable. The EU showed similar trends, with a 2.3% increase in energy prices. Romania (+6.7%), Bulgaria (+5.7%) and Slovakia (+2.8%) recorded the highest monthly price rises, while Estonia (-1.0%), Latvia (-0.7%) and Luxembourg (-0.4%) saw the largest declines. Year on year, energy prices fell by 1.2% in the euro area and 1.1% in the EU, while capital goods and consumer goods prices increased, with Bulgaria (+10.7%) and Denmark (+4.5%) posting the highest annual gains. Euro Stoxx 50 +0.562% to 5320.78, EURUSD +0.104% to 1.1652, BBG AGG Euro Government High Grade EUR -2.5bp to 2.86%.
Germany’s August services PMI fell to 49.3 from 50.6 in July, marking a three-month low and returning the sector to contraction. The decline reflected weaker demand, with total new business falling and foreign orders dropping at an accelerated pace. Backlogs of work shrank at the fastest rate in three months, while employment stagnated, ending a YTD run of job creation. Input cost inflation sped up, driven mainly by wages, though it remained below the YTD average, while output price inflation also rose modestly. Business expectations stayed stable near July’s six-month high, with optimism outweighing pessimism. The composite PMI slipped to 50.5 from 50.6, as renewed services weakness offset stronger growth in manufacturing output. DAX +0.364% to 23572.88, EURUSD +0.104% to 1.1652, 10y Bund -1.2bp to 2.774%.
France’s August services PMI rose to 49.8 from 48.5 in July, its highest level in a year, though still below the 50.0 threshold, indicating near-stabilization after sustained contraction since September 2024. Business activity was broadly unchanged, while new orders fell at the slowest pace since January, despite a sharp drop in international demand. Backlogs of work rose for the first time since April 2024, leading employment to grow at the fastest pace in 15 months. Input costs increased to a six-month high, with wages, transport and raw materials cited, while output prices rose modestly to a nine-month high. The composite PMI also improved to 49.8, supported by slower declines in both services and manufacturing, alongside the strongest job creation since June 2023. CAC40 +0.592% to 7699.57, EURUSD +0.104% to 1.1652, 10y OAT -1.2bp to 3.572%.
The U.K.’s August services PMI rose to 54.2 from 51.8 in July, the strongest reading in 16 months and signaling the steepest output expansion since April 2024. New orders rebounded after July’s decline, with growth the sharpest since September 2024, supported by stronger domestic sales and the first rise in export orders since March. Despite robust workloads, backlogs fell for a 27th consecutive month, while employment declined for the eleventh straight month as firms cited high payroll costs, hiring freezes and a shift toward automation. Input cost inflation accelerated to a three-month high, driven by wages, food and technology expenses, while output prices rose at the fastest pace since April. Business confidence strengthened, reaching a ten-month high. FTSE 100 +0.245% to 9139.03, GBPUSD -0.053% to 1.3387, 10y gilt +1.1bp to 4.811%.
Italy’s August services PMI fell to 51.5 from 52.3 in July, marking a seven-month low and signaling only modest growth. Activity slowed despite the strongest inflow of new business in six months, driven mainly by domestic demand as exports contracted for the thirteenth month in a row. Firms added staff for a ninth consecutive month, but at the weakest pace in four months, while outstanding business declined for the sixth straight month. Input costs rose sharply, reflecting higher fuel, energy, rent and other business expenses, though output price inflation eased to a nine-month low. Business confidence weakened further, hitting one of the lowest levels in over four-and-a-half years. The composite PMI rose slightly to 51.7, supported by renewed growth in manufacturing output. FTSEMIB +0.338% to 41868.46, EURUSD +0.104% to 1.1652, 10y BTP -2.3bp to 3.653%.
Spain’s service sector recorded solid expansion in August, with the HCOB Spain Services PMI Business Activity Index declining slightly to 53.2 from 55.1 in July, indicating slower but sustained growth. New business volumes rose markedly for the second consecutive month, supported by improved product offerings and a modest increase in new export orders. Employment growth continued, albeit at a slower pace, amid rising backlogs and capacity pressures, with staffing shortages noted. Inflationary pressures intensified as input costs increased to the highest level since February, driven by supplier charges and staffing costs, prompting firms to raise selling prices at the steepest rate since April 2024. Overall confidence improved to a four-month high, despite some uncertainty. The composite PMI fell to 53.7 from 54.7, reflecting slower service sector growth offset by the fastest manufacturing output increase since last October. OMX +0.613% to 2593.434, EURSEK -0.132% to 10.9968, 10y Swedish GB -0.4bp to 2.627%.
Sweden’s August services PMI rose to 53.4 from 49.0 in July, lifting the summer average (June-August) to 52.3, up 2.6 points compared with spring. Order intake provided the largest contribution to the increase, followed by employment and business volume, though employment remained below the growth threshold for the thirteenth consecutive month. Price pressure strengthened, with the input price index climbing to 56.6 from 53.0, its highest in five months though still below the historical average of 58.0. The composite PMI increased to 53.9 from 50.5 in July, marking an eleventh straight month in expansion territory, albeit at modest levels, reflecting a sluggish recovery in Swedish business activity.
South Africa’s August PMI registered 50.1, slightly down from 50.3 in July but remaining above the 50.0 threshold for the fourth consecutive month, indicating a marginal improvement in business conditions. Output rose for the first time since May, with firms citing stronger domestic demand and new projects, while export orders declined for a fifth straight month due to higher U.S. tariffs. Input costs rose at the weakest pace in ten months, aided by a stronger rand, though fuel and food prices still pushed up expenses. Purchasing activity increased at the fastest rate since October 2024, lifting inventories, but employment declined as firms avoided replacing staff. Business sentiment remained strongly positive despite softer sales growth and lingering concerns over external demand. JSE TOP40 -0.186% to 93523.18, USDZAR -0.091% to 17.6746, 10y SAGB +4.5bp to 9.678%.
Czechia’s average nominal wage in Q2 2025 increased by 7.8% y/y to CZK 49,402, with real wage growth of 5.3% after accounting for 2.4% inflation. The median wage rose by 7.2% y/y to CZK 41,115, with male and female median wages at CZK 44,465 and CZK 37,935, respectively. Seasonally adjusted average wages grew by 2.2% m/m in Q2. Wage increases varied by industry, with the highest in professional, scientific and technical activities (12.7%) and construction (11%), and the lowest in mining and quarrying (4.8%) and other service activities (5.0%). The volume of wages expanded by 8.2%, supported by a 0.4% rise in employment. In H1 2025, the average wage was CZK 48,147, up 7.2% y/y, with consumer prices rising 2.6%, resulting in a 4.5% real wage increase. Prague SE +0.032% to 2259.89, EURCZK -0.021% to 24.469, 10y CZGB +2.5bp to 4.376%.
Türkiye’s Consumer Price Index (CPI) for August registered a 32.95% y/y increase and a 2.04% m/m rise. Compared with December 2024, the CPI rose by 21.50%, while the 12-month moving average increased by 39.62%. Among the main expenditure groups, food and non-alcoholic beverages saw a 33.28% y/y increase, transportation rose by 24.86%, and housing experienced the highest increase at 53.27%. These groups contributed 7.97%, 4.10% and 8.12%, respectively, to the overall annual change in CPI. Monthly CPI growth moderated compared with previous years, with August 2025’s 2.04% m/m increase lower than 2.47% in August 2024 and 9.09% in August 2023. BI 100 -2.25% to 10632.76, USDTRY +0.064% to 41.1685, 10y TGB +29bp to 32.77%.
Türkiye’s Domestic Producer Price Index (D-PPI) increased by 25.16% y/y and 2.48% m/m in August, with a 20.62% rise since December 2024 and a 26.28% increase in the 12-month moving average. Among the main industrial sectors, mining and quarrying rose by 27.62% y/y, manufacturing by 24.73%, electricity, gas, steam and air conditioning by 26.68%, and water supply by 55.35%. Monthly increases were led by electricity, gas, steam and air conditioning at 10.09%, followed by energy at 6.39%, and manufacturing at 1.78%. Key industrial groups posted annual growth of 30.22% in durable consumer goods, 28.94% in non-durable consumer goods, and 26.61% in capital goods. Notable annual increases were observed in metal ores (49.06%) and water supply services (55.35%).
South Korea final Q2 GDP was revised up to 0.7% q/q, 0.6% y/y from a flash estimate of 0.6% q/q, 0.5% y/y vs -0.2% q/q, -0.1% y/y in Q1 2025. On the production side, manufacturing increased by 2.5% q/q, mainly due to increases in computer, electronic and optical products, and transportation equipment. Construction declined by 3.6% q/q as building construction and civil engineering both decreased. Services increased by 0.8% q/q, led by increases for wholesale and retail trade, accommodation and food services, and transportation and storage, despite a decrease for information and communication. On the expenditure side, private consumption was up 0.5% q/q, as expenditures on goods (e.g., motor vehicles) and services (e.g., health services) both increased. Government consumption came in at +1.2% q/q, with increased expenditures on health care benefits. Construction investment fell by 1.2% q/q, led by a decrease in civil engineering. Facilities investment fell by 2.1% q/q, as transportation equipment (e.g., ships) and machinery (e.g., semiconductor manufacturing equipment) both experienced contractions. Exports increased by 4.5% q/q, as exports of semiconductors, petroleum products and chemical products rose. Imports were up 4.2% q/q, mainly due to an increase in energy items (e.g., crude oil and natural gas). KOSPI +0.38% to 3184.42, USDKRW -0.416% to 1389.95, 10y KTB +2.5bp to 2.872%.
South Korea’s FX reserves rose sharply to $416.29bn in August, their highest since September 2024 ($419.97bn). South Korea’s official foreign reserves consisted of securities valued at $366.2bn (88.0%), deposits of $25.0bn (6.0%), SDRs of $15.8bn (3.8%), gold of $4.8bn (1.2%) and the country’s IMF position of $4.5bn (1.1%). The South Korean government also announced that it would provide ₩570bn in financial support to U.S. tariff-hit steel and aluminum firms. This support will include a special low-interest rate loan program for companies in the steel and aluminum sectors and cover expenses for lower interest rates on loans previously extended to SMEs in those sectors, said the Ministry of Trade, Industry and Energy.
Australia final August services PMI rose to 55.8. Australia’s service sector expansion strengthened midway through the third quarter of 2025, with the steepest increase in activity recorded by the survey for over three years driven by another sharp rise in new business, including the best gain in exports since June 2022. Business confidence also improved amid hopes that positive sales growth will continue in the months ahead. Employment increased markedly. On the price front, both input costs and output prices continued to increase in August, although the rates of inflation both fell versus July.
Singapore August PMI eased from 52.7 to 51.2. Business conditions across Singapore continued to improve midway through the third quarter. However, the overall rate of growth eased, as both new orders and output expanded at softer paces. Expectations have also moderated since July, with hiring, purchasing and inventory levels all dropping in tandem. Meanwhile supply constraints were apparent as lead times lengthened while input costs continued to rise. In contrast, output charges came down for the first time in four months as competition intensified. STI -0.271% to 4286.88, USDSGD +0.016% to 1.2885, 10y SGB -1.5bp to 1.857%.
India August final PMI services came in at 62.9 from a flash estimate of 65.6, vs 60.5 in July. India’s service economy benefited from a substantial improvement in demand during August, which pushed growth in new orders and activity to their highest rates in over 15 years. Concurrently, the rise in international sales was the third-strongest since the series started in September 2014. Robust job creation in recent months meant that companies had sufficient capacity to cope with current requirements. Outstanding business increased only marginally, and there was a modest uptick in employment. Amid reports of higher salaries awarded to workers and overtime payments, business expenses rose further. The rate of inflation accelerated to a nine-month high. Meanwhile, demand buoyancy facilitated the steepest increase in output charges since July 2012. SENSEX +0.039% to 80189.08, USDINR -0.078% to 88.0912, 10y INGB -1bp to 6.556%.
Indonesian protests may lead to spending pressures. Recent unrest in Indonesia’s capital, Jakarta, and several other locations across the country has highlighted a high level of public discontent, says Fitch Ratings. The agency said violent protests could have negative repercussions for the sovereign’s credit profile if they dampen medium-term growth prospects, or if the government looks to reduce social tensions by boosting spending significantly, adding to the risk of fiscal slippage around budget targets that it recently highlighted. JCI +0.697% to 7855.94, USDIDR +0.092% to 16415, 10y IDGB +2.4bp to 6.394%.