Market Movers: Better and Worse
Market Movers highlights key activities and developments before the U.S. market opens each morning.
Market Movers highlights key activities and developments before the U.S. market opens each morning.

Bob Savage
Time to Read: 14 minutes
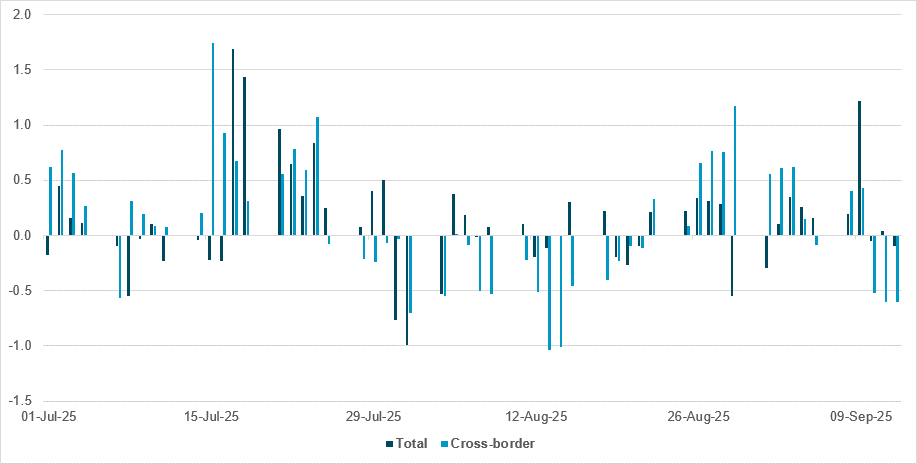
Dovish pricing not translating into significant CAD selling ahead of BoC decision
Source: BNY
The Bank of Canada is expected to continue its easing efforts, as sluggish data and external risks weigh on the economy. Headline CPI due later today is expected to show unchanged prices in August, with headline inflation anchored at 2.0% and core inflation remaining at 3.0% y/y. Nonetheless, performance is not particularly poor upon observation of the flow figures. For onshore investors, forward buying of CAD to hedge overseas asset exposures remains the norm. This is not a surprise as overseas NAVs continue to rise, led by U.S. equity gains, and CAD purchases on a passive basis are the norm during periods of robust risk appetite. Valuations are also attractive enough to continue locking in USD strength. The general alignment in BoC and Fed policy paths due to economic linkages – no matter how disrupted by tariffs at present – means that the policy gap between the two will never be excessive. As such, the impact of repricing of the Fed on rate differentials is often not as strong compared with the gap versus central banks further afield. Overseas investors remain the marginal buyer and seller of CAD, and here the view is more nuanced. The rolling average since July 1 is comfortably positive and close to matching the aggregate figure (0.12 vs. 0.13). However, flow patterns are highly divergent. Mid to end-July was the only period where both segments performed well; otherwise, CAD saw strong selling in August, only for this to be offset by recovery flow toward end-August. Last week, however, significant selling returned, pointing to a more defensive posture heading into the BoC decision. We see similarities versus other currencies’ dollar pairs: as the market moves toward a “sell the fact” phase, there is very little additional dovish pricing possible for the Fed. The asymmetry therefore points to rate differentials moving against CAD, and this means some additional hedging is needed, especially after a relatively good period of purchases.
Equity markets are mixed, bonds are bid, and USD is weaker. The wait for FOMC rate cuts continues, with expectations of new governor Stephen Miran and old governor Lisa Cook both considering rate cuts ahead. The German ZEW investor survey captures the mood of the moment, stating: “financial markets are cautiously optimistic even as the economic situations has worsened.” The trading ahead of tomorrow’s FOMC decision has left the dollar lower, but whether this breakout in EUR or JPY will hold beyond Jerome Powell’s press conference, the summary of economic projections and the statement shift remains to be seen. The forward guidance given by all central bankers in the days ahead will set the tone for whether easing rates will suffice to fix the economy and further bolster expectations of better times to come. The overnight focus on the BoJ’s unchanged stance, the LDP race and hopes that a China/U.S. trade deal will be confirmed after Xi and Trump speak on Friday left a bar-belled approach for investors, who bought gold and tech shares. The Nasdaq is on target for a tenth successive day of gains, while the S&P 500 dances onto another record high. Whether the U.S. data on the economy proves material to taming some of these high spirits will be key, as retail sales and industrial production are important elements in understanding the health of the economy. The risk of profit-taking ahead seems high given the “better and worse” debate, where the markets are contrasted against the economy. The ability for bonds and stocks to remain correlated will leave the USD weakness confused unless further hedging pressures make it obvious that FX reflects the global smile of divergent growth and inflation ahead.
A U.S. appeals court blocked President Trump’s attempt to remove Federal Reserve Governor Lisa Cook, allowing her to remain in post while her lawsuit proceeds. The 2-1 ruling came hours before the Fed’s September 16-17 policy meeting kicked off, where officials are expected to cut rates. The court found Trump likely violated Cook’s due process rights by attempting to oust her without notice or opportunity to respond. Cook, who denies allegations of mortgage fraud, sued last month after Trump announced her dismissal via social media. The case has become a flashpoint in tensions between the White House and the Fed, which has resisted Trump’s pressure for deeper rate cuts. Cook’s lawyer warned that her removal would destabilize the Fed’s decision-making, while the Justice Department and the Fed declined to comment. Meanwhile, Trump’s nominee Stephen Miran was confirmed by the Senate to the Fed board, filling the seat vacated by Adriana Kugler. Senator Murkowski (R-Alaska) joined Democrats in voting against the confirmation. S&P Mini 0.086% to 6685, DXY -0.201% to 97.107, 10y UST -1.4bp to 4.024%.
Japan’s Agriculture Minister Shinjiro Koizumi declared his candidacy for leadership of the ruling Liberal Democratic Party, positioning himself as a frontrunner alongside right-winger Sanae Takaichi. Top government spokesman Yoshimasa Hayashi and former foreign minister Toshimitsu Motegi also entered the race, while serving finance minister Katsunobu Kato withdrew to serve as Koizumi’s campaign chief. Polls show Takaichi leading with 28% of the support, Koizumi at 23% and Hayashi at 11%. The leadership contest follows two electoral defeats that weakened the LDP’s majority, forcing a debate over whether to appeal to right-wing voters or rebrand with a younger leadership. Koizumi, 44, son of former Prime Minister Junichiro Koizumi, is seen as a reformist who has pushed for agricultural modernization but is considered inexperienced. Campaigning begins on September 22, with voting set for October 4. Nikkei +0.3% to 44902.27, USDJPY -0.469% to 146.71, 10y JGB +1bp to 1.604%.
In a speech delivered overnight, RBA Deputy Governor Andrew Hauser explored how global fragmentation could alter Australian investors’ approach to currency risk. He highlighted the Australian dollar’s historical role as a “risk-on” currency that naturally hedges offshore equity exposure due to its negative correlation with global downturns and the U.S. dollar’s safe-haven role. While recent volatility, including April’s tariff shock, prompted speculation about the decline of U.S. dollar dominance, Hauser noted that correlations and hedging costs for Australian funds remain stable, with limited evidence of large shifts in global capital flows. Structural trends, however, will expand superannuation funds’ FX hedge books as assets grow toward 180% of GDP, with more invested offshore and higher fixed-income allocations. This will increase liquidity and settlement risks, making diversification of hedge providers and robust collateral management vital. ASX -0.038% to 5014.19, AUDUSD +0.03% to 0.6671, 10y ACGB -5.5bp to 4.219%.
Taiwanese insurance companies are considering easing accounting rules to curb rising foreign exchange hedging costs, which have outpaced industry profits. The Taiwan Life Insurance Association has asked members to form a taskforce with accounting firms to design mechanisms to reduce the impact of Taiwan dollar appreciation, with proposals due by end-September and new rules to be reviewed by the Financial Supervisory Commission for implementation in January. Insurers face mounting costs given that 90% of their TWD 21tn overseas assets are in U.S. dollars, with the stronger Taiwanese dollar and wider U.S.-Taiwan interest rate gap driving hedging expenses to TWD 385.1bn in 2024, exceeding pre-tax profits of TWD 315.5bn. Recent regulatory relief allowed use of mandatory reserves, lifting foreign exchange reserves to TWD 234bn in July from TWD 19bn in May. TAIEX 1.075% to 25629.64, USDTWD -0.411% to 30.089, 10y TGB -0.1bp to 1.36%.
U.S. August advance retail sales forecast at 0.3% m/m and 0.4% y/y vs. 0.5% m/m and 0.3% m/m in July, with control group sales expected up 0.4% m/m after 0.5% m/m.
U.S. August import price index expected to come in at -0.2% m/m from +0.4% m/m in July, while export prices are seen falling -0.1% m/m from +0.1% m/m in July.
U.S. August industrial production is forecast at -0.1% m/m vs. -0.1% in July, while manufacturing production is expected to drop -0.3% m/m, after a flat 0% m/m in July. Capacity utilization is projected to ease from 77.5% to 77.4%.
U.S. July business inventories forecast to hold steady at 0.2% m/m vs. 0.2% m/m in June.
U.S. September NAHB housing market index is seen rising to 33 from 32.
Canada August headline CPI expected at 0.1% m/m, 2.0% y/y vs. 0.3% m/m, 1.7% y/y; median and trimmed core CPI are expected to be unchanged at 3.1% y/y and 3.0% y/y, respectively.
U.S. Treasury sells $85bn in 6-week bills and $13bn in a 20y bond reopening.
Mood: iFlow Mood normalization picked up pace, with easing core sovereign bond demand against increasing buying of equities.
FX: HUF posted the most inflows, against most outflows in TRY and MYR within the iFlow universe. Within the G10, flows were mixed, with light USD and EUR selling against GBP, JPY, NOK and DKK buying. Tech-related TWD and KRW continue to be well-received.
FI: Cross-border investors aggressively net sold U.S. Treasurys and net bought Eurozone government bonds. Elsewhere, U.K. gilts and Colombian and Chinese government bonds posted good buying, against outflow pressure in Polish and Indonesian government bonds.
Equities: The shift in asset allocation out of developed markets into emerging markets continued. Switzerland and U.S. equities were most sold, while Brazil, South Africa, South Korea and Taiwan saw good buying. Within EM, the materials sector posted the most buying followed by utilities, information technology, financials and health care, while consumer discretionary and communication services were the two sectors that were sold.
“The meaning of good and bad, of better and worse, is simply helping or hurting.” – Ralph Waldo Emerson
“For better or worse, our futures will be determined in large part by our dreams and by the struggle to make them real.” – Mihaly Csikszentmihalyi
German September ZEW investor expectations rose to 37.3 points from 34.7, better than the 25.0 expected. The current conditions index fell to -76.4 from -68.6 – worse than the -73.6 expected. The recovery in expectations follows the EU-U.S. trade deal. Average long-term expectations are 21.5, leaving recovery hopes intact even as current conditions continued to worsen. “Financial market experts are cautiously optimistic and the ZEW indicator has stabilized, but the economic situation has worsened. There are still considerable risks, as uncertainty about the U.S. tariff policy and Germany’s ‘autumn of reforms’ continues,” commented ZEW President Professor Achim Wambach. DAX -0.157% to 23711.65, EURUSD +0.307% to 1.1797, 10y Bund -1bp to 2.681%.
Eurozone July industrial production recovered to +0.3% m/m from -0.6% m/m, still less than the 0.4% m/m expected. Y/y growth was 1.8%, from 0.7%. Gains were led by non-durable consumer goods (+1.5% m/m) and capital goods (+1.3% m/m), while energy fell 2.9% m/m and intermediate goods were up just 0.5% m/m. The cost of labor for 2Q was 3.6% y/y, up from 3.4% y/y and revised down from a preliminary figure of 3.7% y/y. Most of this increase came from wages, which were up 3.75% y/y vs. 3.5% in Q1.
The U.K.’s unemployment rate for people aged 16+ was 4.7% in May-July 2025, up both q/q and y/y. Regular earnings rose by 4.8% y/y and total pay by 4.7%, translating into real growth of 0.7% and 0.5%, respectively. The employment rate for those aged 16-64 stood at 75.2%, also higher than a year earlier, while the economic inactivity rate fell to 21.1%. Payrolled employees declined by 142,000 (0.5%) between July 2024 and July 2025, by 6,000 between June and July, and provisionally by 127,000 (0.4%) y/y in August to 30.3 million. Vacancies fell by 10,000 q/q to 728,000, the 38th consecutive fall. Workforce jobs numbered 36.8 million in June, down 182,000 q/q but up 139,000 y/y, with public sector employment rising 75,000 y/y to 6.17 million. Strikes led to the loss of 83,000 working days in July, mostly in health and social work. FTSE 100 -0.062% to 9271.24, GBPUSD +0.302% to 1.364, 10y gilt +0.1bp to 4.634%.
In Statistics Norway’s latest forecasts, the Norwegian economy is projected to grow modestly, with GDP rising 0.2% in 2025 before strengthening to 1.1% in 2026 and 1.0% in 2027, then contracting by 0.3% in 2028. Mainland GDP is expected to expand by 1.9% in 2025, 1.8% in 2026, 2.3% in 2027 and 1.7% in 2028. Employment growth is set to slow from 0.7% in 2025 to 0.5% in 2027-2028, with unemployment gradually easing from 4.5% in 2025 to 4.1% in 2027-2028. Wage growth is projected to moderate from 4.9% in 2025 to 3.5% in 2028. CPI inflation is forecast to fall from 3.0% in 2025 to 2.4% in 2028, with underlying CPI-ATE declining from 3.1% to 2.5% over the same period. Housing price growth is projected to come in at 4.5% in 2025, slowing to 3.6% in 2026, before rebounding to 4.7% in 2027 and easing to 4.0% in 2028. The money market rate is set to drop from 4.4% in 2025 to 3.8% from 2026 onward, while the import-weighted NOK exchange rate is forecast to weaken by 0.7% in 2025 and 1.0% in 2026, then stabilize. OSE -0.228% to 1660.39, EURNOK +0.164% to 11.5756, 10y NGB 0bp to 3.994%.
Italy’s August 2025 consumer price index rose 0.1% m/m and 1.6% y/y, easing from 1.7% in July and confirming preliminary estimates. The slowdown reflected weaker energy prices, with a rise of 12.9% for regulated energy (from 17.1%) and a fall of 6.3% for non-regulated energy (from -5.2%). Communication services (+0.2%) and processed food (+2.7%) also slowed, while unprocessed food (+5.6%), recreational and personal services (+3.0%) and transport services (+3.5%) accelerated. Core inflation edged up to 2.1% y/y, or 2.3% excluding energy. Goods price growth eased to 0.6%, while services rose 2.7%, widening the gap to 2.1 percentage points. The “shopping basket” index accelerated to 3.4%. The harmonized HICP fell 0.2% m/m due to summer sales and increased 1.6% y/y, down from 1.7%, while the FOI index rose 1.4% y/y with no m/m change. Acquired inflation stood at 1.7% for the headline index and 2.1% for the core rate. FTSEMIB -0.163% to 42983.55, EURUSD +0.307% to 1.1797, 10y BTP -1.3bp to 3.462%.
Spain’s Q2 2025 labor cost survey showed average labor costs rose 3.0% y/y to €3,256.54 per worker per month, while wage costs increased 2.7% to €2,416.50. Adjusted for calendar and seasonal effects, labor costs grew 3.3% y/y and 0.7% q/q. The number of job vacancies reached 149,739 in the quarter. IBEX 35 -0.379% to 15333, EURUSD +0.307% to 1.1797, 10y Bono -1.1bp to 3.234%.
Hungary’s full-time employees earned average gross pay of HUF 693,700 and net pay of HUF 479,500 in July 2025, up 9.0% and 9.4% y/y, respectively. Real earnings rose 4.9% as consumer prices grew 4.3%. The stronger net earnings growth reflected the higher family tax benefit introduced on July 1. Regular gross earnings excluding bonuses reached HUF 656,600, an 8.5% annual rise, with gains of 8.1% in the business sector, 10.1% in the budgetary sector and 7.9% in non-profits. Median gross earnings were HUF 570,000 (+9.6% y/y), and median net earnings were HUF 399,000 (+10.7%). Over January-July 2025, average gross and net earnings were HUF 693,000 and HUF 476,600, respectively, both up 9.1% from a year earlier. Budapest SI +0.082% to 100723, EURHUF -0.008% to 389.5, 10y HGB -3bp to 6.99%.
In August 2025, Czech agricultural producer prices fell 1.2% m/m but rose 11.4% y/y, with steep annual increases for eggs (+44.9%), cattle (+40.1%) and milk (+19.9%). Industrial producer prices were flat m/m and down 0.8% y/y, driven by declines in coke and petroleum products, chemicals (-6.6%) and coal (-10.9%), though food prices rose 3.4%, led by dairy (+10.0%). Construction work prices grew 0.3% m/m and 2.6% y/y, while materials used in construction were up 1.1% y/y. Service producer prices in the business sphere rose 0.8% m/m and 4.4% y/y, with strong gains in programming and broadcasting (+21.5%) and advertising (+18.3%). Across the EU, industrial producer prices rose 0.6% m/m and 0.4% y/y in July, with Bulgaria (+10.7%) and Denmark (+4.5%) leading gains, while Czechia recorded a 1.2% decline. Prague SE -0.135% to 2289.88, EURCZK -0.025% to 24.309, 10y CZGB -0.4bp to 4.364%.
Türkiye’s 2024 company accounts showed 1.1 million enterprises, led by wholesale and retail trade, repair of motor vehicles and motorcycles with 356,062 firms, while manufacturing accounted for 16.4% of all companies. Total assets stood at TRY 95.8tn, liabilities at TRY 47.2tn and equity at TRY 48.6tn. Manufacturing held the largest asset base at TRY 25.7tn and equity of TRY 13.3tn. Net profit across sectors was TRY 1.95tn, with manufacturing contributing the most at TRY 559bn, followed by wholesale and retail trade (TRY 300bn) and professional, scientific and technical activities (TRY 286bn). Education posted the largest loss at TRY 3.1bn. Aggregate net sales reached TRY 78.2tn, while operating profit was TRY 3.7tn, indicating rising sales but lower profitability compared with prior years. BI 100 +0.25% to 11027.77, USDTRY -0.032% to 41.3117, 10y TGB -7bp to 32.11%.
Türkiye’s paid employees totaled 16.1 million in July 2025, up 1.2% y/y from 15.9 million. Employment in industry fell 3.5% to 4.9 million, with manufacturing down 3.8%, while construction rose 7.7% to 2.0 million and trade services grew 2.5% to 9.2 million. Within services, transportation and storage (+5.7%), accommodation and food (+4.7%), financial services (+4.5%) and real estate (+5.1%) all posted strong gains, while administrative and support services declined 1.0%. On a monthly basis, total paid employees rose 0.3%, as construction increased 0.9% and trade services 0.3%, offsetting a 0.1% fall in industry.
Japan July tertiary industry index rose 0.5% m/m from a downwardly revised -0.2% m/m in June, reaching 105.0, and was up 1.6% y/y on an original index basis at 106.1. Broad-ranging personal services fell 0.6% m/m (+0.7% y/y), while broad-ranging business services increased 0.4% m/m (+2.4% y/y). Key contributors to growth were transport and postal activities (+3.4%), finance and insurance (+1.5%), business-related services including goods leasing (+1.0%), real estate (+1.2%) and electricity, gas, heat supply and water (+0.5%). Declines were seen in retail trade (-1.9%), living and amusement-related services (-0.9%), wholesale trade (-0.1%) and medical, health care and welfare (-0.1%). Information and communications was flat but showed a strong 4.5% y/y increase. Nikkei +0.3% to 44902.27, USDJPY -0.469% to 146.71, 10y JGB +1bp to 1.604%.
Australia’s economic outlook is currently balanced, with risks on both the upside and downside, according to RBA Assistant Governor Sarah Hunter. Speaking at a financial industry conference, she noted that consumer spending is showing signs of improvement and core inflation is broadly in line with forecasts, though disinflation has slowed. Underlying inflation was 2.7% in Q2, down from the 6.8% peak in late 2022 and moving closer to the RBA’s 2-3% target range. GDP grew at its fastest annual pace in nearly two years in Q2, driven by stronger household spending, while monthly inflation rose unexpectedly in July. The RBA has cut rates three times this year to 3.60%, with markets pricing in a further 50bp of easing to 3.10%, most likely in November. ASX -0.038% to 5014.19, AUDUSD +0.03% to 0.6671, 10y ACGB -5.5bp to 4.219%.
New Zealand August food prices rose 0.3% m/m or 5.0% y/y. Higher prices for the grocery food group, up 4.7% y/y, made the biggest contribution to the annual increase in food prices, followed by 8.1% y/y in the meat, poultry and fish group. Elsewhere, fruit and vegetables were up 8.9%, restaurant meals and ready-to-eat food were up 2.4% and non-alcoholic beverages were up 3.9%. Rent prices rose 2.1% y/y, vs. 2.4% in July.
New Zealand home prices dipped in August. The Real Estate Institute of New Zealand (REINZ) said prospective buyers remained cautious despite aggressive interest rate cuts from the central bank to spur the economy. Seasonally adjusted median house prices dipped -1.3% m/m and were 0.5% lower y/y. Seasonally adjusted national home sales fell -4.5% m/m but were up 0.6% y/y. In other data, non-resident bond holdings fell to 61.5% in August from 62.8% previously. NZX 50 +0.201% to 13234.89, NZDUSD +0.151% to 0.598, 10y NZGB -4.4bp to 4.273%.
South Korea’s August 2025 Export Price Index rose 0.7% m/m but fell 1.0% y/y, while the Import Price Index increased 0.3% m/m and declined 2.2% y/y. Exports volumes grew 5.4% y/y, while their value was up 2.0%, whereas imports rose 2.2% by volume but dropped 3.8% by value. The Net Barter Terms of Trade Index improved 2.9% y/y, and income terms of trade rose 8.5%. By sector, export price gains were led by agricultural, forestry and marine products (+9.8% y/y), while manufacturing products fell 1.1% y/y. On the import side, raw materials prices declined 6.6% y/y, offset by increases in capital and consumer goods (+2.6% each). Mining products remained weak, with a 7.6% y/y drop. Bank of Korea data also indicated July adjusted M2 money supply increased by 0.8% m/m. KOSPI +1.242% to 3449.62, USDKRW -0.502% to 1379.35, 10y KTB +0.5bp to 2.82%.