Market Movers: Waiting for an Ending
Market Movers highlights key activities and developments before the U.S. market opens each morning.
Market Movers highlights key activities and developments before the U.S. market opens each morning.

Bob Savage
Time to Read: 20 minutes
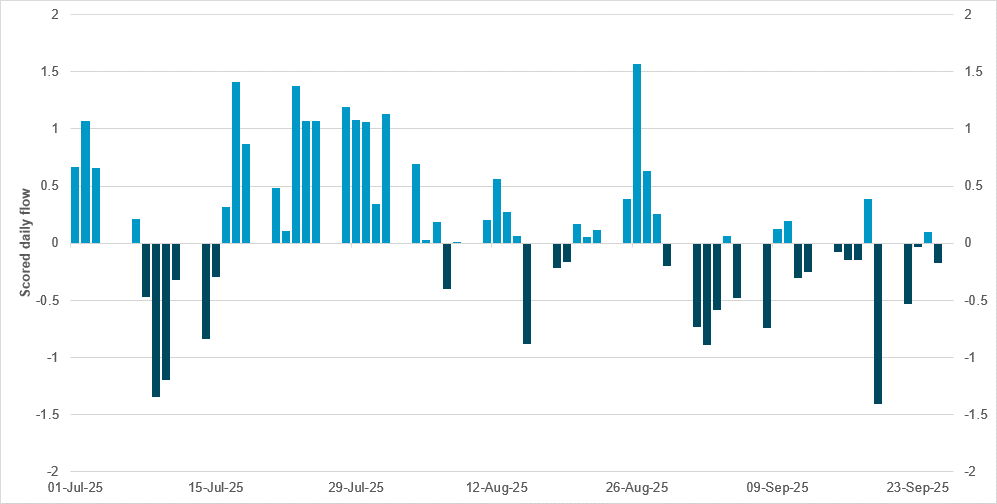
Flows into U.S. consumer finance equities reverse after strong summer
Source: BNY
Auto lender failures of late have called into question the health of U.S. households. Despite growing household wealth and generally robust retail sales figures, markets are becoming more attentive to signs of strain. This has also spilled over into scrutiny over credit markets, where valuations have recently reached uncomfortably high levels in the context of the Fed’s September rate cut. We stress that household leverage and the strength of U.S. banks are in very different places than they were before the global financial crisis, and a repeat is not the base case. However, after several years of very weak flows into credit, the recent surge is notable, making it important to identify the relevant exposures. For example, we can see that on an aggregate basis, flows into U.S. corporate credit have been comfortably positive since the beginning of the month, and there were also few indications of month-end/quarter-end rebalancing. Another sign of stress in U.S. consumer credit can be seen in the performance of specialized consumer finance companies in the U.S. Our latest flow data point to a material shift in flow interest since September, around the time that adverse headlines came to the fore. Even on a short-term basis, we see enough potential for mean reversion as a three-month flow average of 0.12 is material, though there is no sign of panic selling and Fed easing will provide some breathing space for associated firms.
Quarter-end rebalancing and a heavy slate of economic data releases have left markets taking profits and catching their collective breath. Investors are selling equities, selling the dollar, rethinking bond duration and taking profits in gold and other commodities. The looming U.S. government shutdown is casting a shadow over how to interpret policy risks from both a monetary and a fiscal perspective. The economic effect will be dependent on the length of the disruption, with only about 25% of federal outlays affected. The key releases of job openings from the JOLTS report plus the job market element of the Conference Board consumer confidence survey are the best sources of information on the state of the labor markets for now. The significant economic releases overnight paint a picture of mixed growth, sticky inflation and less confidence – and the question of whether that continues will be key to how the U.S. session ahead progresses. Further Fedspeakers and the reactions to these will also be influential. Overnight, central bankers were not concerned about financial stability. The RBA left its policy rate on hold, noting a slowing in the pace of inflation declines, while the BoJ’s summary of opinions made it clear a rate hike should be expected and included plans to cut super-long debt buying in Q4. This left the 2y Japan JGB sale with the weakest bid/cover since 2009 and the highest yield since 2008. China’s NBS PMI beat the consensus, with manufacturing at a six-month high, although still in contraction. The start of Golden Week in China has brought higher consumer holiday spending expectations and more government promises to stoke demand. In Europe, German retail sales fell, jobs were flat, inflation was higher and markets are waiting for the quarter to end before restarting any trend or carry chasing. The close of Q3 leaves investors waiting for the ending before they embark on any new course or new idea for risk. The rebalancing pressure comes to an end today, with expectations of modest USD selling, more EM profit-taking and further volatility around bonds. The fear factors of bubbles in gold, tech and short USD will battle against the resilience of the global economy and better growth.
The RBA has kept rates unchanged at 3.6% in a unanimous vote and remains upbeat on growth and inflation. Overall, the press statement was slightly hawkish, with a twist in both the inflation and growth assessments. The RBA noted that “the decline in underlying inflation has slowed,” in a shift from “moderating inflation or continue to moderate” since February 2025. RBA commented that inflation in the September quarter may be higher than previously expected. On growth, the RBA highlighted that “domestic economic activity is recovering” along with the usual “the outlook remains uncertain.” It noted that “stronger-than-expected data on growth and inflation may indicate that households have become more comfortable consuming as real incomes and wealth rise. If this continues, it may make it easier for businesses to pass on cost increases and lead to more demand for labor.” Governor Michele Bullock noted that policy is still “a bit restrictive.” ASX -0.144% to 5026.37, AUDUSD +0.396% to 0.6603, 10y ACGB -3.5bp to 4.298%.
S&P Global Ratings reaffirmed Australia’s sovereign credit ratings of AAA (long-term) and A-1+ (short-term) with a stable outlook on September 30, reflecting expectations that fiscal deficits and net debt will remain modest over the next two years. The agency projects a general government deficit of 1.5-2.0% of GDP and net debt stabilizing at close to 27% of GDP by fiscal 2028. Real GDP growth slowed to 1.3% in fiscal 2025 but is expected to recover to 2.0-2.3% over the next three years, supported by RBA rate cuts to 3.6% and inflation that is within target. Unemployment stood at 4.3% in August, while household debt and external liabilities remain key vulnerabilities.
U.K. GDP grew 0.3% q/q in Q2 2025, unrevised versus the first estimate and down from 0.7% in Q1. Annual GDP for 2024 remained unchanged at 1.1%, though the quarterly path was adjusted, with Q1 revised down and Q2-Q4 revised up. Compared with Q4 2023, GDP in Q2 2025 was 2.9% higher, revised up from 2.6%. In output terms, Q2 growth was driven by a 0.4% rise in services and a 1.0% rise in construction, while production fell 0.8%. Real household disposable income per head rose 0.2% after a 0.9% fall in Q1, while the household saving ratio edged up to 10.7%. These figures are aligned with the forthcoming Blue Book 2025. FTSE 100 -0.147% to 9286.17, GBPUSD +0.112% to 1.3444, 10y gilt -0.9bp to 4.691%.
China’s official September manufacturing PMI was 49.8, up 0.4 points from August, showing continued improvement though still below the 50-point threshold. The figure for large enterprises was 51.0, with medium enterprises at 48.8 and small enterprises at 48.2. Among sub-indices, production rose to 51.9, new orders improved to 49.7, raw material inventories reached 48.5, employment stood at 48.5 and suppliers’ delivery time picked up to 50.8. In non-manufacturing, the business activity index was 50.1, with construction at 49.3 and services at 50.1. New orders fell to 46.0, while input prices and sales prices dropped to 49.0 and 47.3, respectively. Employment eased to 45.0. The composite PMI output index was 50.6, up 0.1 points, indicating overall expansion. CSI 300 +0.447% to 4640.69, USDCNY 0% to 7.1224, 10y CGB -2.6bp to 1.871%.
Germany September national CPI expected to rise to 2.3% y/y, 0.2% m/m from 2.2% y/y, 0.1% m/m previously.
U.S. July FHFA house price index expected at -0.1%, the fourth straight monthly decline.
U.S. July S&P Cotality Case-Shiller 20-city price index forecast at 0.20% m/m, 1.91% y/y vs. -0.25% m/m, 2.14% y/y in June.
U.S. September Chicago PMI is expected rise to 43.3 from 41.5.
U.S. August JOLTS openings forecast at 7.170 million vs. 7.181 million in July.
U.S. September Conference Board consumer confidence expected to ease to 96 from 97.4 in August.
Central bank speakers: Boston Fed’s Susan Collins speaks at the Council on Foreign Relations. Chicago Fed’s Austan Goolsbee participates in a Q&A at the Midwest Agriculture Conference.
U.S. Treasury sells $85bn in 6-week bills and $50bn in 52-week bills.
Mood: iFlow Mood slipped back into negative territory with marginally net equity selling, against light buying of core sovereign government bonds.
FX: USD, DKK and NZD were bought, against outflows in the rest of the G10 complex. Elsewhere, LatAm currencies were sold, against mixed flows in EMEA and APAC. CZK, HUF and ZAR posted the most inflows, while COP recorded the most outflows.
FI: U.S. Treasurys, U.K. gilts and Eurozone government bonds were bought, against selling in New Zealand and South Korean government bonds. Flows in the rest of the iFlow universe were relatively muted.
Equities: DM APAC and EM Americas posted light inflow, while aggressive outflows were seen in EM APAC and DM Americas. Canada, Switzerland, Norway, Czechia, Poland and Taiwan posted significant outflows. Within DM, the communication services and consumer staples sectors were sold, while the industrials and information technology sectors were most bought.
“People who wait for the right moment end up waiting forever.” – Chloe Bridges, The Carrie Diaries
“It is always important to know when something has reached its end. Closing circles, shutting doors, finishing chapters… what matters is to leave in the past those moments in life that are over.” – Paul Coelho
Germany’s August retail sales fell 0.2% m/m in real terms and rose 0.1% nominally, according to Destatis. Compared with August 2024, sales increased 1.8% in real terms and 3.2% in nominal terms. Food retail sales rose 0.6% (real) and 1.1% (nominal) m/m but declined 0.6% y/y in real terms. Non-food retail fell 1.0% (real) and 1.3% (nominal) m/m, though y/y growth rates were 3.2% and 3.8%, respectively. Online and mail order sales dropped 2.0% in real terms and 2.2% in nominal terms m/m but advanced by 7.4% and 7.8% y/y, respectively. Revised July figures showed real sales down 0.5% m/m and up 2.9% y/y, easing from earlier estimates. DAX +0.024% to 23745.06, EURUSD +0.162% to 1.1746, 10y Bund -1.1bp to 2.696%.
Germany’s August import prices fell 1.5% y/y and 0.5% m/m, mainly due to a 15.6% annual decline in energy costs, with crude oil down 20.5%, coal down 20.9%, and natural gas down 13.2%, reported Destatis. Excluding energy, import prices were unchanged y/y and m/m. Intermediate goods were 1.0% cheaper y/y, while investment goods fell 0.5%. Consumer goods rose 1.5% y/y, led by a 9.1% rise for food, including strong gains in coffee (+39.8%) and beef (+30.8%). Agricultural imports climbed 5.2% y/y. Export prices increased 0.5% y/y but edged down 0.1% m/m, with consumer goods up 1.8% and investment goods up 0.4% y/y. Energy export prices fell 4.7% y/y, driven by mineral oil products, which were down 8.9%.
Germany’s August employment was broadly unchanged at 45.8 million, with seasonally adjusted figures showing a slight decrease of 8,000 (0.0%) from July, following a 4,000 increase the previous month, reported Destatis. Non-seasonally adjusted employment fell by 33,000 (-0.1%) from July, in line with the August averages in 2023 and 2024. Compared with August 2024, employment was flat (+3,000 or 0.0%), marking the fourth consecutive month at the same level y/y. Unemployment stood at 1.79 million, up 146,000 or 8.9% y/y, raising the jobless rate to 4.0% from 3.7%. Seasonally adjusted unemployment was 1.66 million, up 3,000 m/m, keeping the adjusted rate steady at 3.7%.
France’s September consumer prices rose 1.2% y/y after 0.9% in August, according to provisional INSEE data. The acceleration reflected higher service prices, driven by slower declines in communication costs and rising healthcare costs, while energy prices fell less sharply due to base effects from 2024. Food and tobacco prices edged higher, while manufactured goods prices declined slightly faster. On a m/m basis, CPI fell 1.0% after a 0.4% rise in August, mainly due to seasonal drops in transport and accommodation. Energy and tobacco were stable, while manufactured goods edged higher. Harmonized CPI rose 1.1% y/y and fell 1.1% m/m in September. CAC40 -0.211% to 7864.25, EURUSD +0.162% to 1.1746, 10y OAT -1.3bp to 3.52%.
France’s Industrial Product Price Index (IPPI) rose by 1.3% in August 2025, following a 0.9% increase in July. This growth was mainly driven by refined petroleum products (+7.5%) and primary non-ferrous metal products (+3.3%), especially copper and aluminum. The IPPI increased by 2.4% y/y, marking its strongest annual rise since March 2023. The Raw Materials Price Index (RMPI) also rose by 3.8% in August, led by crude oil prices (+6.5%). Compared with August 2024, the RMPI surged by 11.2%, its highest annual growth since June 2022. These increases are linked to global supply tensions and currency fluctuations.
France’s household consumption of goods rose 0.1% m/m in August 2025 after a revised 0.6% decline in July, reported INSEE. Manufactured goods consumption rebounded 0.3%, led by a 1.8% increase in clothing and textiles, while durable goods were nearly flat as a 2.3% drop in housing equipment offset a 1.2% rise in transport equipment. Energy consumption was broadly stable at -0.1% after -1.7% in July, and food spending was unchanged, with agricultural products falling again and agri-food products edging higher. Tobacco consumption declined for the fourth consecutive month. On a y/y basis, household goods consumption fell 0.8%.
According to preliminary estimates, Italy’s consumer price index (NIC) fell by 0.2% m/m in September 2025 but rose 1.6% y/y, unchanged from August. The stabilization masked divergent patterns: unprocessed food price growth eased (5.6% to 4.8%), while processed food, regulated energy and non-regulated energy accelerated. Core inflation remained stable at 2.1%, as did inflation excluding energy, though it was slightly down from August. Goods prices grew 0.7% annually, while services rose 2.6%, narrowing the inflation gap to 1.9 percentage points. Grocery and unprocessed food prices were flat m/m but fell 3.2% y/y, reversing August’s rise. Transport services fell 3.3% m/m, partly offset by higher unprocessed food prices. The harmonized index (HICP) rose 1.3% m/m and 1.8% y/y, boosted by end-of-summer sales. FTSEMIB +0.009% to 42558.23, EURUSD +0.162% to 1.1746, 10y BTP -1.3bp to 3.52%.
Italy’s industrial producer prices fell 0.6% m/m in August 2025, while growth slowed to 0.2% y/y from 1.6% in July. Domestic prices declined 0.7% m/m but rose 0.5% y/y, with energy driving the slowdown; excluding energy, prices increased 0.3% m/m and 0.9% y/y. Foreign market prices slipped 0.1% m/m and rose 0.3% y/y. Over June-August, industrial producer prices rose 0.4% q/q. Food, beverages and pharmaceuticals posted the strongest y/y gains, while coke and refined petroleum products recorded sharp declines. Construction prices rose 0.3% m/m and 1.3% y/y for buildings, while road and railway prices fell 0.2% m/m but edged up 0.1% y/y.
U.K. shop price inflation rose to 1.4% y/y in September, up from 0.9% in August and above the three-month average of 1.0%, according to the British Retail Consortium. Non-food inflation increased 0.3% m/m, with DIY and gardening products driving price growth, though non-food prices remained 0.1% lower y/y. Food inflation held steady at 4.2% y/y, with fresh food at 4.1% and ambient food at 4.2%, both unchanged from August but above their three-month averages. The BRC highlighted continued pressure from higher labor and energy costs, particularly in dairy and beef, and warned that new packaging taxes and potential budget-related tax rises could keep inflation elevated. FTSE 100 -0.147% to 9286.17, GBPUSD +0.112% to 1.3444, 10y gilt -0.9bp to 4.691%.
The U.K.’s underlying current account deficit, excluding precious metals, widened to £23.8bn or 3.2% of GDP in Q2 2025, up £7.3bn from Q1’s revised £16.5bn. Including precious metals, the deficit rose £7.7bn to £28.9bn, or 3.8% of GDP. The total trade deficit, excluding precious metals, widened to £2.8bn (0.4% of GDP), with the goods deficit at £56.6bn and the services surplus at £53.8bn. The primary income deficit widened to £16.8bn, or 2.2% of GDP. Net financial inflows reached £33.0bn, while the net international investment liability position increased to £341.8bn at end-June from £324.4bn in March.
U.K. real household disposable income per head rose 0.2% q/q in Q2 2025 after a 0.9% fall in Q1, while the household saving ratio increased to 10.7% from 10.5%, driven by higher non-pension saving. The U.K.’s borrowing position with the rest of the world widened to 4.1% of GDP from 2.9%. Non-financial corporations’ net borrowing rose to 1.5% of GDP, with private non-financial corporations increasing borrowing to £11.7bn from £4.4bn. Financial corporations cut net borrowing to £1.1bn from £4.0bn. General government borrowing grew to 5.9% of GDP, with central government’s net borrowing rising to £40.1bn from £36.3bn.
The latest U.K. Lloyds Business Barometer saw a fall of 12 points in September, with confidence remaining above the long-term average of 29%, close to the average seen across 2024 (44%) and above the average for 2023 (33%). Economic optimism edged down for the second time since April, with a fall of 11 points to 33%, but remains above the long-term average of 19%. The fall in business confidence included a 12-point drop in trading prospects to 51%. Wage growth expectations eased to a five-month low, with 32% (down six points) of businesses forecasting average pay increases of 3% or more. Firms expecting to increase wages by 4% fell six points to 17%, although these levels are still above pre-pandemic norms, suggesting some underlying buoyancy. In September, the net balance of firms expecting to raise prices over the next year was down two points to 63%. As with wages, pricing expectations remain significantly above pre-pandemic levels.
Switzerland’s KOF business situation indicator for the private sector rose slightly in September 2025 after a sharp decline in August but remained weaker than in July, before new U.S. tariffs on Swiss imports, according to ETH Zurich. Manufacturing firms continued to report poor conditions, with falling order books and reduced production, part of which went into inventories. Expectations were less negative than in August but still cautious. Other sectors, notably construction and financial services, saw improvements, alongside gains in retail, other services and project planning. By region, conditions brightened in Northwestern Switzerland but worsened in the Lake Geneva region, while remaining broadly unchanged elsewhere. SMI +0.063% to 12014.28, EURCHF -0.089% to 0.93461, 10y Swiss GB -0.7bp to 0.178%.
Sweden’s retail sales volume rose 0.9% m/m in August 2025, with durables up 1.9% and consumables flat, according to Statistics Sweden. Over June-August, sales increased 0.8% from the previous three months, as durables gained 1.9% and consumables fell 0.4%. On a y/y basis, retail volumes rose 4.4% in August, with durables up 7.9% and consumables up 0.6%. In constant prices and non-working-day adjusted terms, sales increased 2.9% y/y, with durables up 6.1% and consumables down 0.4%. Retail turnover in current prices grew 4.4% y/y, supported by a 6.3% rise in durables and a 3.1% increase in consumables. OMX -0.031% to 2651.218, EURSEK -0.024% to 11.0481, 10y Swedish GB -1.7bp to 2.689%.
Sweden’s July labor market data showed employment among those aged 15-74 essentially flat at 5.37 million, up just 2,000 from a year earlier. In the 20-65 age group, unemployment rose by 15,000 to 282,000, lifting the jobless rate to 5.4%, up 0.3 percentage points y/y. Employment rates for both women (80.4%) and men (80.7%) fell 0.3 percentage points y/y. Unemployment among foreign-born people was 11.9%, compared with 3.3% for those born in Sweden. The number of ongoing employments decreased 0.2% y/y to 5.64 million, with 4.27 million lasting more than six months. Total hours worked rose 2.6% to 559 million, while gross pay stood at SEK 204bn.
Poland’s flash estimate showed consumer prices rising 2.9% y/y in September 2025 after 3.1% in August, with the index at 102.9, according to Statistics Poland. Prices were flat m/m. Food and non-alcoholic beverage prices increased by 4.2% y/y but decreased by 0.5% m/m, while electricity, gas and other fuels rose 2.4% y/y and 0.2% m/m. Fuels for personal transport equipment fell by 4.9% y/y and 0.4% m/m. The inflation rate remained slightly above the central bank’s 2.5% target but marked its lowest level since early 2024. WIG -0.202% to 106309.5, EURPLN -0.015% to 4.2675, 10y PGB -2.8bp to 5.496%.
Hungary’s industrial producer prices rose 2.3% y/y in August 2025, with domestic output prices up 0.9% and non-domestic up 3.0%. Compared with July, overall prices fell 0.8%, as domestic output declined by 0.5% and non-domestic output by 1.0%. Within domestic output, manufacturing prices rose 1.9% while energy industry prices fell 1.1%; food industry prices climbed 6.8%. By producer branch, prices fell 0.5% in energy and intermediate goods, but rose 2.2% in capital goods and 5.7% in consumer goods. Non-domestic manufacturing prices increased by 2.4%, while energy fell 3.8%. For January-August, industrial producer prices rose 6.4% y/y, with domestic prices up 3.7% and non-domestic ones up 7.7%. Budapest SI -0.076% to 99182.03, EURHUF -0.087% to 391.06, 10y HGB -2bp to 6.82%.
Hungary’s external trade in goods recorded a €557mn surplus in August 2025, improving by €263mn y/y. The export volume fell by 4.4% and the import volume by 4.1% y/y, while in EUR terms exports declined by 5.3% and imports by 8.0%. Seasonally adjusted, exports rose 0.7% m/m while imports fell 1.1%. Machinery and transport equipment exports dropped 4.4% and manufactured goods 11%, while fuel and energy exports surged 43%. Trade with the EU-27 produced a €695mn surplus, while extra-EU trade showed a €138mn deficit. Over January-August 2025, the export volume rose by 0.2% and the import volume by 1.4%, lifting the trade surplus by €920mn to €7.1bn.
Czechia’s Q2 2025 sector accounts showed household income and consumption rising modestly, while corporate profitability weakened. Real household income per capita increased 0.1% q/q and 0.3% y/y, with real consumption per capita up 0.8% q/q and 2.9% y/y. Average monthly income from employment reached CZK 52,560, rising 1.4% q/q and 4.1% y/y. The household saving rate was 18.4%, up 0.6 percentage points q/q but down 2.0 ppts y/y, while the investment rate slipped 0.1 percentage points to 10.3%. For non-financial corporations, the profit rate fell to 43.6%, down 0.1 percentage points q/q and 1.5 percentage points y/y. Labor costs rose 8.3% y/y, and the investment rate was steady at 26.3%, though 1.2 percentage points lower y/y. Prague SE -0.112% to 2334, EURCZK +0.025% to 24.304, 10y CZGB -1.6bp to 4.565%.
Türkiye’s exports fell 1.2% y/y to $21.7bn in August 2025, while imports declined 3.9% to $25.9bn, narrowing the trade deficit by 15.8% to $4.2bn, reported TurkStat. Excluding energy and non-monetary gold, exports rose 0.9% and imports dropped 2.2%, yielding a $338mn surplus. For January-August, exports grew 4.3% y/y to $178.0bn and imports rose 5.6% to $238.2bn, widening the deficit by 9.7% to $60.1bn. Manufacturing accounted for 94.9% of exports in August, while intermediate goods made up 68.3% of imports. Germany was the top export destination and China the leading source of imports. BI 100 -0.245% to 11021.1, USDTRY +0.001% to 41.5845, 10y TGB -11bp to 31.57%.
Türkiye’s August 2025 labor market and services producer prices data showed mixed trends. The unemployment rate rose 0.4 points m/m to 8.5%, with 3.04 million people out of work, while employment increased by 208,000 to 32.83 million, lifting the employment rate to 49.4%. Labor force participation climbed to 54.0%, though youth unemployment reached 16.0%, with female youth unemployment at 22.7%. Average weekly working hours eased to 41.8, and the composite labor underutilization rate edged up to 29.7%. Meanwhile, the Services Producer Price Index (S-PPI) rose 2.47% m/m and 36.16% y/y, driven by annual increases in real estate services (49.2%), professional and technical services (47.2%), administrative and support services (41.5%) and information and communication (41.6%), while transportation and storage rose 28.9%.
Australia August total dwelling approvals fell 6.0% to 14,744 vs -10% m/m in July, though they were 3.0% higher y/y. Private sector houses dropped 2.6% to 9,027, while private sector dwellings excluding houses fell 8.1% to 5,408. In trend terms, total approvals dropped by 1.0% m/m but rose 5.8% y/y. Approvals fell sharply in Victoria (-11.8%), New South Wales (-11.4%), South Australia (-10.0%) and Western Australia (-7.3%), while rising in Tasmania (14.4%) and Queensland (3.7%). The value of total residential building approvals fell 3.1% to $9.17bn, while the non-residential value surged 26.1% to $7.92bn, lifting the total building value 8.6% to $17.09bn. Meanwhile, August financial aggregates showed total credit rising 0.6% m/m, following 0.7% in July, and 7.2% y/y, up from 5.7% a year earlier. Housing credit grew 0.6% m/m and 6.1% y/y, while personal credit rose 0.5% m/m and 4.1% y/y. Business credit expanded by 0.6% m/m, slowing sharply from 1.3% in July, but accelerated to 9.9% y/y from 7.7% in August 2024. Broad money increased 0.6% m/m and 6.8% y/y, compared with 5.5% y/y a year earlier. ASX -0.144% to 5026.37, AUDUSD +0.396% to 0.6603, 10y ACGB -3.5bp to 4.298%.
New Zealand’s September ANZ activity outlook rose from 38.7 to 43.4, while business confidence came in at 49.6 vs. 49.7 in August. Past activity improved by four points to +5 and employment was up one point to -11, though weakness persisted across most sectors except agriculture. Inflation indicators edged higher, with 46% of firms planning to raise prices in the next three months and cost expectations up to 75%. One-year inflation expectations increased slightly to 2.71% from 2.63%. Employment intentions surged in manufacturing from +6 to +35, while investment intentions softened to 17.5. Profit expectations reached their highest level since April at 20.2%. NZX 50 +1.217% to 13292.36, NZDUSD +0.416% to 0.5801, 10y NZGB -1.9bp to 4.19%.
Japan August flash industrial production dropped more than expected, down -1.2% m/m, -1.3% y/y from -1.2% m/m, -0.4% y/y in July. Looking into details, inventories (-1.0% m/m, -2.6% y/y) decreased while shipments (0.5% m/m, 1.6% y/y) and the inventory ratio (2.5% m/m, 0.3% y/y) increased. Overall, the main industries contributing to the decrease were electrical machinery, and information and communication electronics equipment; fabricated metals; and inorganic and organic chemicals. The main industries making positive contributions were transport equipment (excluding motor vehicles); motor vehicles; and electronic parts and devices. According to the Survey of Production Forecast in Manufacturing, production is expected to increase in September and October. Elsewhere, Japanese retail sales fell for the second straight month in August, at -1.1% m/m or -1.1% in y/y terms. Japan August housing starts remained at a low of -9.8% y/y. Nikkei -0.247% to 44932.63, USDJPY -0.364% to 148.05, 10y JGB +0.1bp to 1.644%.
Japan’s August housing starts fell 9.8% y/y to 60,275 units, marking a fifth consecutive decline, with floor area down 8.7% to 4.60 million m². On a seasonally adjusted annualized basis, starts were 711,000, down 0.1% from July. Owner-occupied housing starts decreased 10.6% to 17,532 units, with declines of 8.1% to 26,585 units for rental housing and 18.0% for condominiums within a broader 8.2% drop in subdivision housing to 15,819 units. By region, housing starts fell in all major areas, including 9.5% in the Tokyo metropolitan area, 8.0% in Chubu, 0.6% in Kinki and 14.8% in other regions. Total building floor area fell 11.4% y/y to 7.35 million m², led by falls for factories and retail buildings.
South Korean August industrial production rose strongly by 2.4% m/m but plunged in year-on-year terms from 5.0% to 0.9%. Retail sales fell 2.4% m/m, the steepest drop in 18 months, according to Statistics Korea. Mining and manufacturing output rose 2.4% m/m, led by a 21.2% surge in automobile production and an 11% increase in medical products, but this was offset by a 3.1% decline in semiconductor output and a 0.7% fall in the service sector. Retail sales by category showed semidurable goods up 1%, while nondurable goods fell 3.9% and durable goods declined 1.6%. Facility investment fell 1.1% m/m as a 6% drop in transport equipment outweighed machinery gains. KOSPI -0.193% to 3424.6, USDKRW +0.147% to 1402.45, 10y KTB +0.1bp to 2.936%.
China’s non-official RatingDog PMI showed manufacturing sector conditions in China improving to 51.2 at the end of the third quarter, from 50.5 in August. Rising new orders, including new export orders, drove faster production growth in September. As a result, companies raised their purchasing activity at a solid pace, which led to further accumulation of inventories. Meanwhile, the rate of job shedding eased as pressure on capacity continued to build, while overall business confidence improved. Turning to prices, cost pressures intensified for manufacturers in September, but firms opted to cut their selling prices amid intense competition. The services sector PMI continued to expand at a solid pace in September, at 52.9. The upturn was driven by rising volumes of new business, including a stronger increase in new export orders. Business confidence also improved, reaching a six-month high. That said, job shedding persisted amid concerns over costs, with employment falling at the fastest rate in nearly a year and a half. Turning to prices, average input costs rose at a slightly faster rate in September, while prices charged increased fractionally. CSI 300 +0.447% to 4640.69, USDCNY 0% to 7.1224, 10y CGB -2.6bp to 1.871%.
Philippines’ August seasonally adjusted exports fell 1.2% m/m to $6.99bn, down from $7.07bn in July. Agro-based product exports declined 1.0% to $588.73mn, while mineral products dropped 16.6% to $730.03mn. Manufactured goods rose slightly, up 0.2% to $5.51bn. Imports fell more sharply, down 6.2% m/m to $10.58bn from $11.28bn in July. Declines were recorded in raw materials and intermediate goods (-3.6% to $3.86bn), consumer goods (-3.3% to $2.29bn) and capital goods (-2.8% to $3.27bn). PSEi -0.736% to 5953.46, USDPHP +0.135% to 58.213, 10y PHGB -6.3bp to 5.94%.
The latest Bank of Thailand monthly update showed Thailand’s economy weakening in August, as agricultural output, industrial production and trade-related services declined. Manufacturing was down in automobiles and in food and beverages amid weak demand and high inventories. Private consumption, investment and merchandise exports were stable, though electronic exports softened after prior gains. Tourism rose, supported by higher domestic and foreign visitor numbers, while government spending edged lower on reduced capital outlays. Headline inflation fell 0.8% y/y, driven by declines in fresh food prices, while energy inflation eased and retail oil prices stabilized; core inflation was steady. The current account posted a $1.5bn deficit due to a wider services and income gap, while employment remained stable. SET -0.617% to 1280.12, USDTHB +0.248% to 32.335, 10y TGN +7.7bp to 1.43%.
Thailand’s manufacturing production fell 4.2% y/y in August, the sharpest drop in two years and worse than the estimated 2.0% decline. This marked the second consecutive monthly contraction, following a revised 3.8% fall in July. On a m/m basis, output dropped 1.5%. Automobile production slumped 8.1% y/y, driven by weaker pickup truck and hybrid car output and temporary halts from facility relocations. Broader pressures included reduced foreign tourist arrivals, tensions at the Thailand-Cambodia border and uncertainty over U.S. tariffs. The production index stood at 92.13, with the capacity utilization rate at 57.19, down from 56.93 in July.