Market Movers: Negotiation
Market Movers highlights key activities and developments before the U.S. market opens each morning.
Market Movers highlights key activities and developments before the U.S. market opens each morning.

Geoff Yu, Wee Khoon Chong
Time to Read: 10 minutes
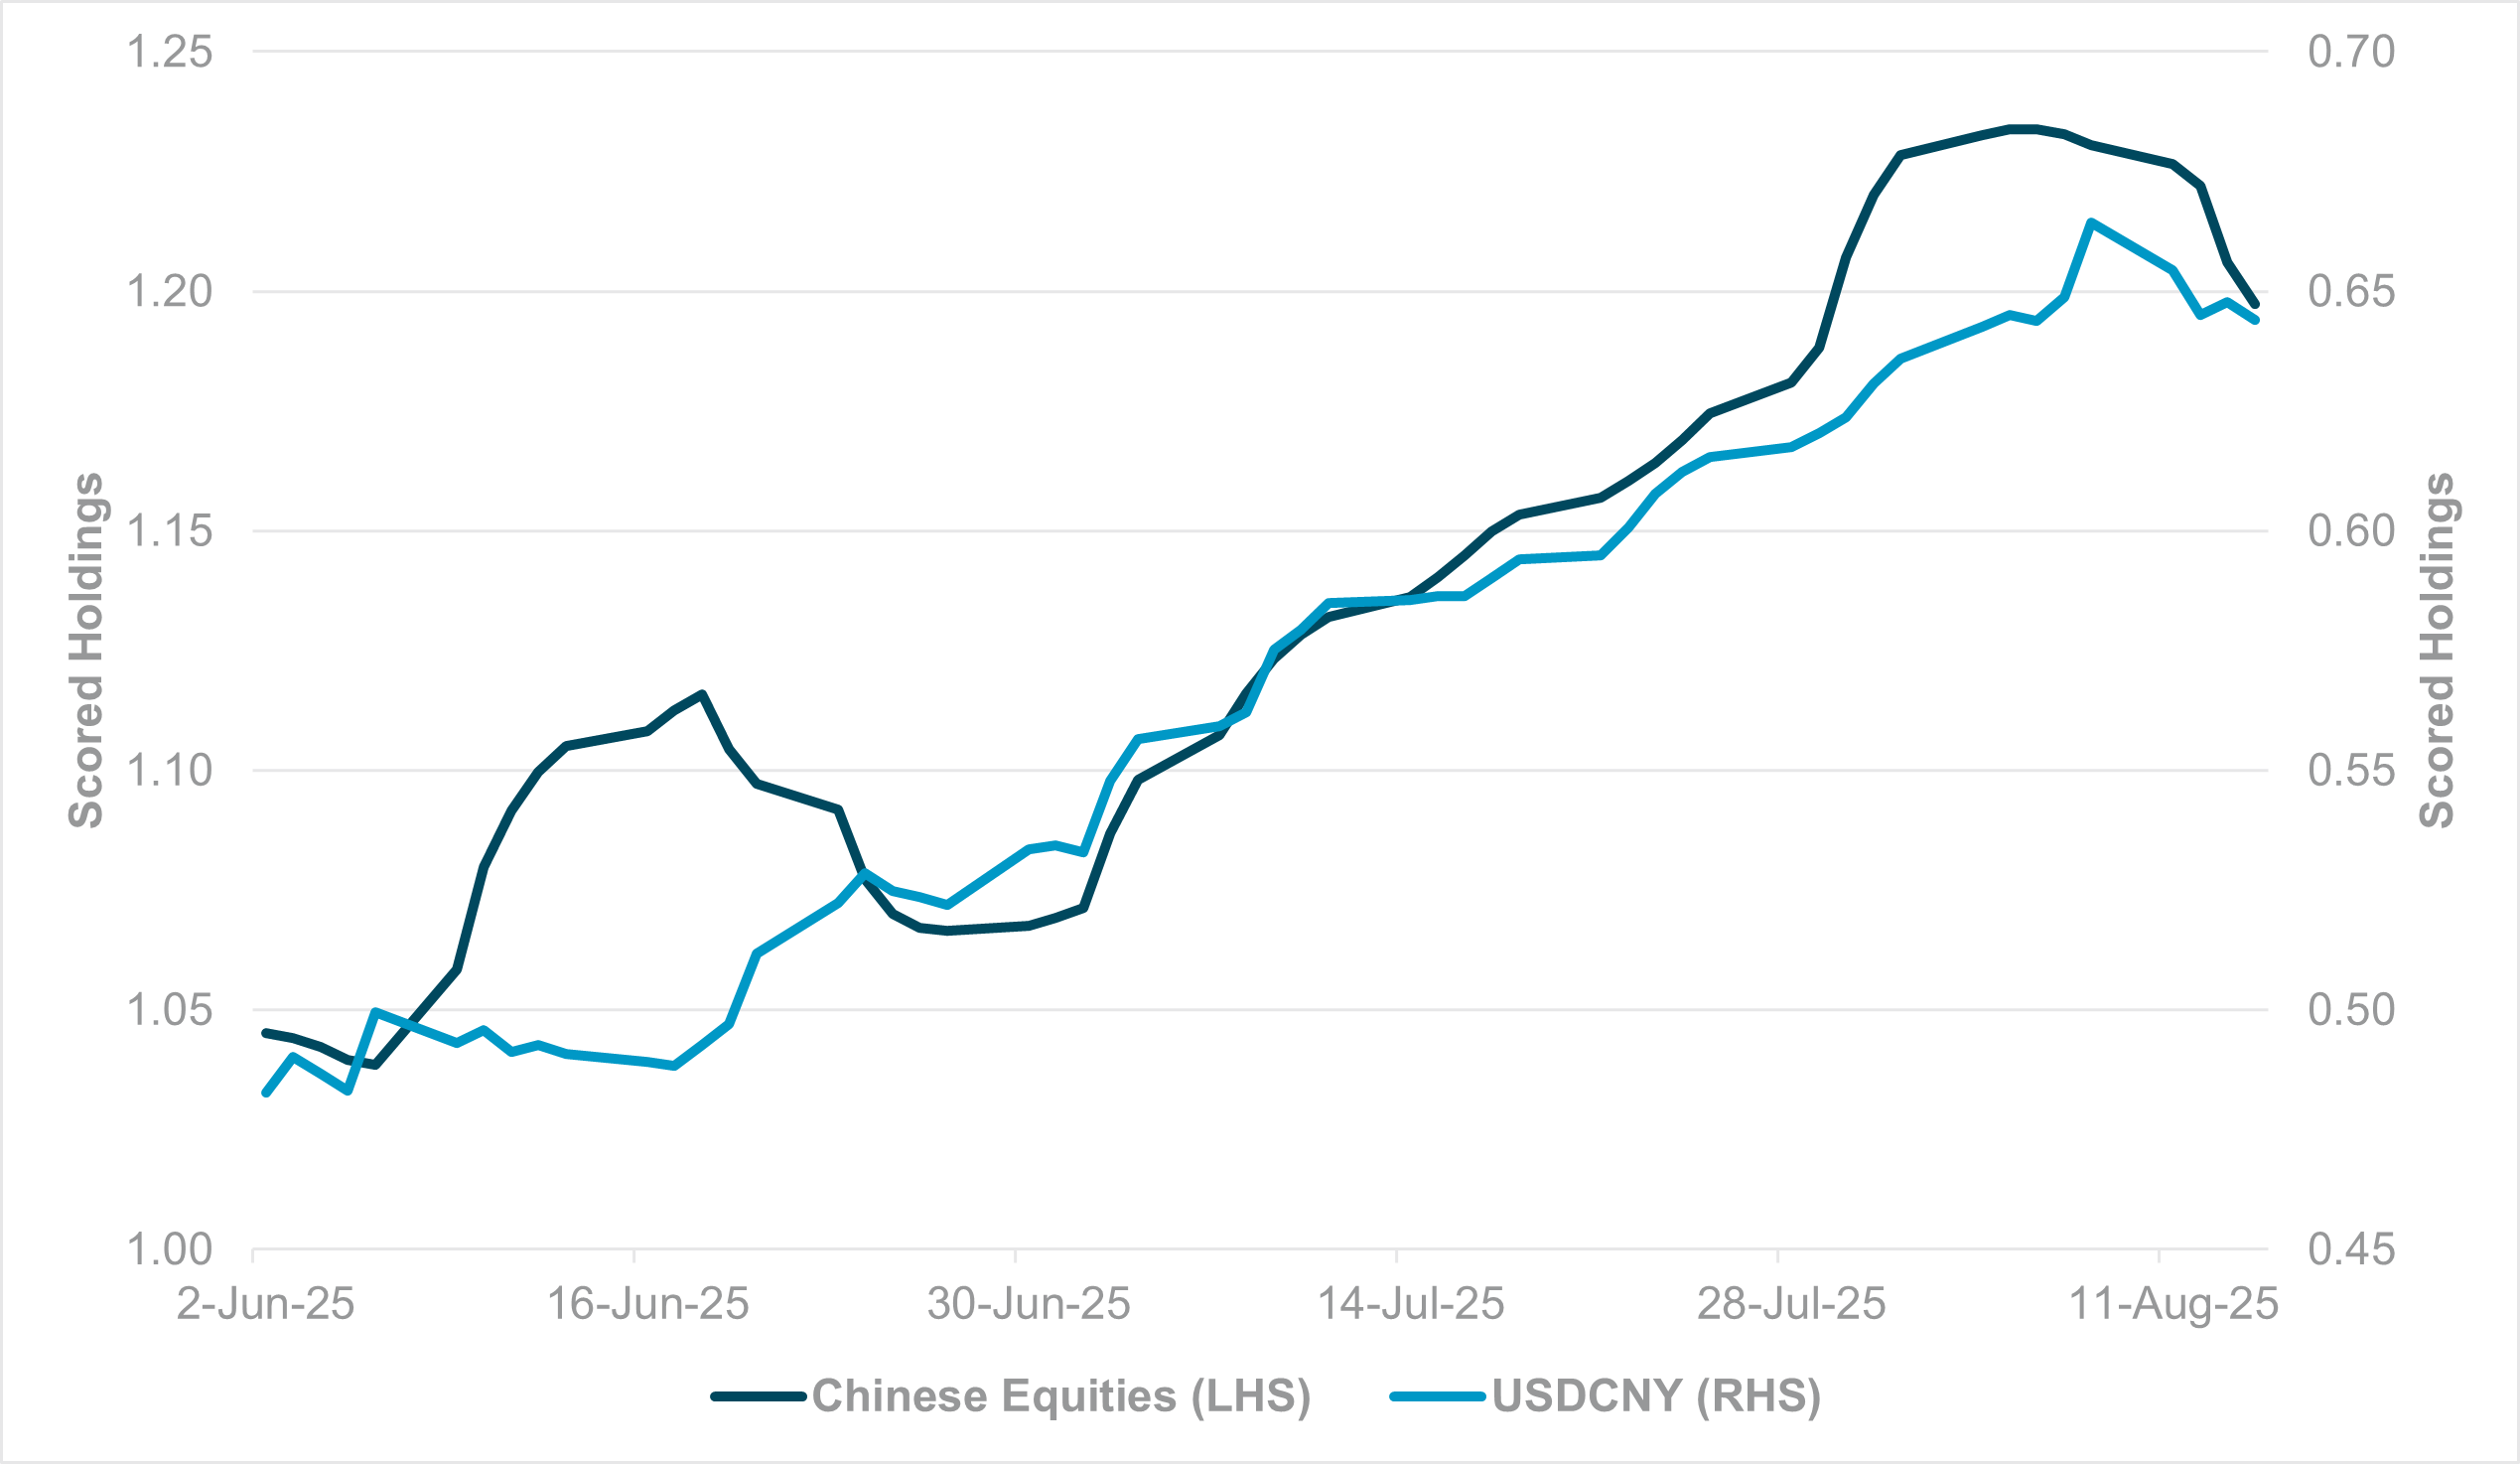
HEDGING INTEREST CONTINUES TO TRACK CHINESE EQUITY EXPOSURES
Source: BNY
Trading activity in Chinese equities and Hong Kong remain robust, especially after a record day of Southbound flow on Friday. Judging by the moves in Chinese government bond (CGB) yields, rotational flows into equities are proceeding apace. If this can further support reflation (or anti-disinflation) expectations and corporates finally see themselves in a position to improve margins, a virtuous cycle is feasible to support the market further. A bigger question is whether cross-border flows from outside the region can also pick up in size and begin supporting the currency. Based on current evidence, we don’t see this to be case. Scored holdings of Chinese equities began to rise in earnest in late July before stalling in recent sessions. During this period, USDCNY holdings have also seen commensurate accumulation, before peaking at around the same time. We acknowledge that USDCNY overheld positions (which dominate CNY underheld positions) normally reflect hedges on CGBs, and equity holdings normally would have lower hedge ratios, but the coincidental moves also suggest cross-border investors do not wish to add excessive FX risk as well. Even with the prospect of a more dovish Fed, which remains debatable, it is hard to see front-end rate differentials shift materially back in favor of the CNY. Furthermore, while Chinese equities are less sensitive to trade matters due to higher levels of domestic participation, the current environment involving tariffs requires a defensive stance, thereby limiting interest in adding to FX risk, even though equity interest is clearly robust.
Amid a tentative start to the week, geopolitics will probably demand the market’s attention again today. Ukrainian President Zelenskyy and a large delegation of European leaders arrive in Washington, D.C. for talks with President Trump on Ukraine’s path forward after the Trump-Putin summit in Alaska. Expectations for any breakthrough are low, but apart from energy and assets with direct exposure to the region, the marginal impact on sentiment from the conflict has faded. We doubt it will be long before the focus shifts to the annual Federal Reserve Economic Policy Symposium in Jackson Hole, Wyoming. Although the 2025 topic of note is “Labor Markets in Transition: Demographics, Productivity and Macroeconomic Policy,” questions surrounding central bank independence will loom over every single speech and all panel discussions. As for macroeconomic policy discussions, dealing with “stagflation” and its root causes will have a more immediate bearing on monetary policy. Last week’s array of upside surprises in price data indicates that inflationary pressures continue to loom large. Jackson Hole participants will highlight labor market-based and other structural supply-side drivers of price and wage stickiness, with the tariff angle inescapable, especially as new sector-specific tariff announcements, from steel to chips, are due shortly. If advocates of a September cut continue to moderate their tone, U.S. equities may need to recalibrate expectations for financial conditions. Meanwhile, the U.S. asset diversification theme may find new impetus as Asia-Pacific equities gain ground, led by China, as high levels of retail participation in both Hong Kong and mainland exchanges drive indices to decade highs. The region remains an area of material underallocation for international investors, but a more sustainable earnings and margins narrative — led by a gradual recovery in inflation and supported by domestic stimulus plans — will prove difficult to discount.
European and NATO leaders announced they will join Ukrainian President Zelenskyy in Washington for talks with Trump, following his summit with Russian President Putin, from which Zelenskyy was excluded. The coordinated move aims to bolster Zelenskyy after a tense February Oval Office meeting and reinforce Europe’s role in any peace process. European Commission President Ursula von der Leyen, NATO Secretary-General Mark Rutte, French President Emmanuel Macron, German Chancellor Friedrich Merz and U.K. Prime Minister Keir Starmer all confirmed their participation. While not all leaders may join the direct talks with Trump, their presence highlights Europe’s backing of Ukraine and determination to prevent Kyiv from being pressured into an unfavorable deal. Eurostoxx 50 -0.397% to 5426.99, EURUSD -0.18% to 1.1682, BBG AGG Euro Government High Grade EUR 0bp to 2.863%.
China’s rare earth product exports rose 69% m/m to 6,422 tons in July 2025, reaching a six-month high following earlier decline caused by Beijing’s export controls on magnets in April and May in retaliation for U.S. tariff threats. The “products” category, largely magnets, is a critical component in manufacturing and was central to U.S.-China trade talks. Shipments rebounded after both sides struck a trade truce, with U.S. officials noting supplies have recovered to about half of pre-control levels. CSI 300 +0.882% to 4239.41, USDCNY -0.099% to 7.1774, 10y CGB +3.8bp to 1.786%.
U.K. August property prices fell 1.3% m/m (–£4,969) to £368,740, in line with seasonal norms after sharper declines in June and July. Competitive pricing by “savvy summer sellers” drove the best July for sales agreed since 2020, with transactions 8% higher y/y and housing supply up 10% y/y, limiting annual price growth to 0.3%. Around 34% of listings saw price reductions, the highest for July since 2023, with homes finding buyers in 32 days without cuts, vs. 99 days with cuts. The Bank of England’s third rate cut this year lifted buyer sentiment, with the average two-year mortgage rate at 4.49%, down from 5.17% a year earlier, though uncertainty remains over further easing. FTSE 100 +0.038% to 9142.38, GBPUSD -0.074% to 1.3544, 10y gilt -3bp to 4.666%.
Fitch Ratings has affirmed New Zealand's Long-Term Foreign-Currency Issuer Default Rating (IDR) at 'AA+' with a Stable Outlook. Fitch Ratings cited strong governance, sound macroeconomic policies and a commitment to fiscal consolidation. Despite delays in achieving fiscal balance until FY29, debt is projected to decline over the medium term. Gross general government debt is expected to peak at 56% of GDP in FY27, then decline. GDP growth is expected to recover to 1.2% in 2025 and 2.5% by 2026–2027. The Reserve Bank continues monetary easing, while inflation remains within target. External vulnerabilities persist due to high household and net external debt, but substantial government assets and strong market access mitigate risks. Political stability and institutional quality support the rating. Non-resident bond holdings increased marginally from 62.7% to 62.8% in July. NZX 50 +0.63% to 12970.64, NZDUSD +0.321% to 0.5941, 10y NZGB +1.9bp to 4.447%.
Trump will meet Zelenskyy at 1:15 p.m. ET and European leaders at 3 p.m. ET.
U.S. August New York Fed services business may improve further from July (-9.3) while markets will be attentive to the price paid index (64.5 in July) due to inflation fears.
U.S. August NAHB housing market index is seen to rise to 34 from 33 in July.
U.S. Treasury sells $82bn in 13-week bills and $73bn in 26-week bills.
The Fed’s Michelle Bowman will appear on Bloomberg Television at 12:45 p.m. ET.
Mood: iFlow Mood remains in risk-off territory. Equities market continues to be sold amid steady demand for core sovereign bonds.
FX: EMEA region posted the only inflows, led by ZAR, vs. the rest of the region. HKD, THB and CLP posted the most outflows. Within the G10, EUR and JPY were moderately bought against light outflows in USD, GBP and AUD.
FI: U.S. Treasurys, Eurozone and Brazilian government bonds posted the most buying. Chinese, Canadian, New Zealand and Mexican government bonds were most sold. Elsewhere, U.K. gilts posted significant cross border outflows.
Equities: U.S. equities were bought against broad selling in the rest of G10. Elsewhere, Mexican and Israeli equities were significantly sold against best buying flows in Brazil, Türkiye and South Korea. With DM EMEA, the consumer staples sector was most sold, while energy and material sectors drew best demand.
“Everything is negotiable. Whether or not the negotiation is easy is another thing.” — Carrie Fisher
“Let us never forget that the art of negotiation is not about conquering, but about trading illusions.” — Domenico Cieri Estrada
The Euro area’s June 2025 trade surplus narrowed to €7.0bn from €20.7bn a year earlier, as exports rose 0.4% y/y to €237.2bn while imports increased 6.8% y/y to €230.2bn. The monthly surplus also fell from €16.5bn in May, largely due to a drop in chemicals surplus to €15.1bn. Compared with June 2024, surpluses in chemicals, machinery & vehicles, and other manufactured products all weakened. In January–June 2025, the euro area posted a €93.3bn surplus, down from €102.0bn a year earlier, with exports up 3.9% y/y and imports up 4.9%. Intra-euro area trade reached €1,319.5bn, up 1.3% y/y.
Spain’s June 2025 services sector production index rose 4.2% y/y in calendar- and seasonally adjusted terms, and 5.4% in original terms, with monthly growth of 0.2% adjusted and 3.7% unadjusted. Over the same period, the business turnover index increased 5.1% y/y adjusted and 6.0% in original terms, with a 1.5% monthly rise. By sector, extractive and manufacturing industries grew 1.8% y/y adjusted (3.4% original); electricity, water and waste management advanced 14.2% (17.9% original); commerce rose 5.8% (6.6% original); and non-financial market services gained 5.9% (6.0% original). IBEX 35 –0.391% to 15242, EURUSD –0.18% to 1.1682, 10y Bono –5bp to 3.302%.
Switzerland’s secondary sector (industry and construction) output fell 0.4% y/y in Q2 2025, while industrial production slipped 0.1% after strong 8.9% growth in Q1. Manufacturing rose 0.7%, supported by gains in pharmaceuticals (+1.6%) and electronics/watches (+1.8%), but textiles (–4.7%), wood and paper (–1.9%), rubber/plastics (–0.8%) and metals (–1.2%) declined. Electricity supply dropped sharply (–8.9%). Construction contracted 0.5%, though civil engineering grew 7.5% and building construction rose 1.9%, while specialized construction fell 2.5%. Compared with Q1, which saw broad-based strength, Q2 reflected a weaker industrial picture with energy and traditional manufacturing weighing on output despite resilience in pharmaceuticals and engineering. SMI –0.146% to 12056.72, EURCHF –0.109% to 0.94282, 10y Swiss GB –4.8bp to 0.282%.
Czech producer prices in July showed mixed trends. Industrial producer prices rose 0.1% m/m, supported by petroleum products and food, but declined 1.2% y/y, with sharp drops in electricity (–4.0%), chemicals (–6.9%) and coal (–10.4%), partly offset by food (+4.0%). Construction work prices increased 0.3% m/m and 2.6% y/y, while service producer prices in the business sphere fell 1.4% m/m but rose 4.1% y/y, led by programming (+21.4%), advertising (+15.5%) and security services (+12.6%). Agricultural producer prices fell 1.9% m/m, driven by oilseeds (–7.0%), eggs (–3.3%) and cereals (–2.5%), but rose 11.2% y/y on higher fruit (+21.5%), oilseeds (+12.0%), cereals (+9.1%) and animal products (+17.8%), including eggs (+42.5%) and cattle (+35.8%). Prague SE –0.638% to 2307.31, EURCZK –0.025% to 24.455, 10y CZGB +0.2bp to 4.339%.
Japan’s tertiary industry activity index rose 0.5% m/m in June to 105.0, up 3.3% y/y. Broad-ranging personal services increased 0.7% m/m and 2.1% y/y, while business services rose 1.1% m/m and 4.3% y/y. Key contributors included transport and postal activities (+3.3% m/m), electricity, gas, heat supply and water (+4.1% m/m), retail trade (+0.7% m/m), finance and insurance (+0.7% m/m), business-related services (+0.5% m/m), medical, health care and welfare (+0.5% m/m), and wholesale trade (+0.3% m/m). These gains were offset by declines in information and communications (–0.9% m/m), real estate (–1.0% m/m), and living and amusement-related services (–0.8% m/m). Nikkei +0.775% to 43714.31, USDJPY +0.096% to 147.33, 10y JGB –0.2bp to 1.57%.
New Zealand July Performance Services Index remains in contraction for the sixth consecutive month. July PSI was 48.9 vs. 47.6 in June. For the sub-index results, activity/sales (47.5) still was unable to exhibit any expansion, while new orders/business (50.0) displayed no change. Stocks/inventories (51.4) did show expansion for the second consecutive month, although employment (47.1) remained in contraction for 20 consecutive months. The proportion of negative comments for July (58.5%) was down from June (66.2%) and May (65.6%). Service sector businesses reported declining sales, reduced spending and low confidence due to cost-of-living issues, inflation, high interest rates and a slow economy. Other challenges included seasonal downturns, weather impacts, rising costs, staffing issues and uncertainty from global conditions. NZX 50 +0.63% to 12970.64, NZDUSD +0.321% to 0.5941, 10y NZGB +1.9bp to 4.447%.
Singapore July non-oil domestic exports (NODX) fell more than expected at –4.6% y/y from 12.9% in June while electronic exports eased to 2.8% from 8.0% y/y. NODX to the U.S., China and Indonesia declined in July 2025, while NODX to the EU 27, Taiwan, South Korea and Hong Kong grew. NODX to the U.S. contracted by 42.7% in July 2025 (June: –4.8%) due to pharmaceuticals (–93.5%), specialized machinery (–45.8%) and food preparations (–48.8%). NODX to China declined by 12.2% in July 2025 (June: +8.5%) due to specialized machinery (–18.4%), petrochemicals (–21.4%) and ICs (–32.9%). NODX to Indonesia contracted by 32.2% in July 2025 (June: –13.6% y/y) due to non-monetary gold (–95.9%), petrochemicals (–19.1%) and electrical machinery (–64.1%). NODX to Hong Kong, South Korea and Taiwan grew strongly at 20.8% y/y, 34.5% y/y and 62.9% y/y, respectively. STI –0.908% to 4192.13, USDSGD –0.063% to 1.2822, 10y SGB –1.1bp to 1.883%.
Thailand Q2 GDP eases to 0.6% q/q, 2.8% y/y from 0.7% q/q, 3.2% y/y in Q1 2025. Gross domestic product in Q2/2025 increased by 2.8%, decelerated from 3.2% in Q1 2025, owing to a slowdown in the non-agriculture sector, especially for tourism-related activities in the service sector, while agriculture sector expanded continually. On the expenditure side, private final consumption expenditure (2.1% y/y, vs. Q1: 2.5%) and general government final consumption expenditure (2.2% y/y, Q1: 3.4% y/y) decelerated. The exports of goods and services continually expanded (12.2% y/y, Q1: 12.3% y/y). On the contrary, gross fixed capital formation (5.8%, Q1: 4.7% y/y) and imports of goods and services (10.8% y/y. Q1: 2.1%) accelerated. In the first half of 2025, the Thai economy expanded by 3.0% y/y. In 2025 it is projected to expand within the range of 1.8–2.3% (2.05% mid) with the midpoint forecast of 2.0%, higher than the 1.3–2.3% (1.8% mid) GDP forecasted in May from 2.5% in 2024. Current account is projected at $11.9bn or 2.1% of GDP (May forecast: $13.7bn or 2.5% of GDP) and inflation is revised lower from 0–1.0% (mid 0.5%) to 0–0.5% (mid 0.25%) for 2025. SET –1.051% to 1246.18, USDTHB +0.071% to 32.45, 10y TGN –7.6bp to 1.344%.