Halftime Report: EU and U.S. Q2 Earnings
Equities provides an in-depth look each Friday at the factors shaping equities markets in developed and emerging economies around the world.
Equities provides an in-depth look each Friday at the factors shaping equities markets in developed and emerging economies around the world.

Bob Savage
Time to Read: 7 minutes
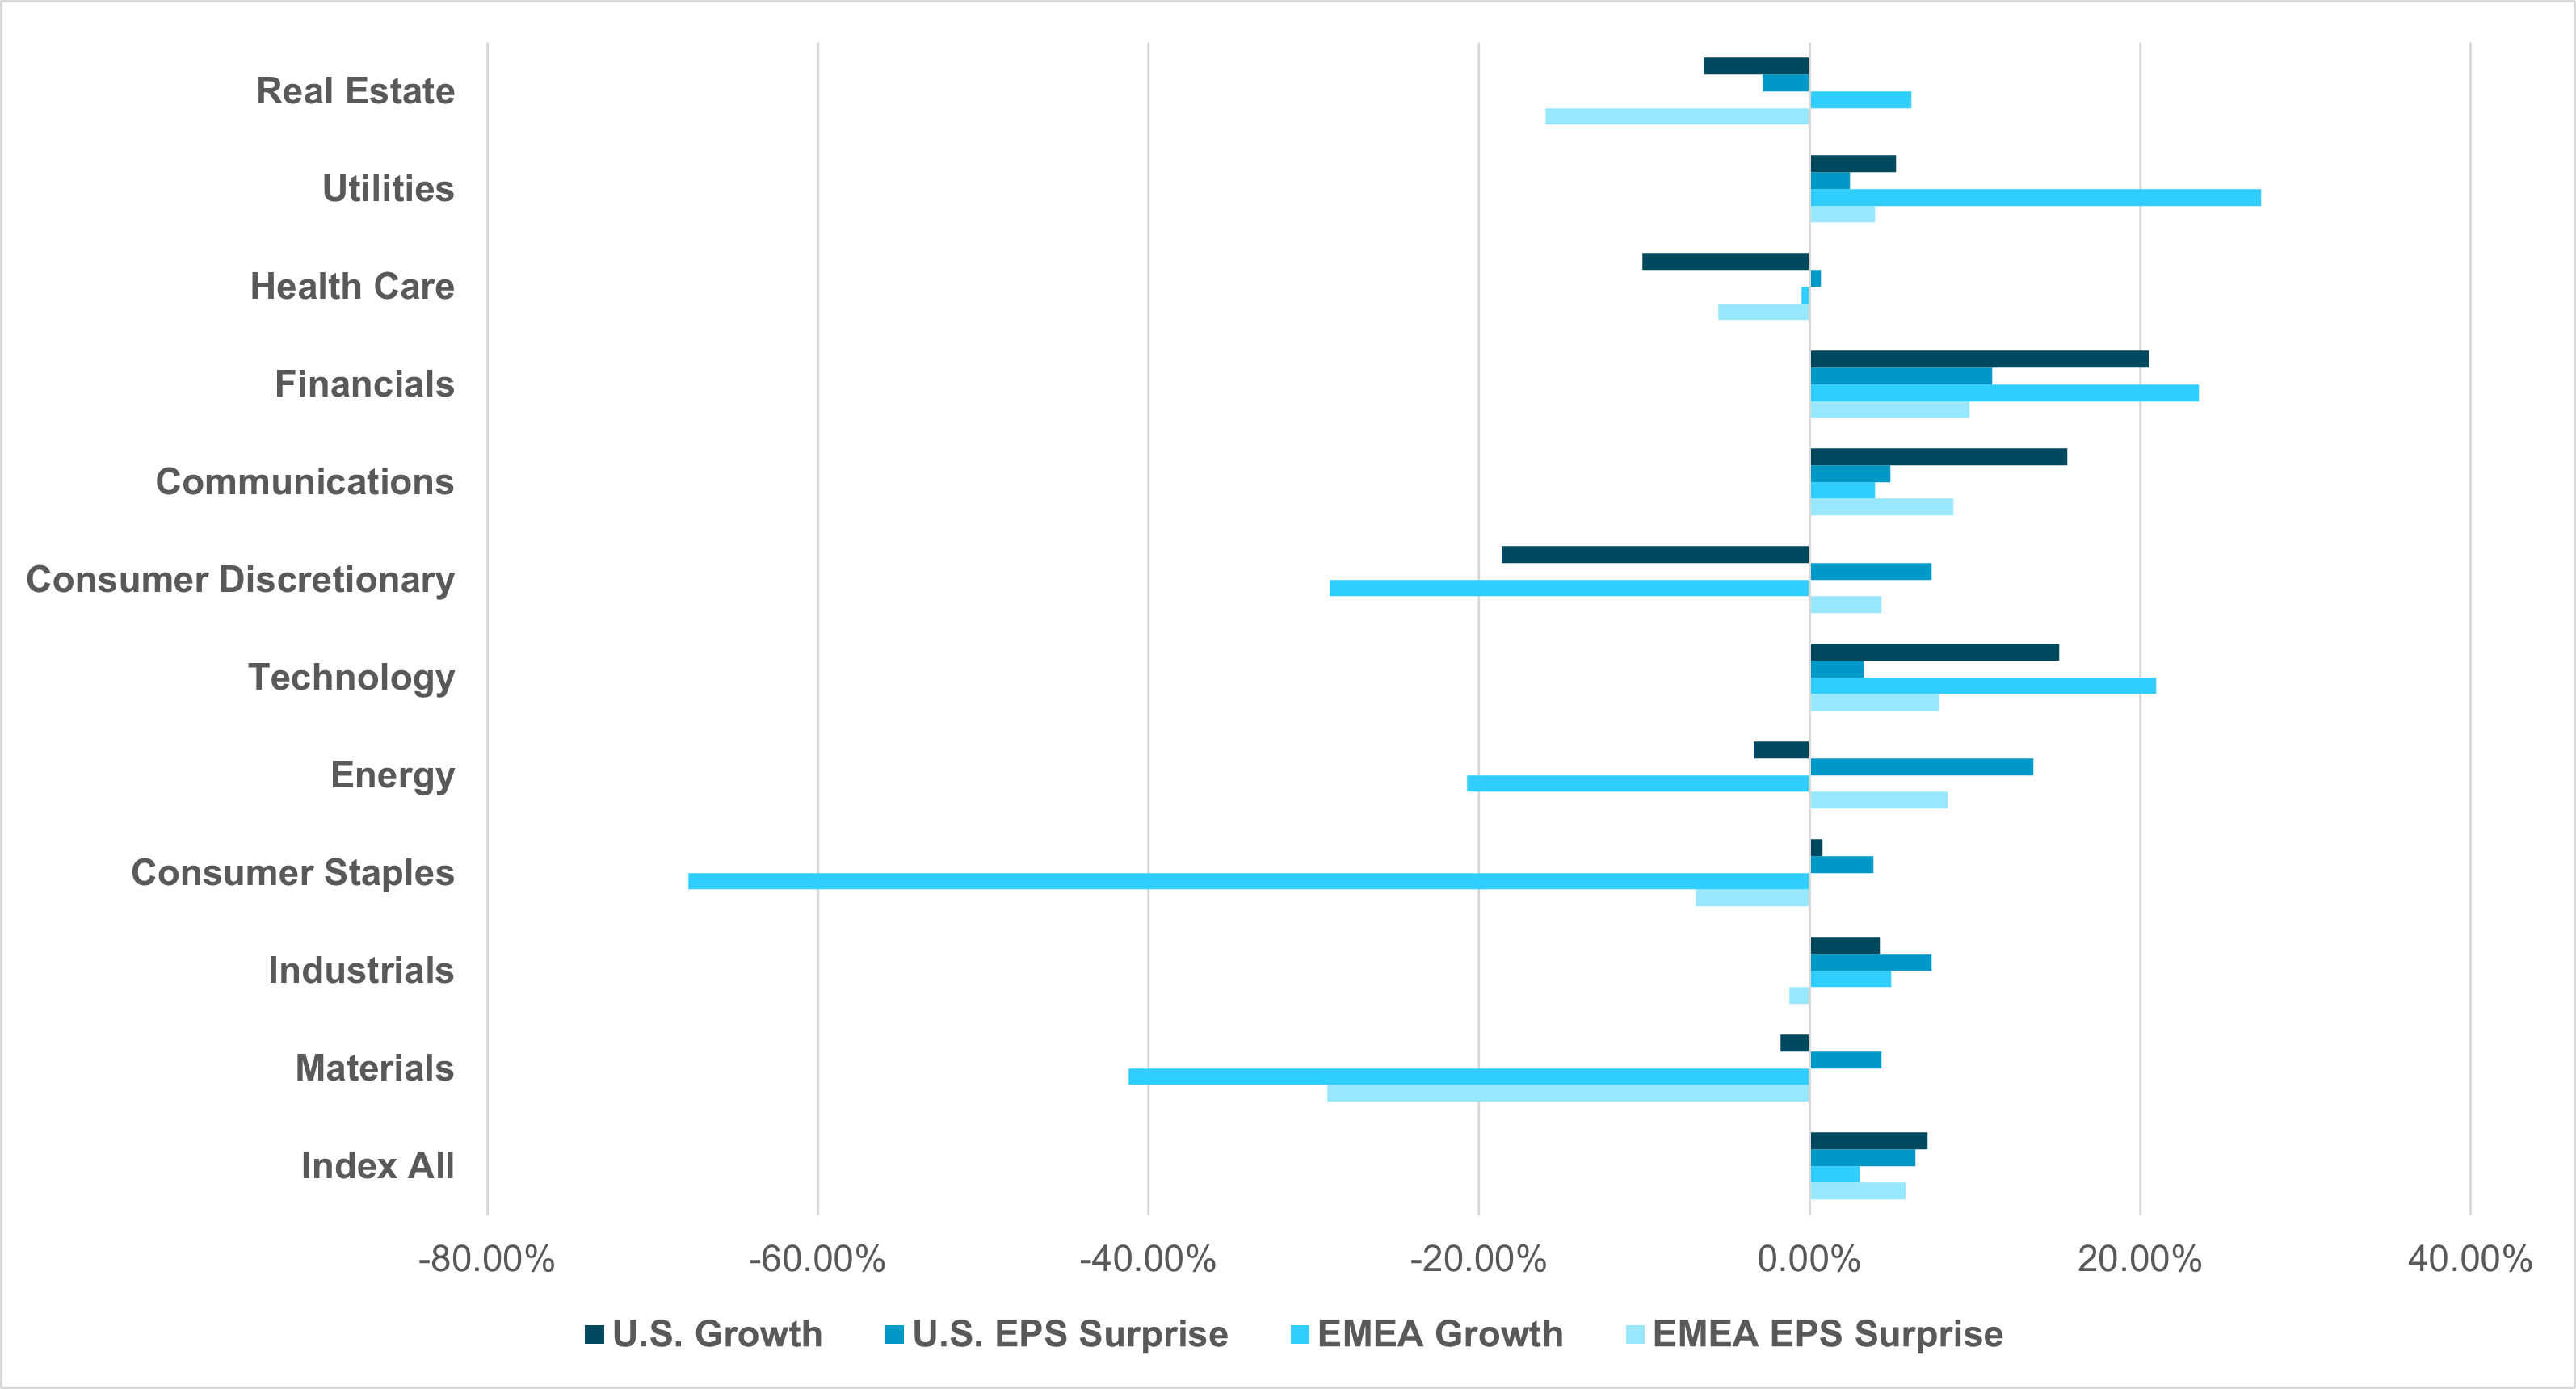
EXHIBIT #1: EUROSTOXX 600 VS. S&P 500 Q2 EARNINGS SURPRISES AND GROWTH BY SECTOR
Source: BNY
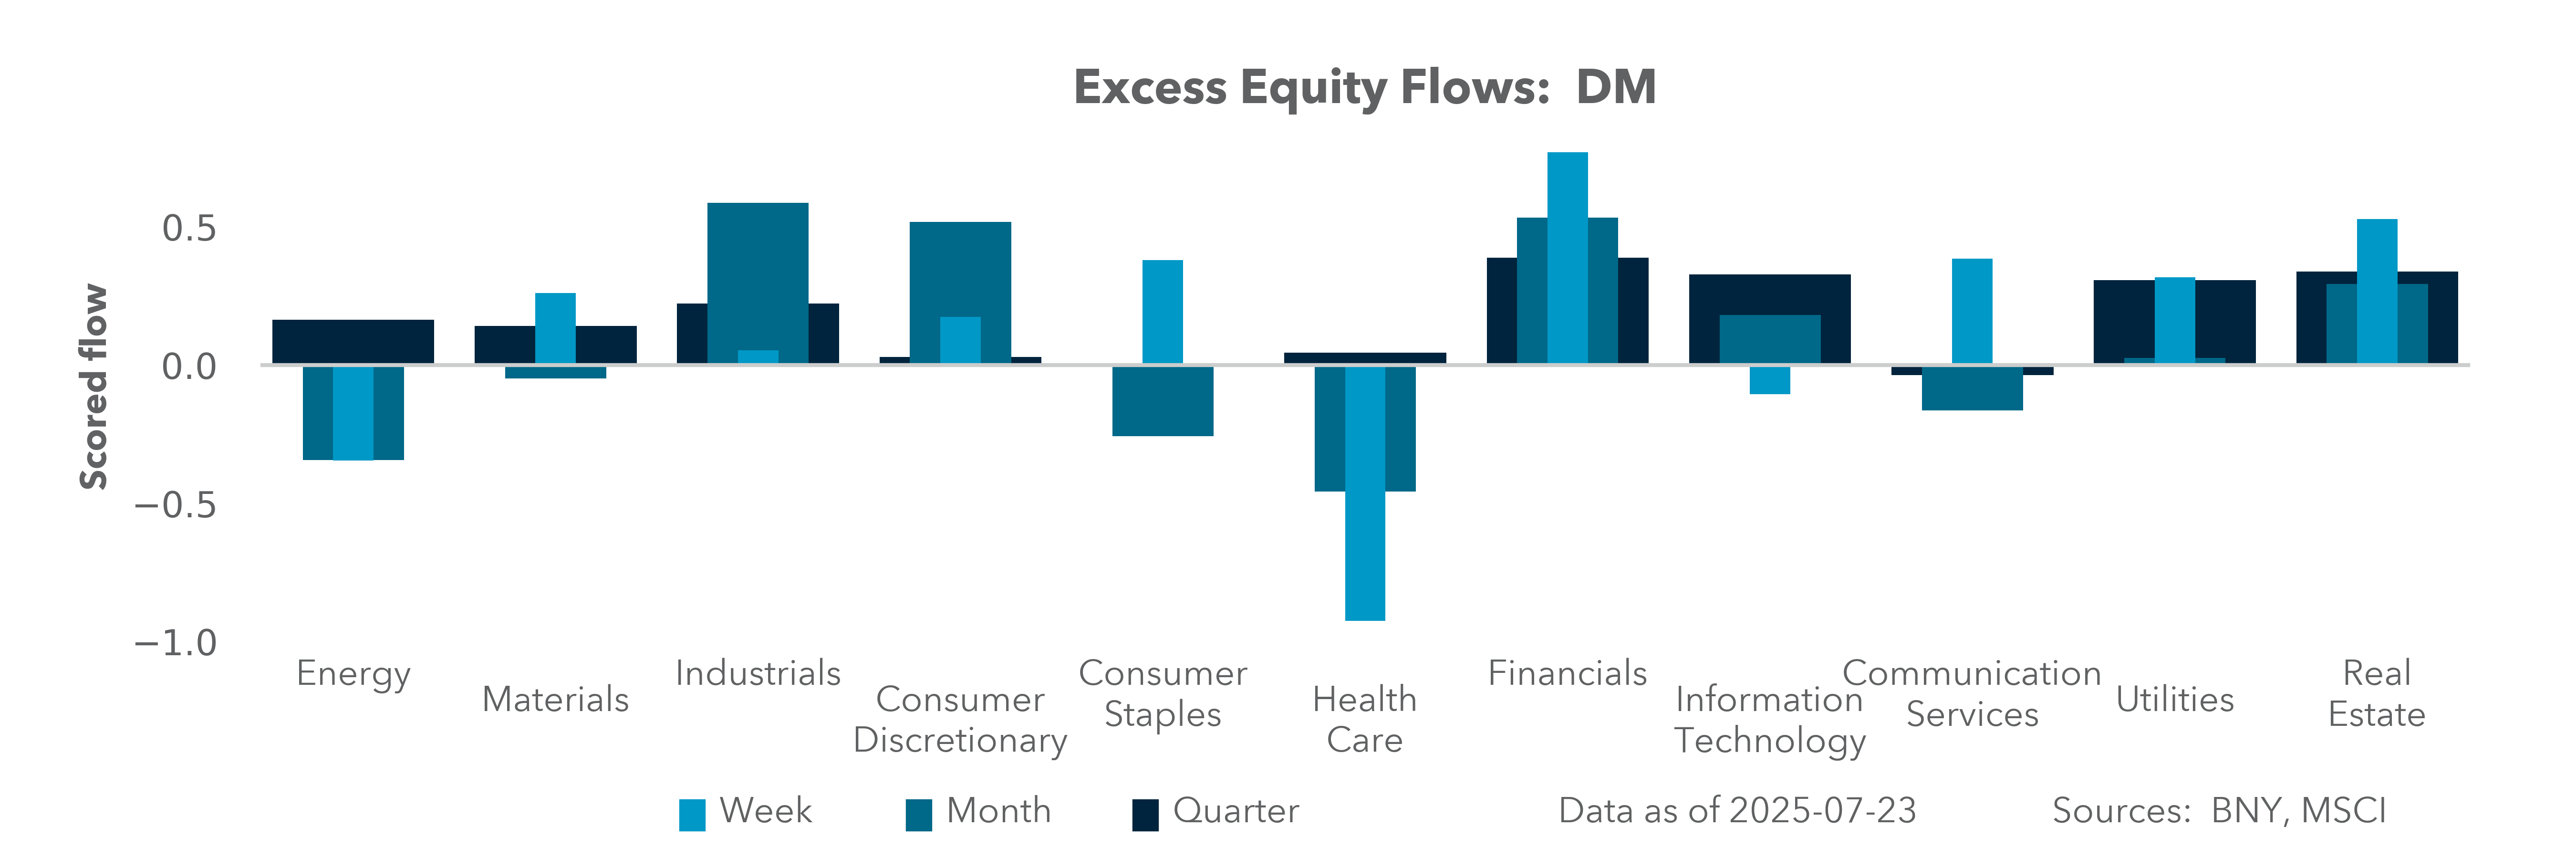
At the halfway mark of the Q2 earnings season, the modest overall differences between European and U.S. corporate results is unlikely to drive a significant rotation trade, though the risks are skewed as downside misses are seeing bigger price reactions than upside surprises. This reflects overall long equity positioning globally. Sector-level analysis reveals opportunities in Utilities, IT and Consumer Goods, reflecting distinct market compositions, with Big Tech dominant in the U.S., while industrials lead the way in Europea. Positioning data indicate European equity holdings are at an extreme, whereas U.S. holdings are near normal – excluding Big Tech. Key themes from earnings calls include tariffs forcing a rethink of pricing, a 4.5x rise in analyst questions about macroeconomic caution, over 40% of CEOs citing AI as a key investment for efficiency, and a focus on discretionary spending. In the U.S., this has led to a clear bifurcation, with longs in IT against shorts in Health Care. Europe risks the perception that it’s behind on the AI productivity push, while misses in Materials and Consumer Staples will likely also drive positioning shifts. Should new U.S. earnings trigger a risk-reduction rotation, the focus may shift to heavily shorted sectors like Energy, Real Estate and, in particular, Health Care. This risk is amplified by the view that U.S. growth may have peaked in Q2, with domestic demand slowing to near 1%, and the rebound in the S&P 500 still behind other global bourses in 2025.
Our take
At the midpoint in Q2 earnings (with more than half of companies reporting), the surprise and growth differences between Europe and U.S. companies is modest and unlikely to drive a significant rotation trade. However, comparing sectors there is a clear opportunity in Utilities, IT and Consumer Goods. The key difference between Q2 earnings in the U.S. and Europe is sector dominance, with Big Tech dominating in the U.S., while industrials remain key for Europe. The risks for investors are skewed as downside misses see bigger price reactions than upside surprises.
Forward look
Q2 reports do not fully reflect expectations that tariffs would drive weaker demand and slower growth. FX markets, however, have responded more quickly, revealing margin and growth pressure from policy shifts globally. There are different valuation factors pushing EU vs. U.S. flows:
The FX impact on earnings shows up most clearly in Europe, with 60% of revenues from outside the EU, while the U.S. has slowed to about 30% of revenues. In general, for every increase in the euro of 1% results in a 0.3% drag on earnings, suggesting the Q2 drag was 2–3% given the euro’s moves. By contrast, the U.S. experiences a more modest 0.2% drag for every 1% move in the USD index, suggesting a 2% gain in Q2. Given the rise of the USD in July, some rethinking of Q3 outlooks, coupled with clarity on import costs, may force a larger rotation risk.
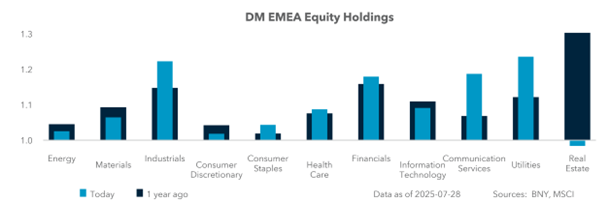
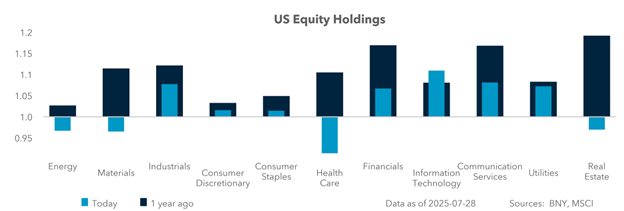
EXHIBIT #2: IFLOW EMEA AND U.S. EQUITY HOLDINGS
Source: BNY, Bloomberg
Our take
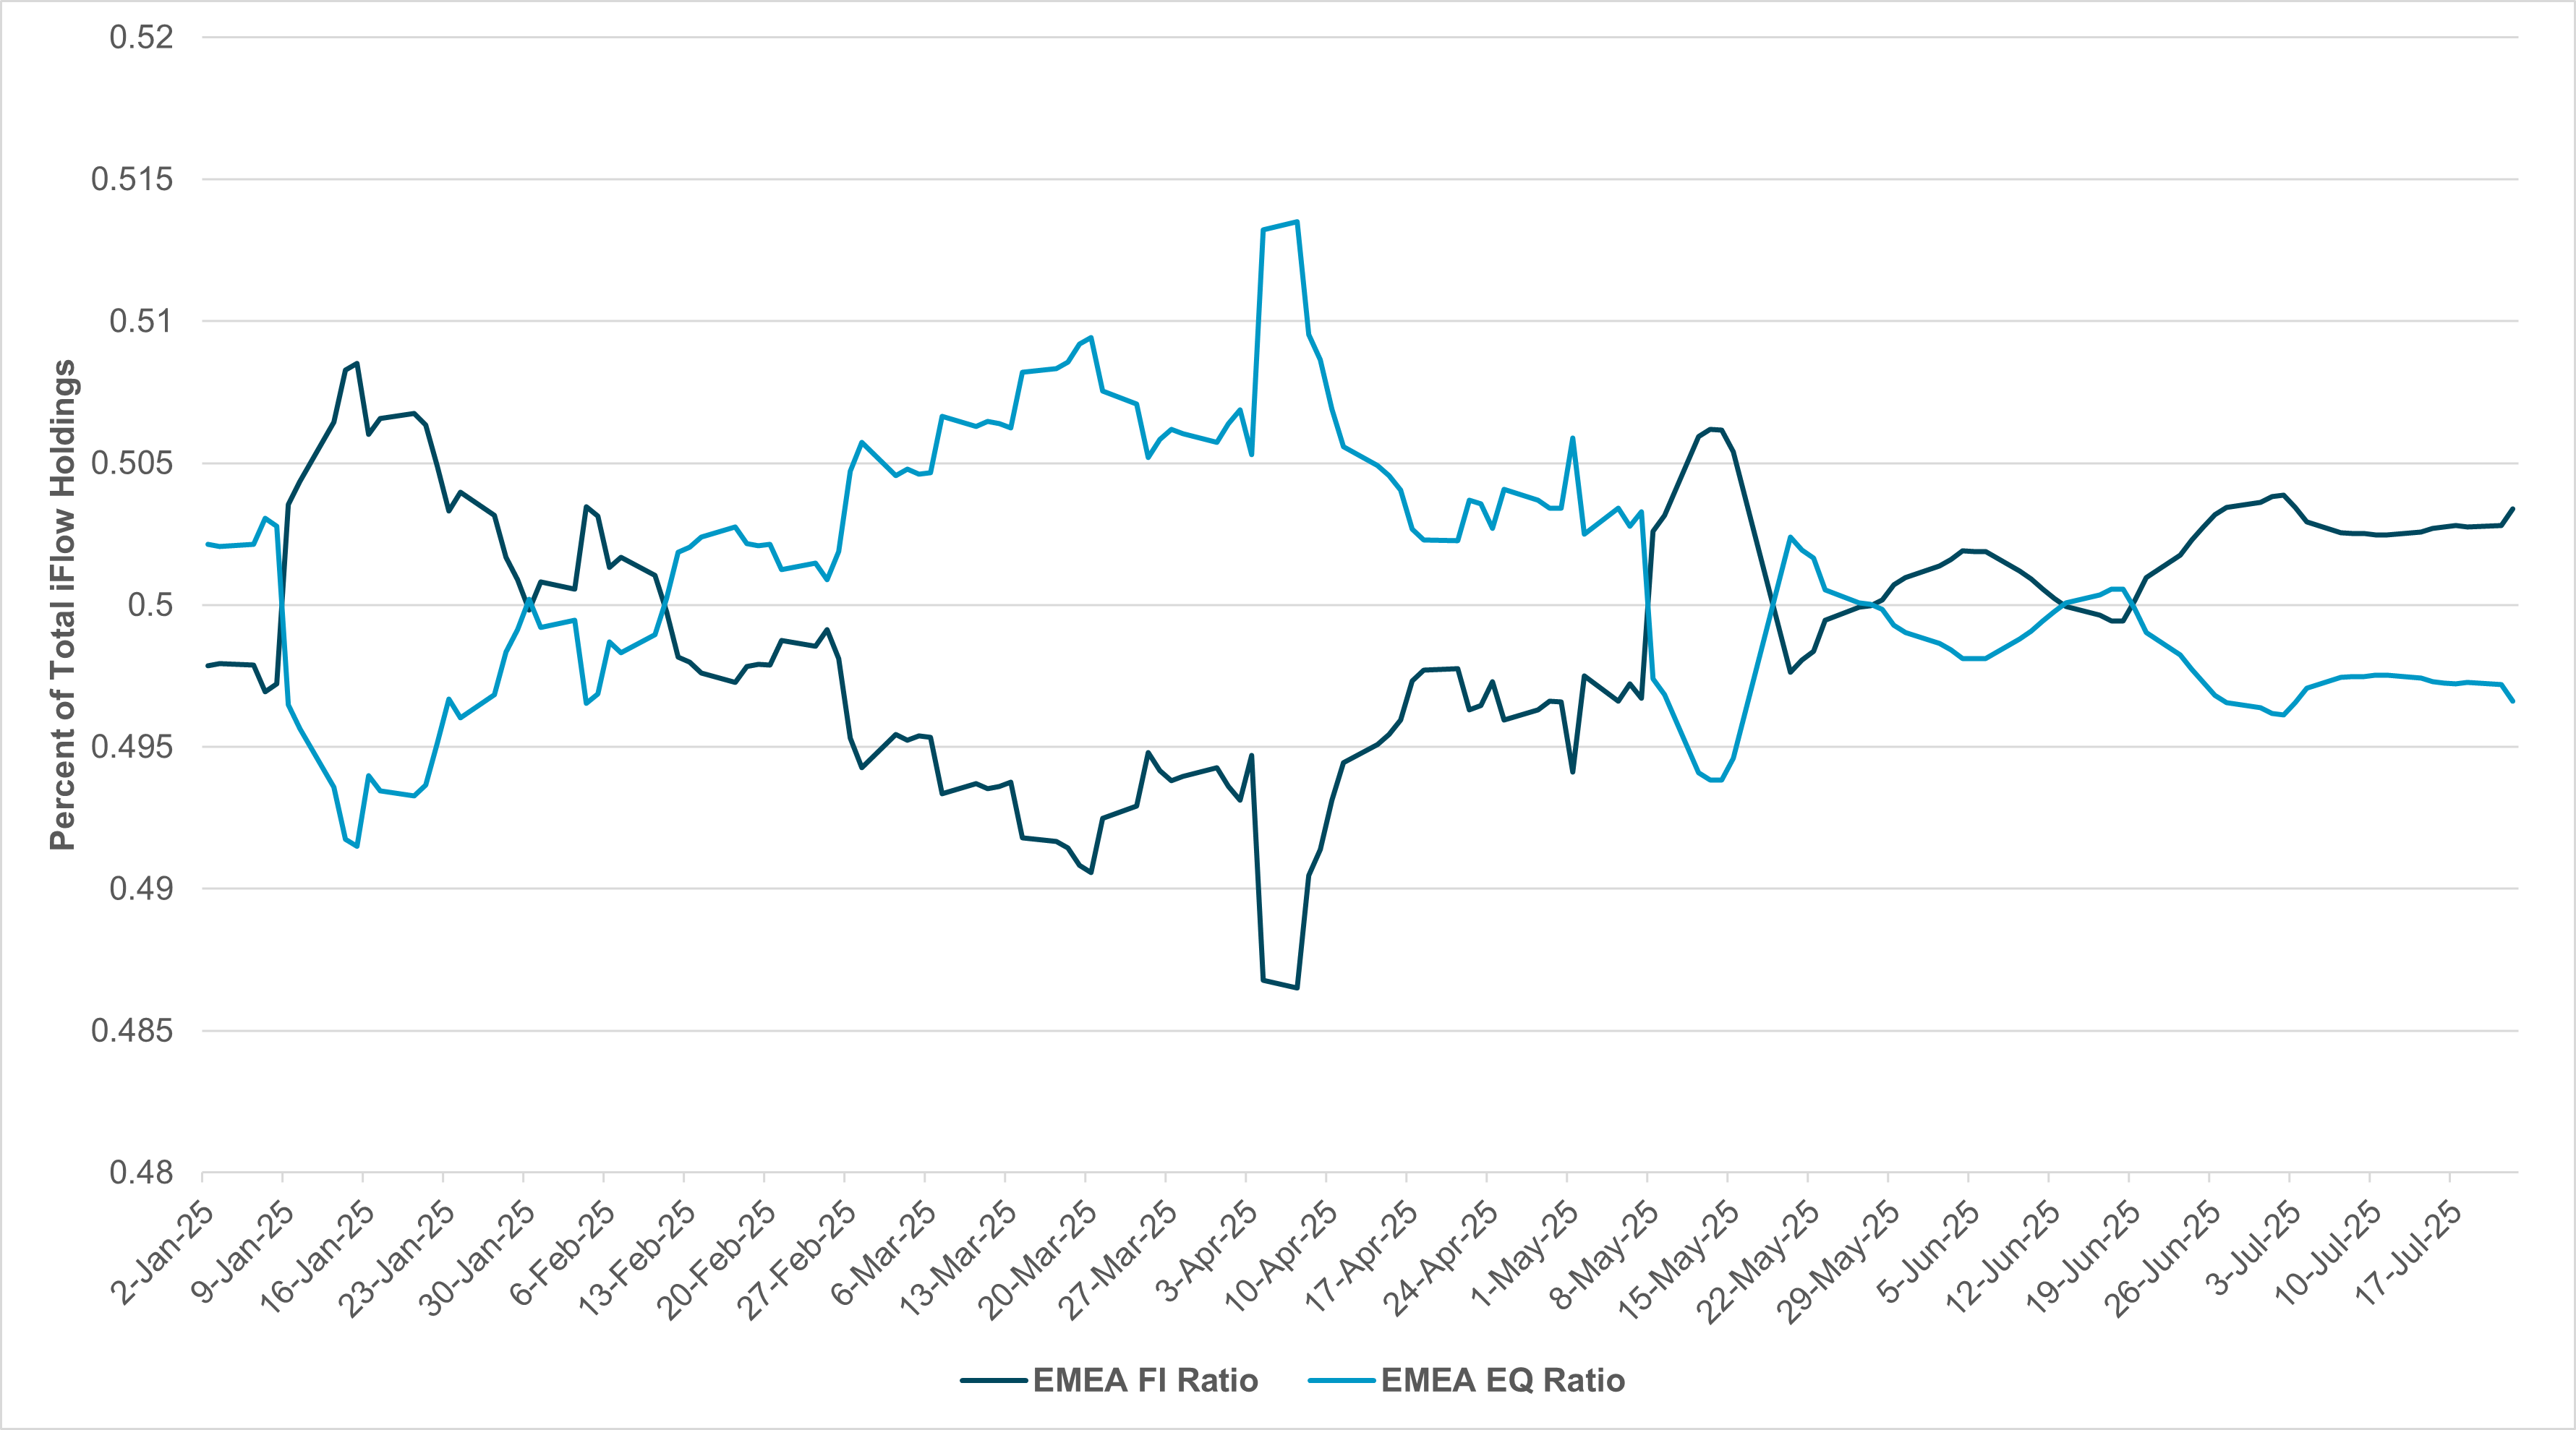
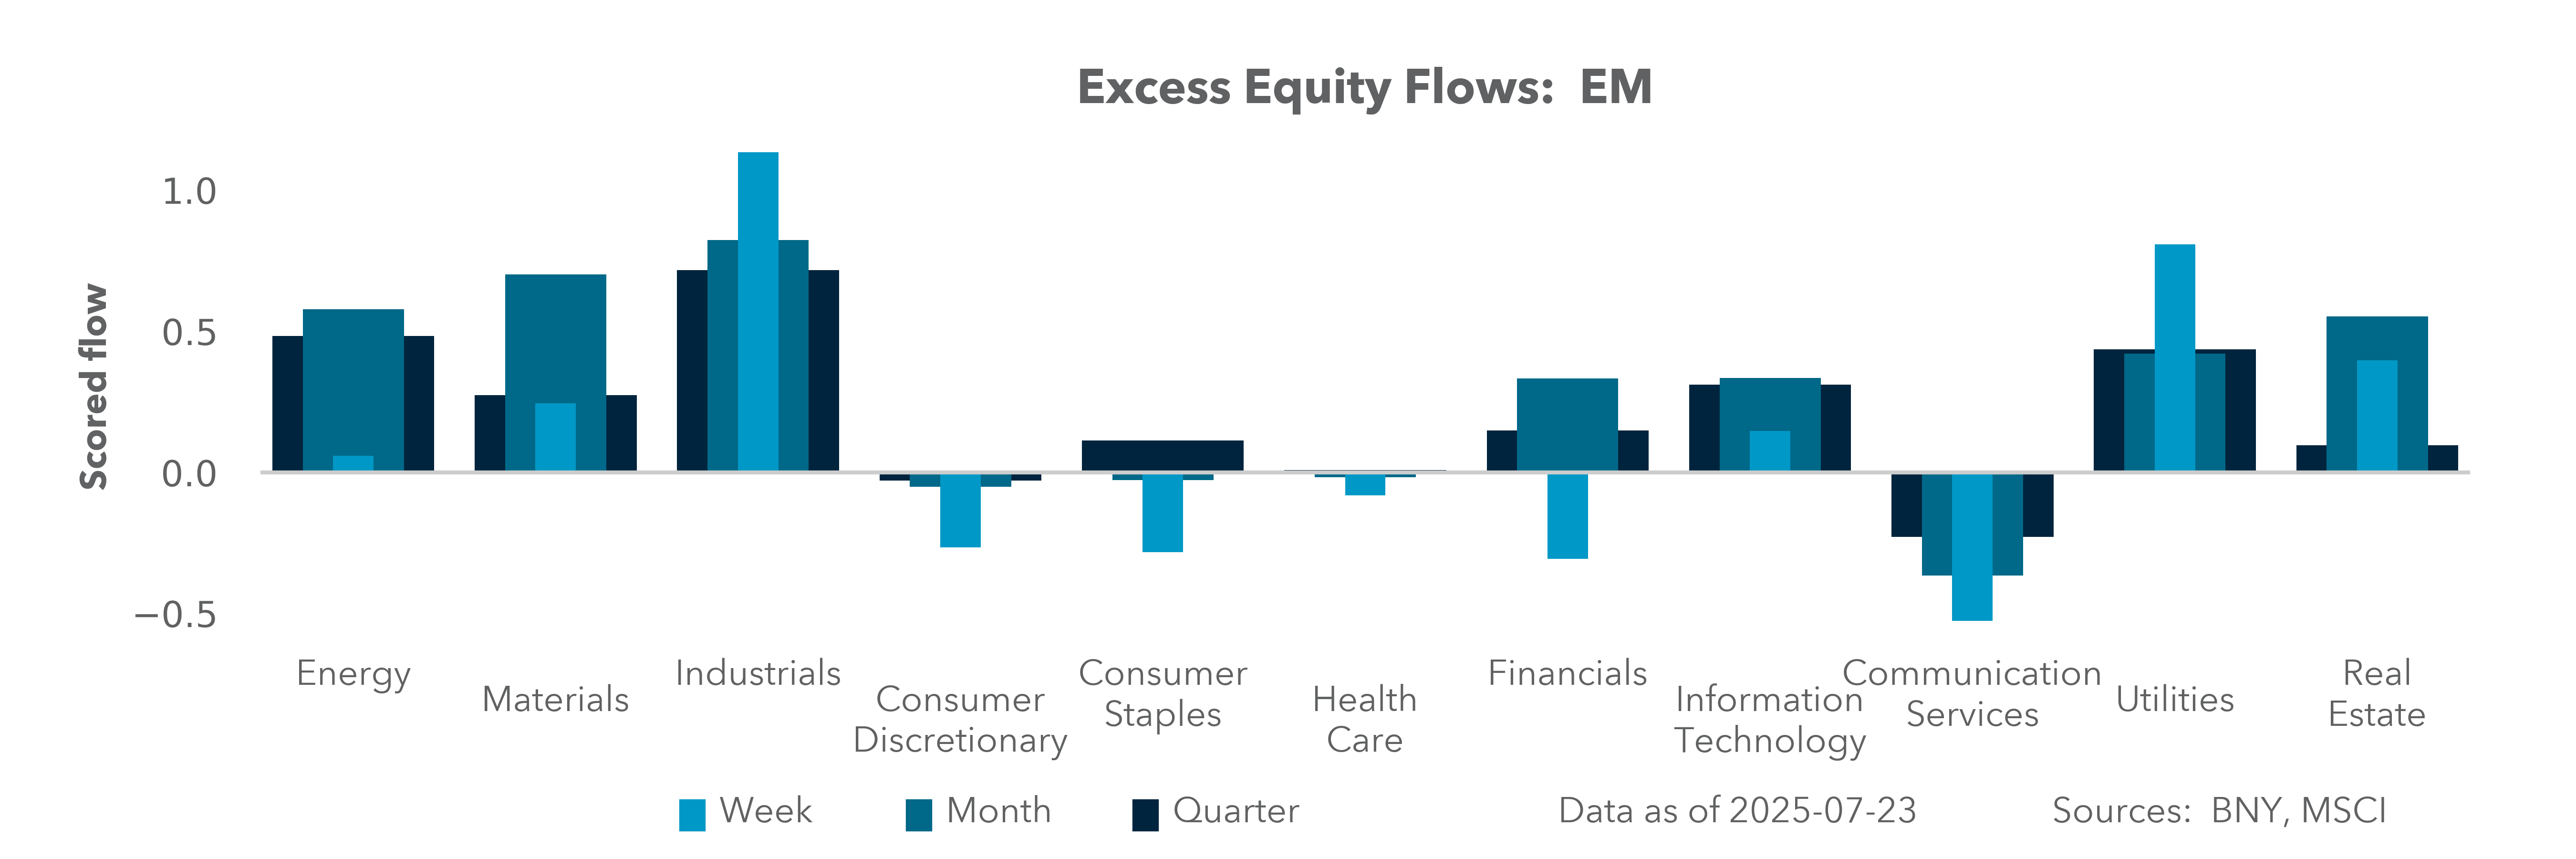
At the beginning of July, the main positioning risk for the U.S. and EU was how tariffs and rates would affect investment plans. Now, halfway through the Q2 earnings season, investor positioning is revealing, as earnings calls reinforce the key themes that were identified earlier:
Europe and the U.S. face different Q2 earnings setups. In the U.S., there is a clear bifurcation between IT longs, which are above their 2024 levels, and Health Care shorts. Looking at the midseason reporting for Europe reveals issues in a number of sectors. As was the case in 2024, there is a perception that Europe is behind on the AI productivity push. The other issue is the usual divergence between misses and beats. European misses in the Materials and Consumer Staples sectors will likely drive some positioning shifts. In contrast, the U.S. Energy and Utilities sectors, in particular, face the prospect of earnings surprises ahead.
Forward look
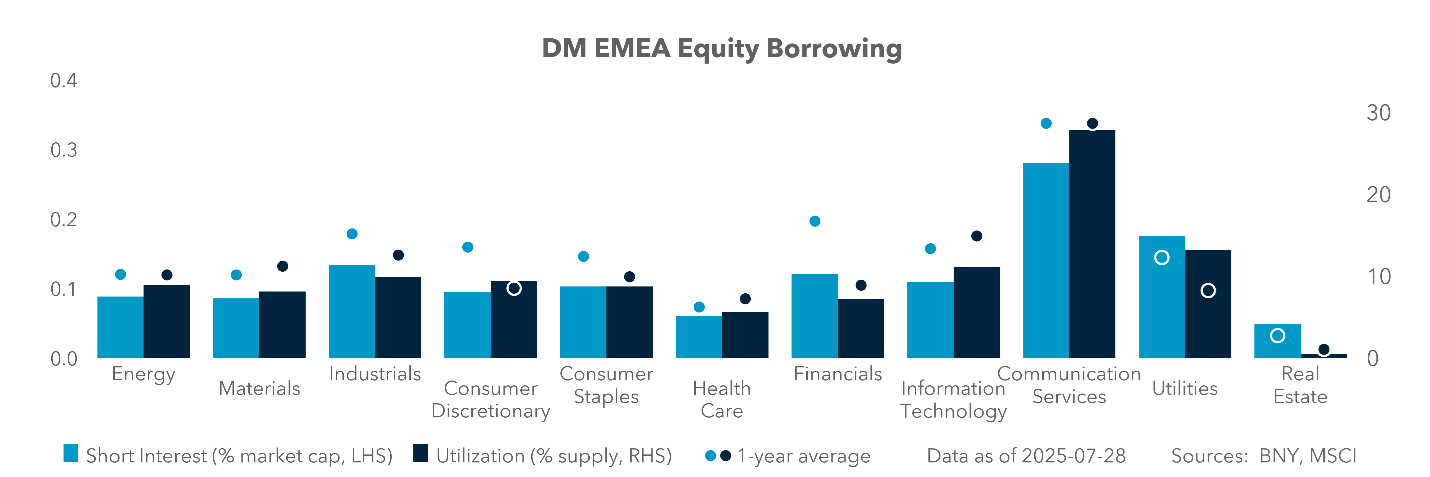
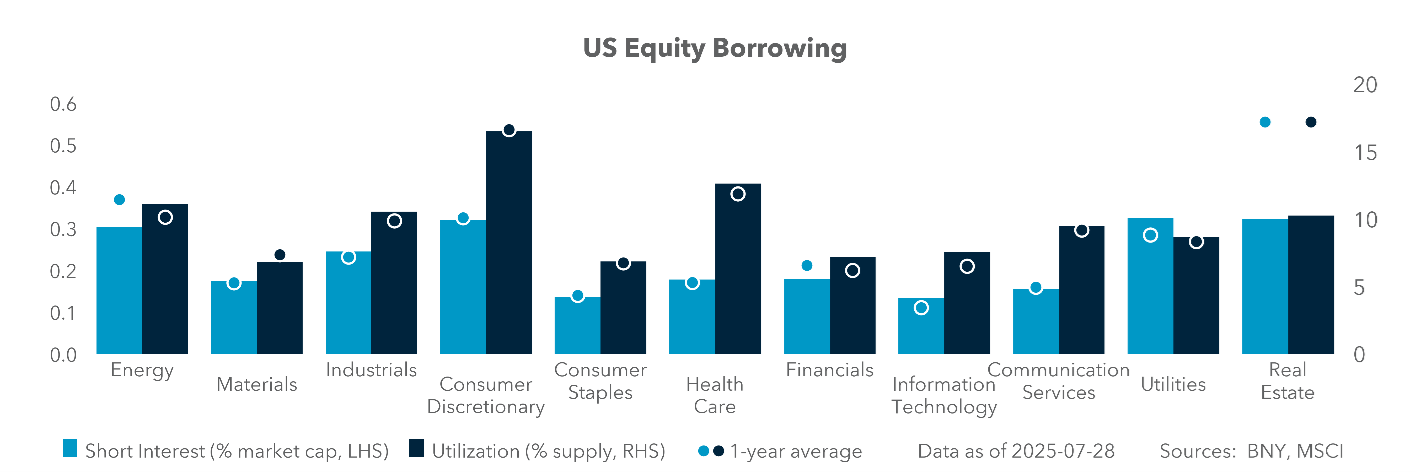
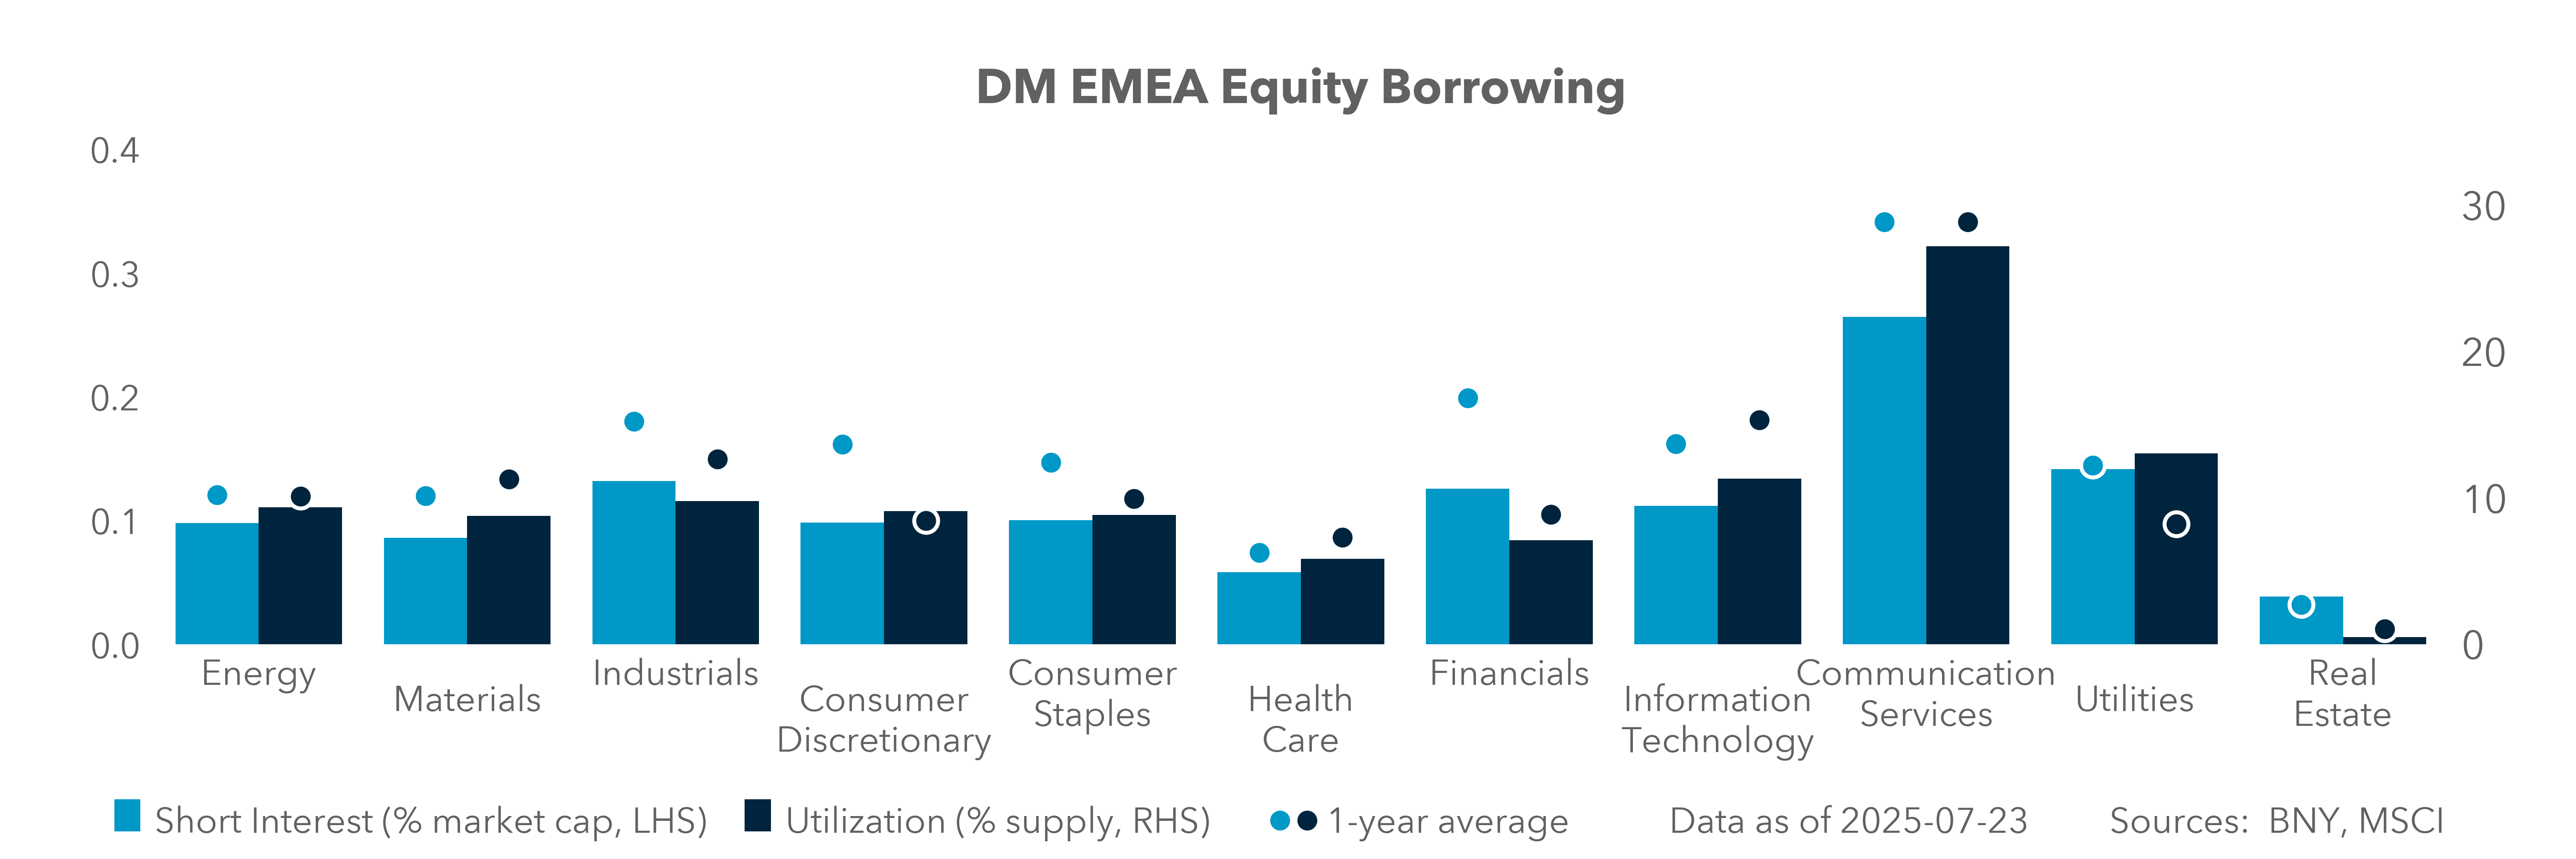
If Q2 U.S. earnings lead to a rotation play to reduce risk, given weaker growth views and fears of tighter margins linked to tariffs, the three sectors with short holdings – Energy, Real Estate and Health Care – are the best place to start. Among these, the short utilization of Health Care makes it the one most likely to see weak results. Real Estate is linked more directly to 30-year rates and mortgage costs, making FOMC policy and fiscal focus key. Views on the direction of the USD and growth rate differentials matter to how stocks trade in EMEA and the U.S. going into year-end. The rebound in the S&P 500 since April to record highs still leaves the index behind the recovery of other global bourses in 2025. This lackluster performance is due in part to the forecasts for 2025–2026 growth. Mexico is expected to see a –1.6% drop in growth vs. the previous 5-year average, while the U.S. is expected to see a decline of –1.3% and Germany just –0.3%. The view that U.S. growth peaked in Q2 increases the market reversal and rotation risks as the underlying trend for GDP looks weaker, with U.S. domestic demand slowing to around 1%.
EXHIBIT #3: EUROPEAN ASSET ALLOCATION OF STOCKS AND BONDS
Source: BNY
*Equal-weighted calculations from France, Germany and the U.K.
Our take
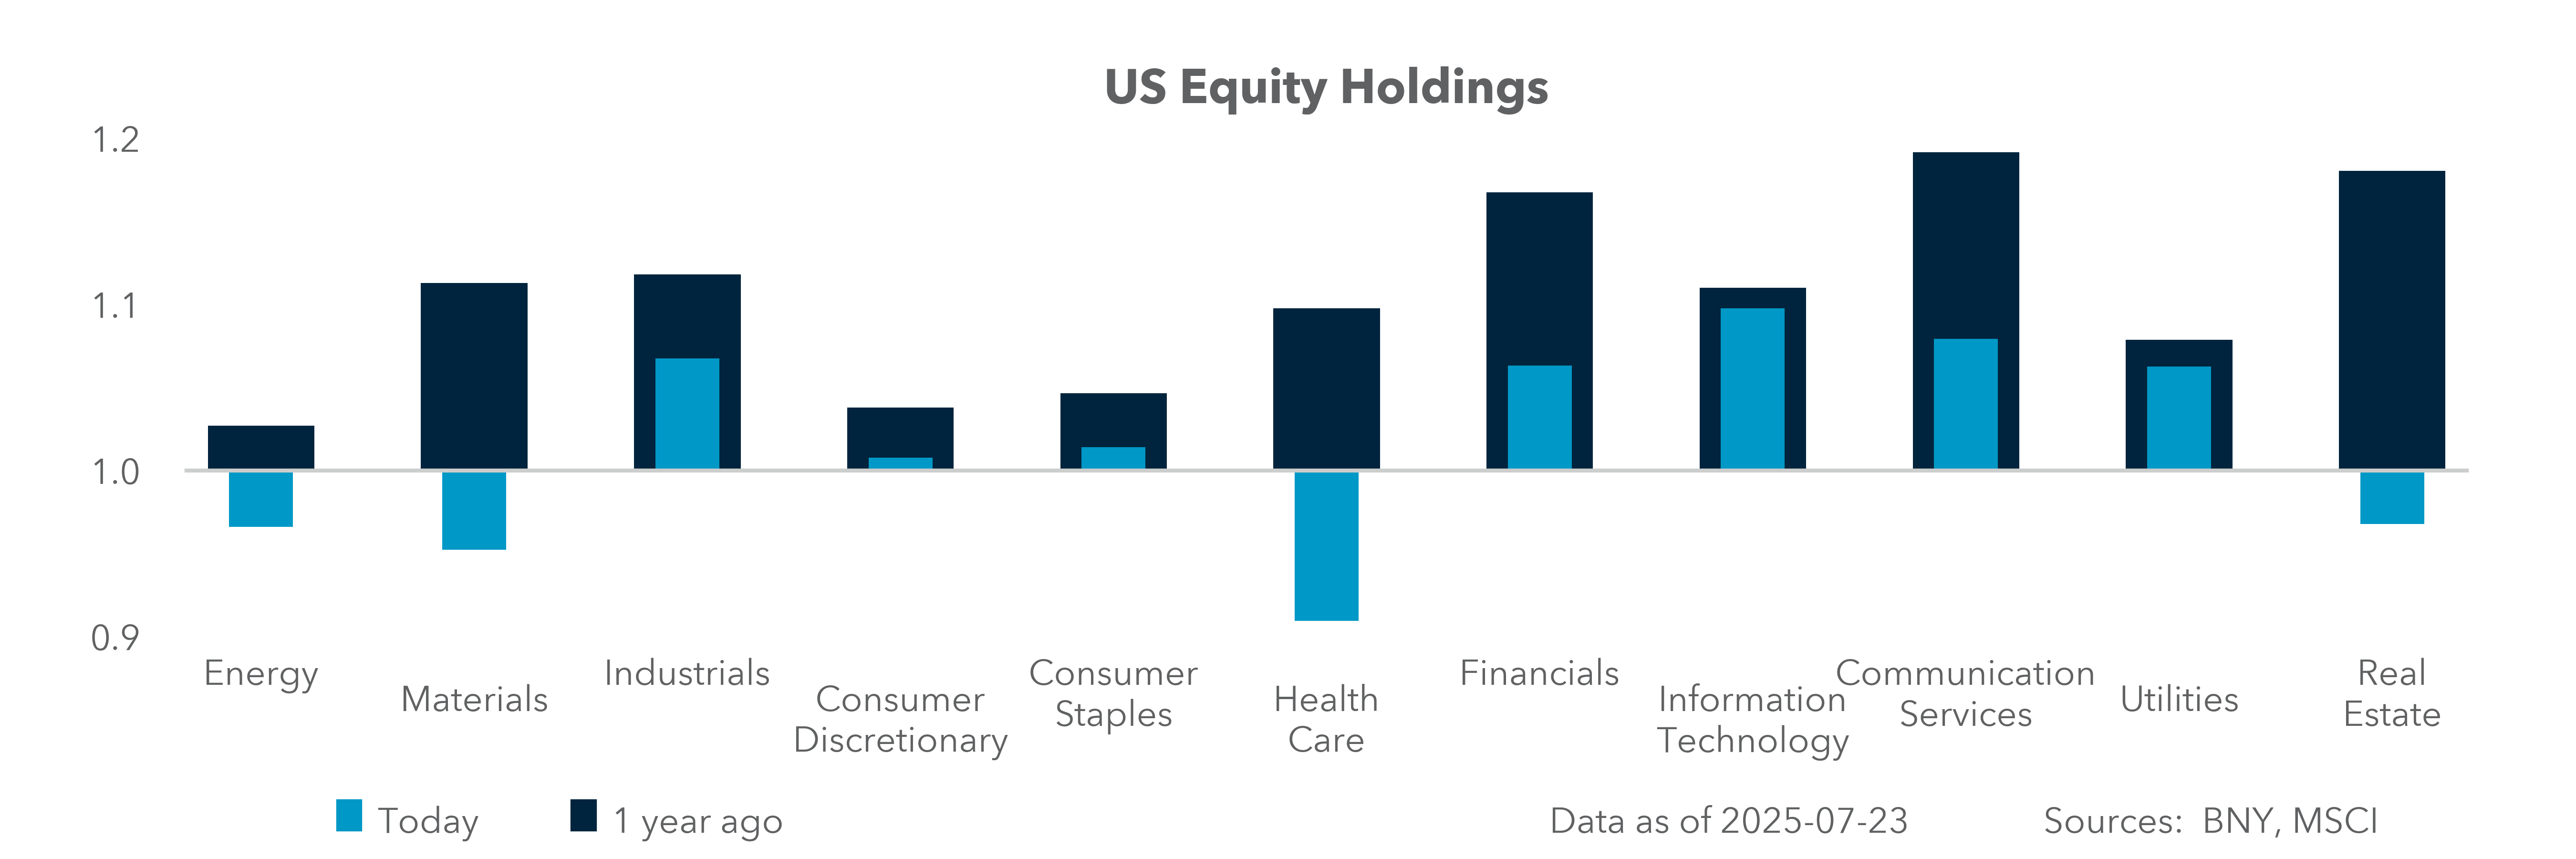
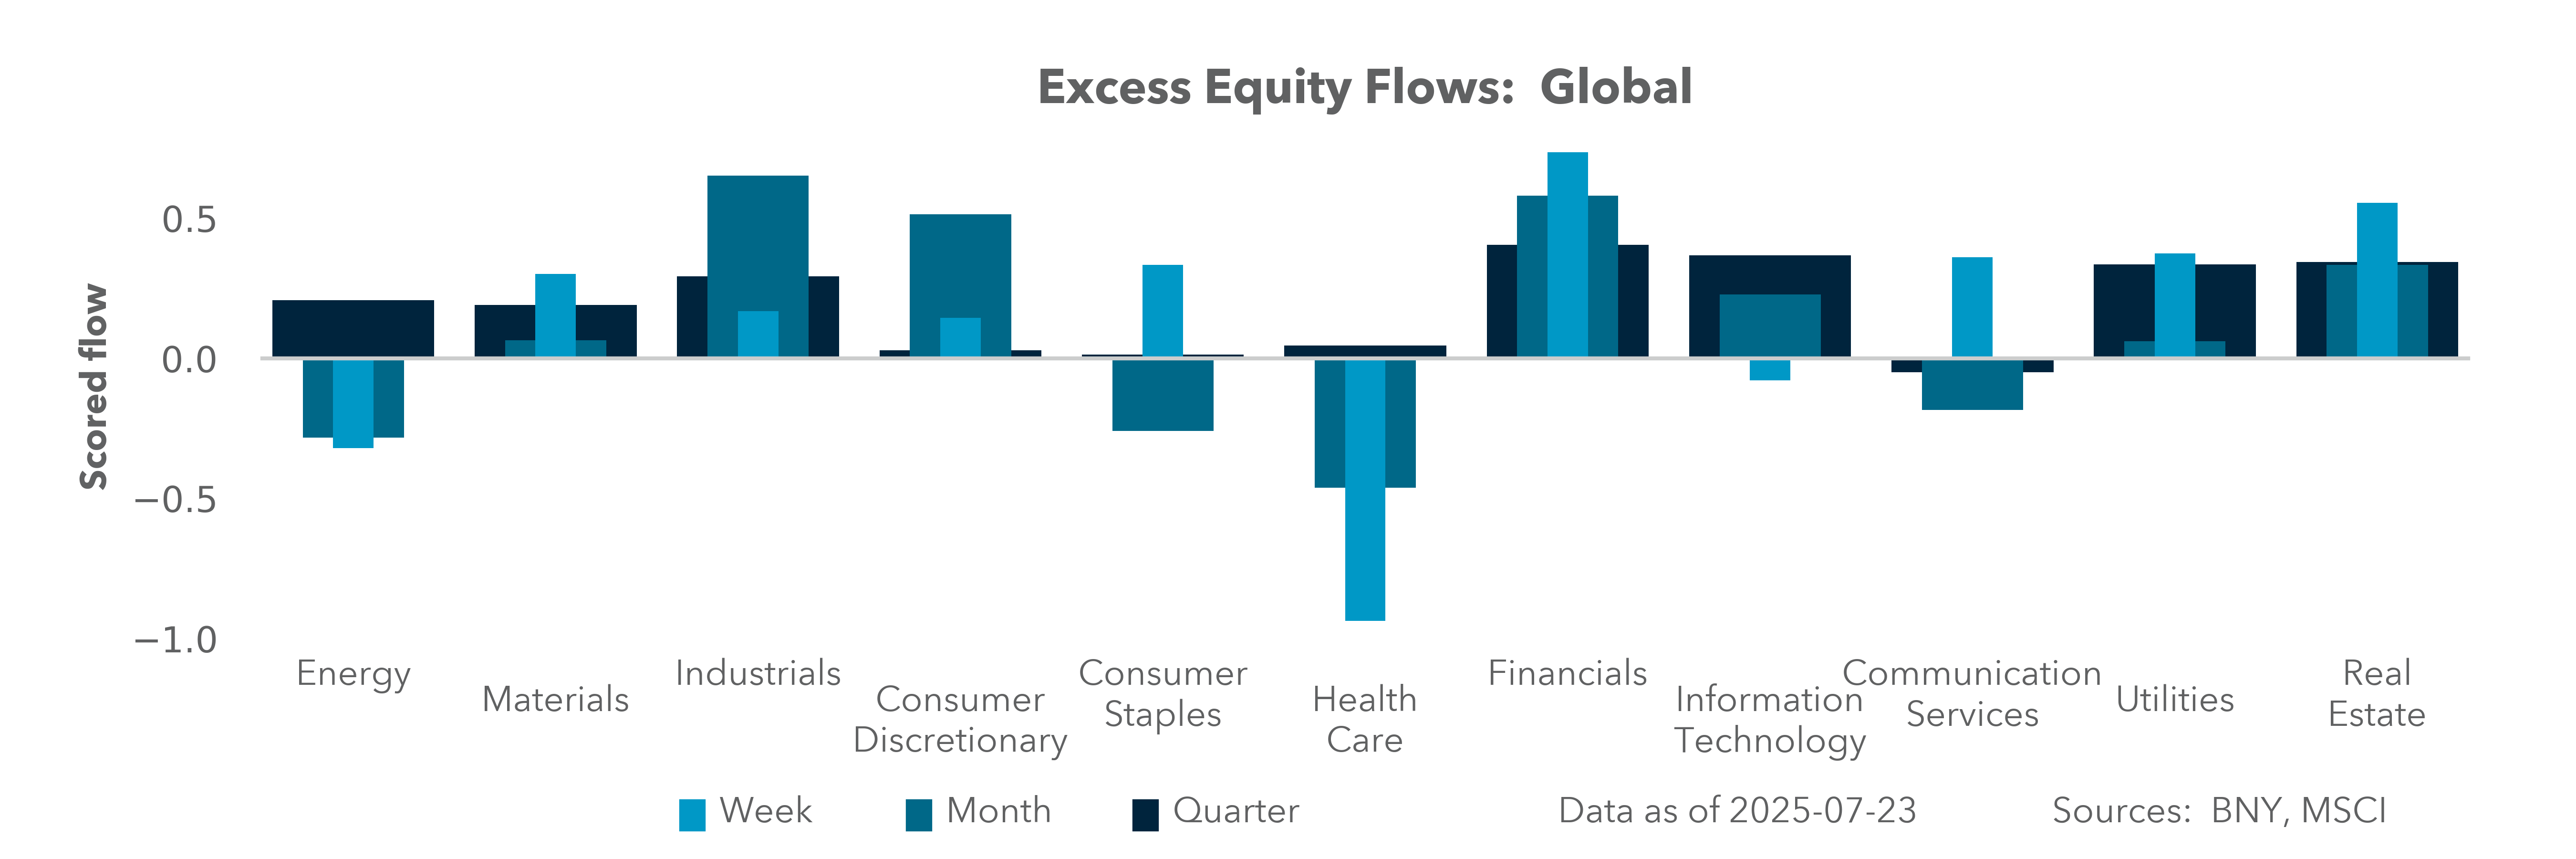
European investors are rational. They bought the dip in shares on “Liberation Day” and sold them into the rally. Holdings in Europe remain significantly above their normal levels in many sectors, but bonds are back to over 50% of our iFlow mixed portfolios. This asset allocation suggests that investors are set up to buy the dip again should one occur on the back of earnings in either the U.S. or the EU. The price action of the EuroStoxx 600 supports this argument. EU investors are also cautious about extending their holdings on the home front given the ECB cycle and the level of the EUR, with many seeing 1.1250 as the Rubicon. This leaves U.S. and APAC equity markets as prime targets for further growth, but with the caveat that much depends on FX and interest rates.
Forward look
The USD and interest rate levels are important parts of the equation, making future Fed and ECB policy key for hedging decisions. It will take more than the current earnings beats for U.S. exceptionalism to stage a comeback. The FOMC’s rate path and its likely divergence from the ECB in the quarters ahead will add to pressures for further hedging. The cost of hedging back to EUR being reduced adds to the headwinds for EU growth and helps support the U.S. with a weaker USD. The full impact of tariffs and how they affect sector costs remains essential for bond and stock allocations in EU and U.S. markets. The question for investors is: Is this time different, or will the well-worn adage that Europeans invest for return of capital while Americans focus on return on capital hold true?
The long-term concern about S&P 500 outperformance lies in the margins. Just a handful of stocks led the 12.3% blended rate. The inverse of revenue-earnings at 8.1 suggests we are in the 5th percentile, close to historic low payouts for growth, with only 2021 coming in lower at 7.9. All this increases the risk of harder times ahead. Note also that in 2001 recession margins fell below 4% and the ratio rose to over 25. Even with the certainty of big trading deals by the Trump administration, tariffs remain a key uncertainty, with calls highlighting cost of capital concerns, supply-chain shifts and AI adoption – cited by around 40% of CEOs as central to productivity. There is a time limit for the AI surge linked to the ability of the other 493 shares outside the Magnificent 7 showing higher productivity. The hope for Q3 is that the balance of return on investments in AI bleeds into the majority of the S&P 500. iFlow data indicate heavy European equity positioning, while the U.S. is near normal, making it clear that EU shares are more at risk of a rotation. Despite the S&P 500’s rebound since April, it is still lags behind broader global indices in 2025, particularly as 2025–2026 growth forecasts project Mexico at –1.6%, the U.S. at –1.3% and Germany at –0.3%. Downside misses are currently prompting sharper price reactions than beats, increasing the risk of rotation if U.S. growth weakens further or the EU recovery stalls. Energy, Real Estate and Health Care remain among the prime targets.