End of Summer Risks
iFlow > Equities
An in-depth look each Friday at the factors shaping equities markets in developed and emerging economies around the world.
iFlow > Equities
An in-depth look each Friday at the factors shaping equities markets in developed and emerging economies around the world.

Bob Savage
Time to Read: 4 minutes
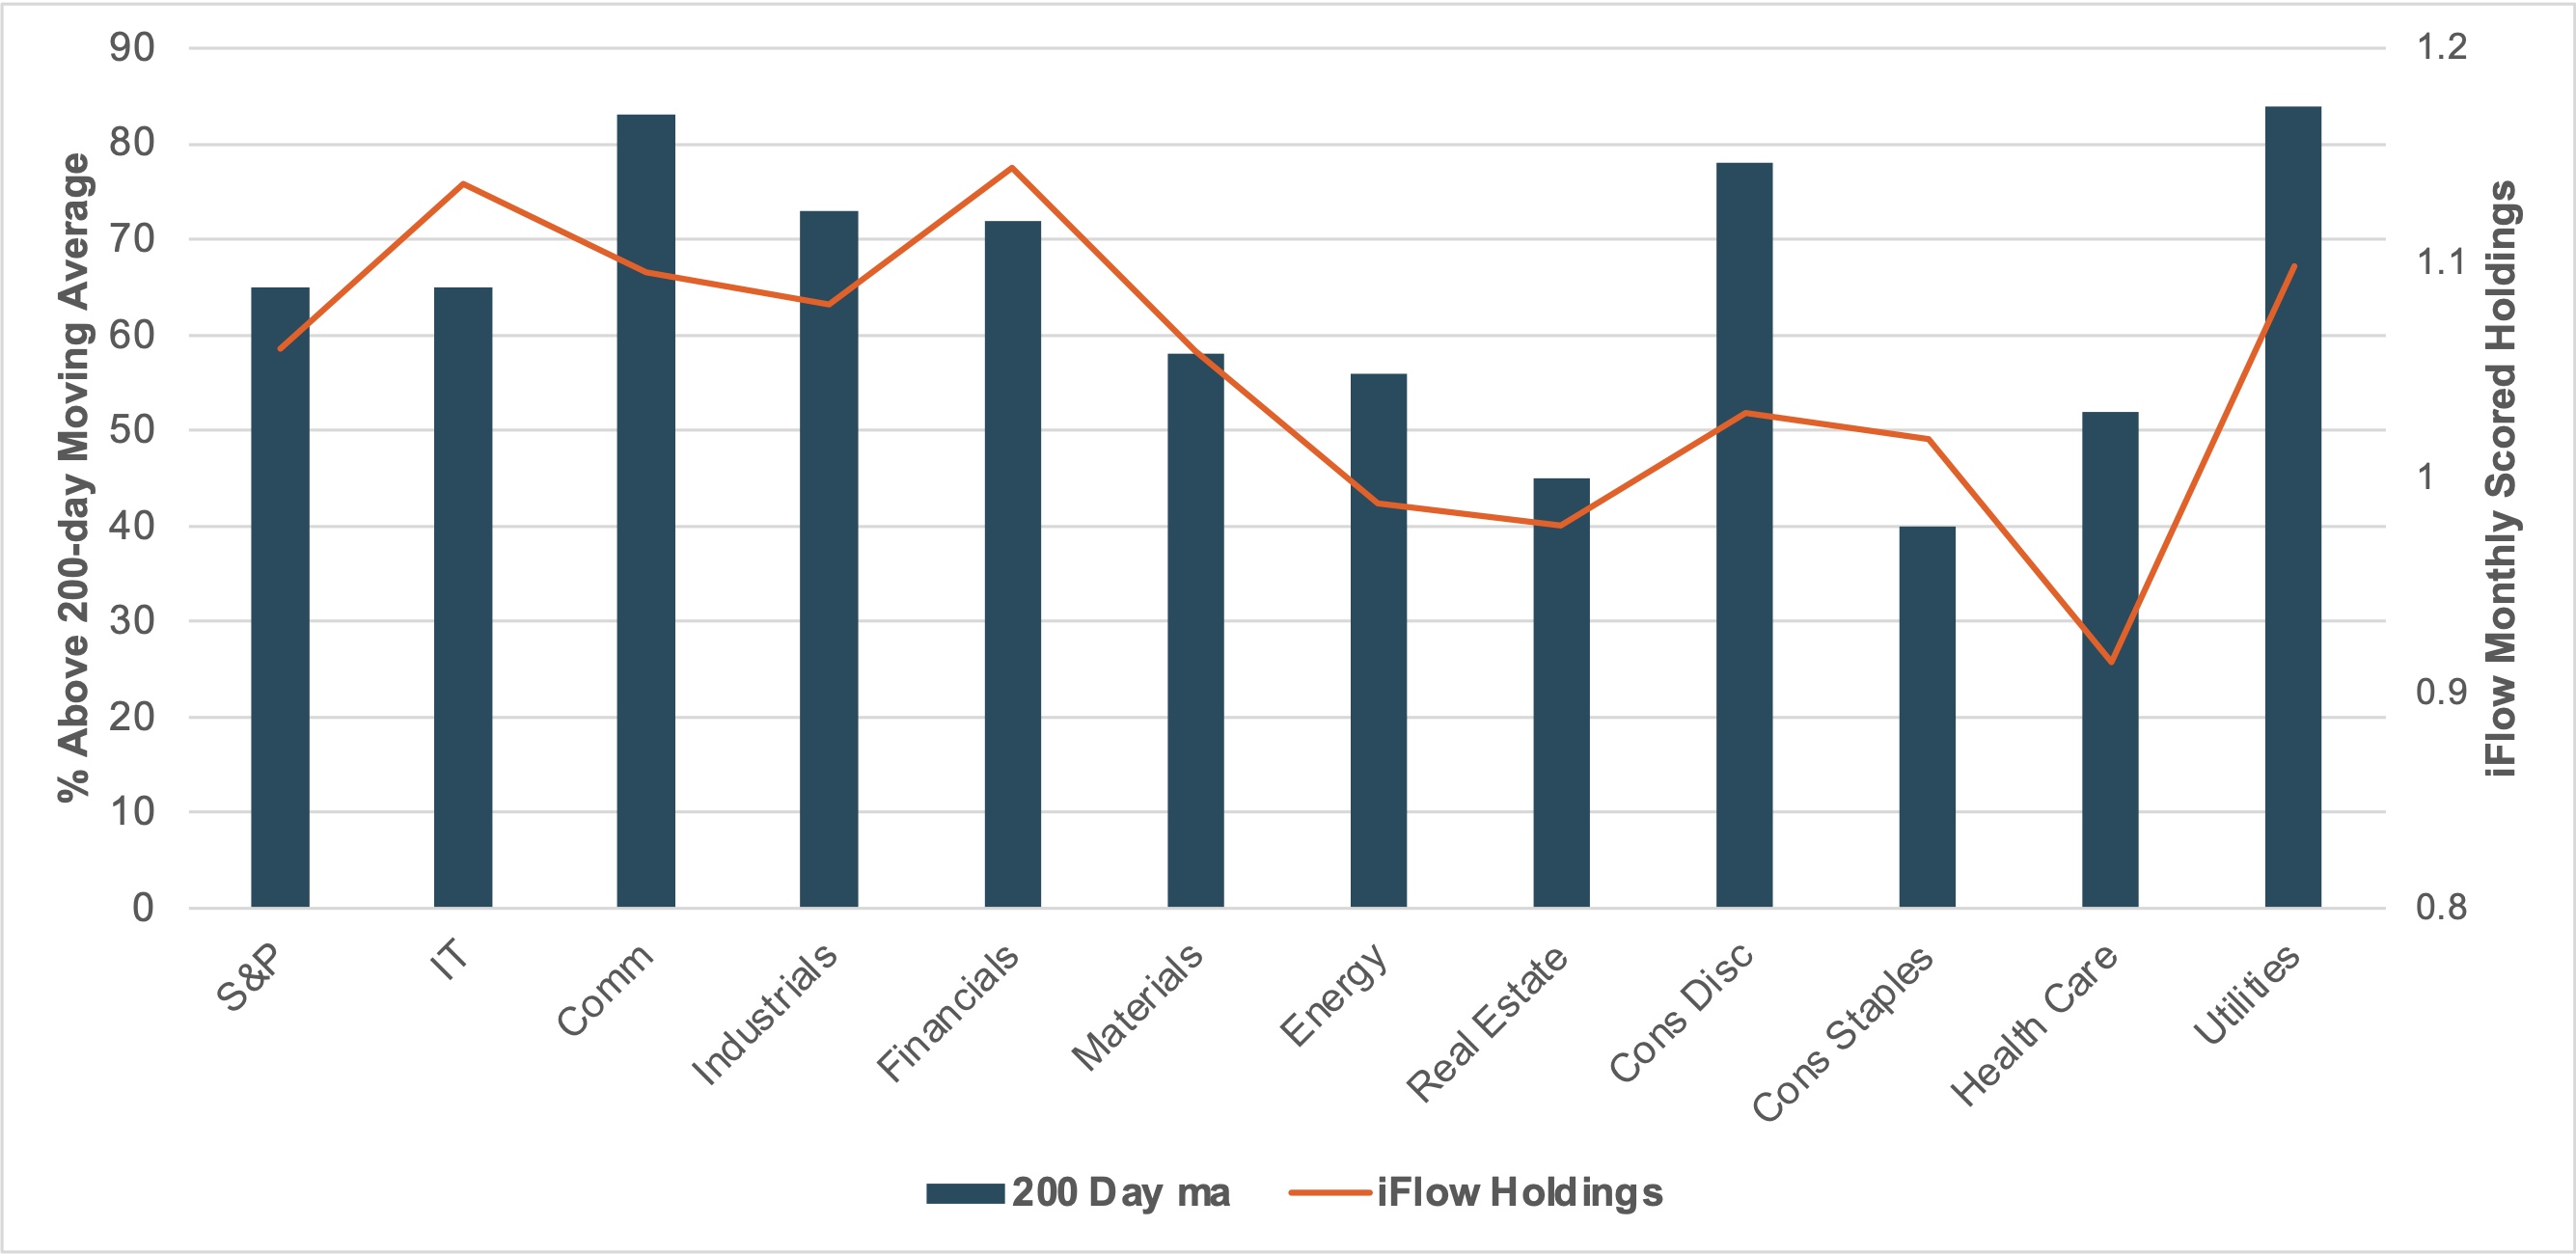
EXHIBIT #1: S&P 500 SECTOR PERCENT OF COMPANIES OVER 200 DAYS VS. IFLOW HOLDINGS
Source: BNY, S&P Global
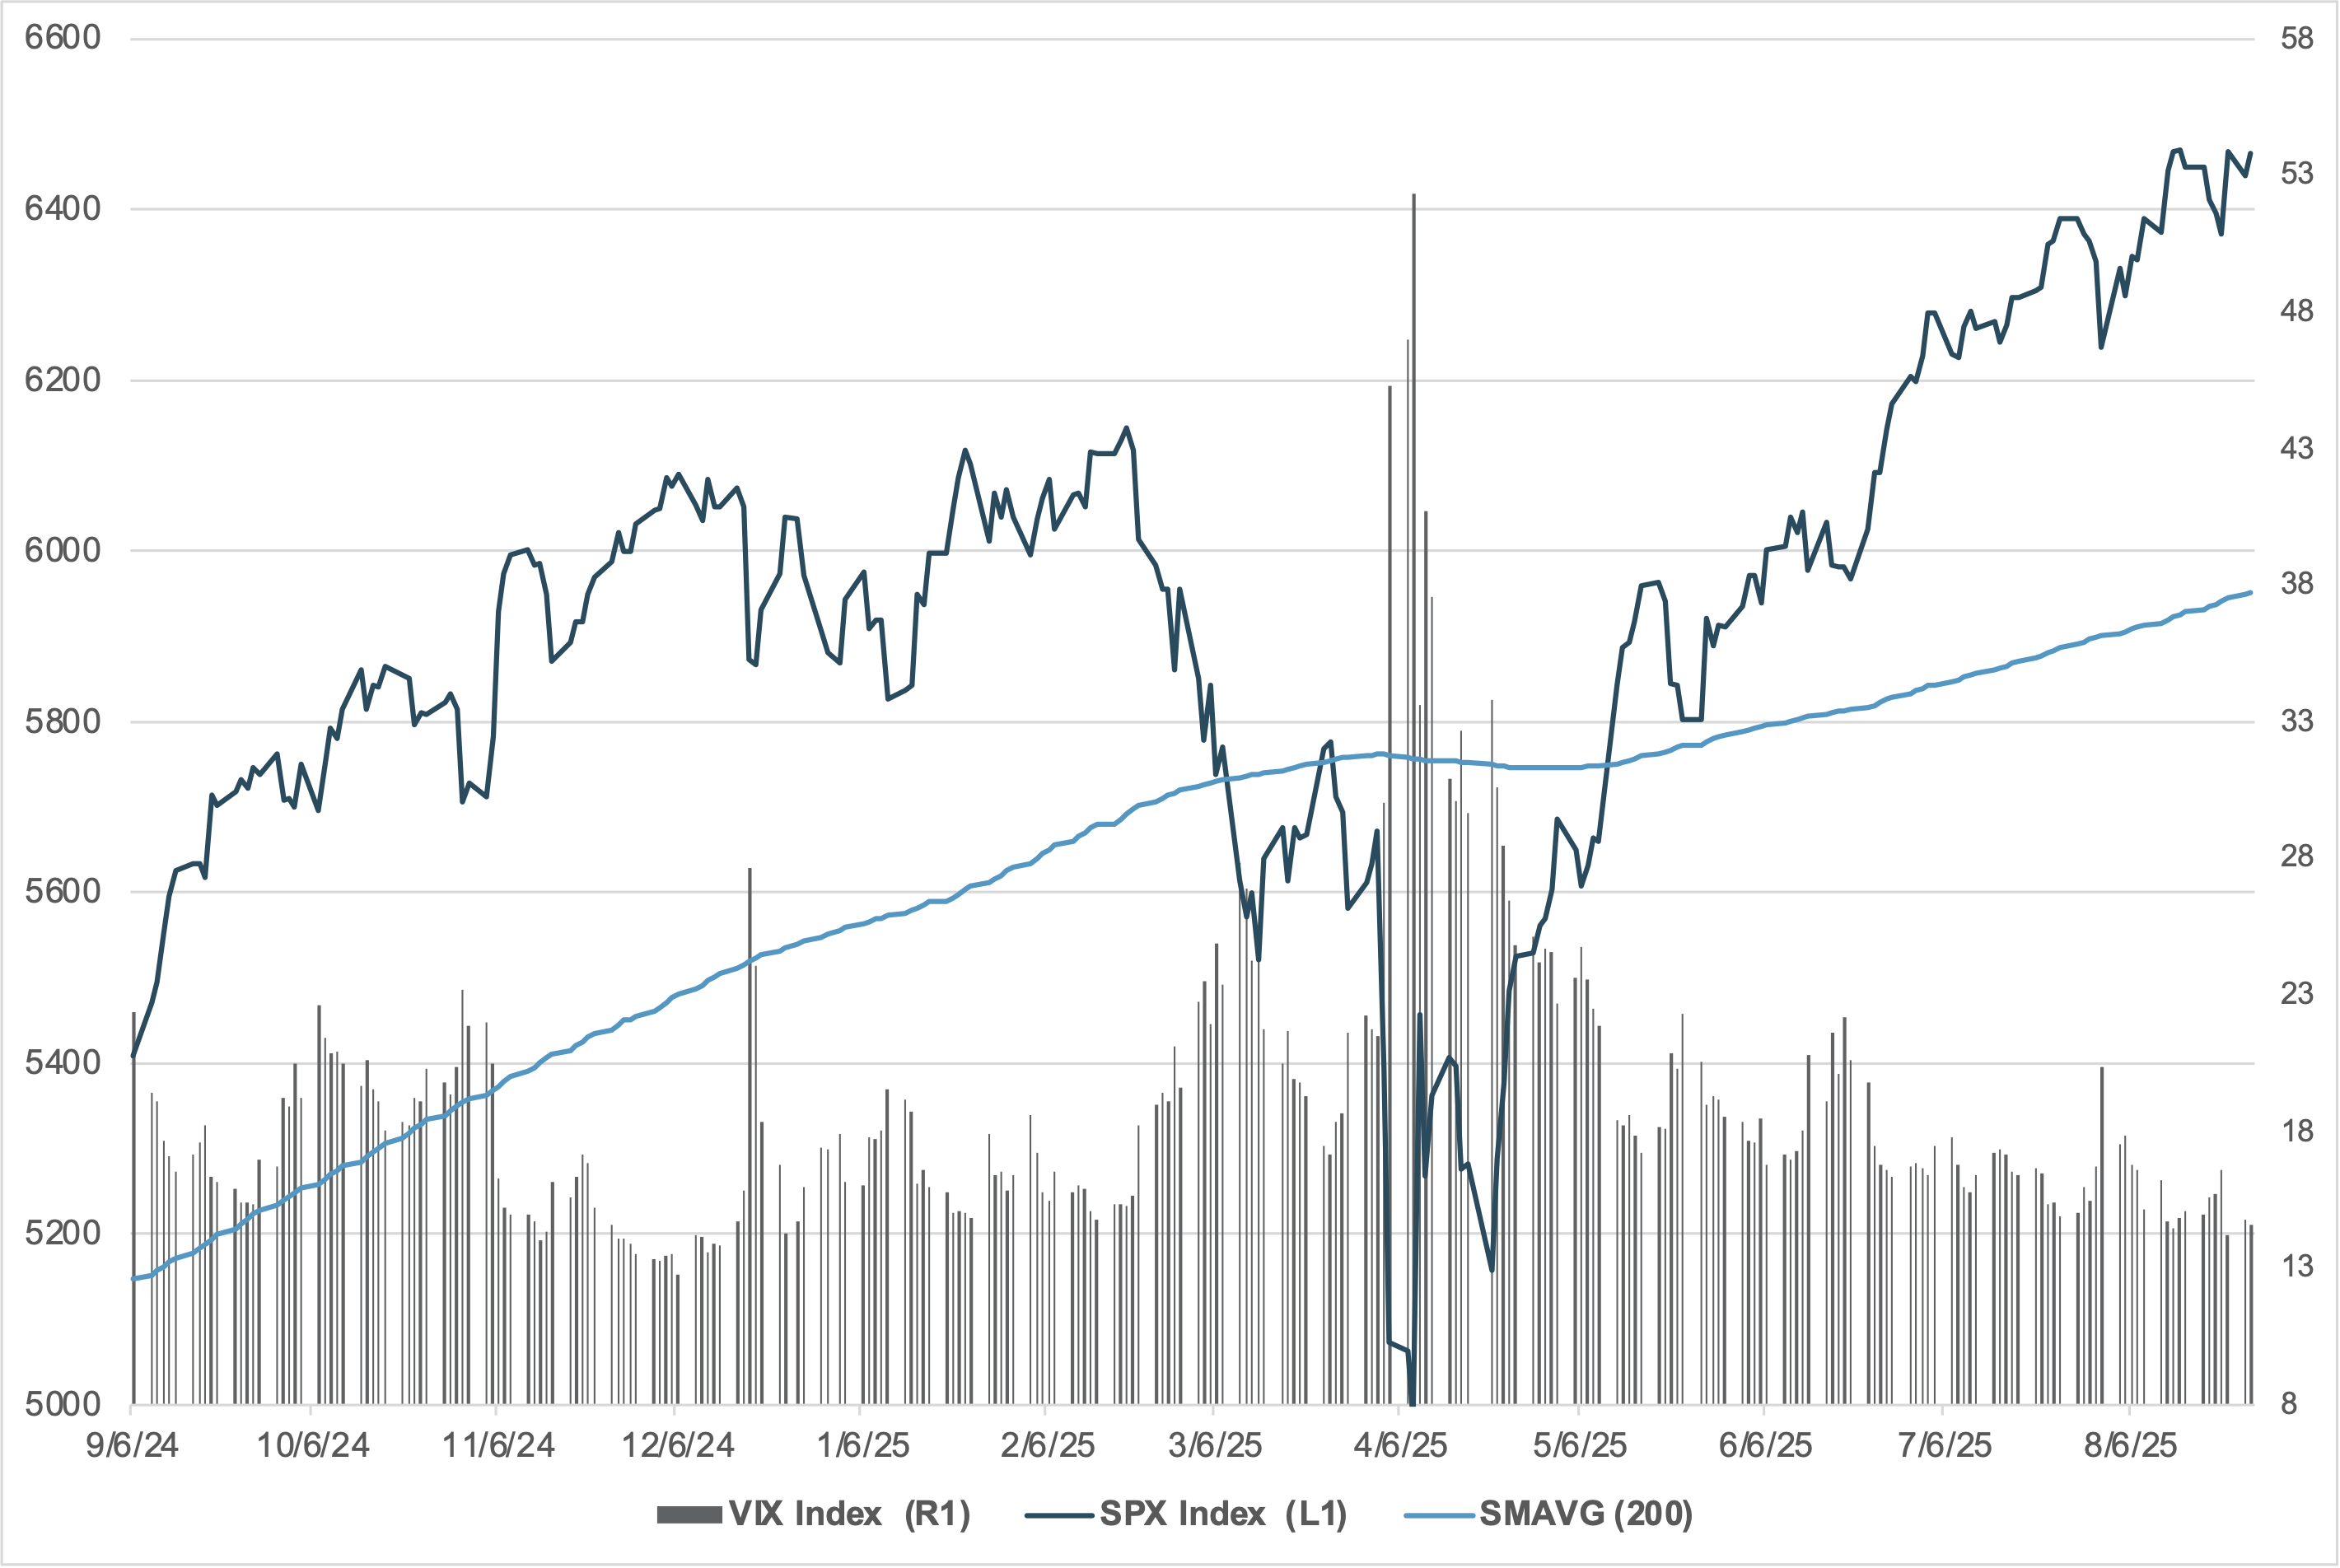
EXHIBIT #2: U.S. S&P 500 AND 200-DAY MOVING AVERAGE
Source: BNY, Bloomberg
The summer trading session ends with a bang, not a whimper. The April low for the number of S&P 500 companies trading above their 200-day average was 19%, which rebounded to 58% in July and rose to 65% last week. The rotation trade among U.S. investors revolves around Nvidia, which reported outsized earnings again. The technology giant’s market cap accounts for nearly 8% of the entire index, underscoring concentration risk. However, the broad market rally over the summer suggests some divergence in risk and adds to hopes of resiliency ahead. The greater concern for investors is that the VIX remains below 15, suggesting complacency toward risk heading into September, a historically difficult month for equities. The other key driver of risk sentiment is the Federal Reserve and expectations for a rate cut, which helped fuel the August rally back in risk assets. Economic data in the coming week, from ISM surveys to the jobs report, will set the tone for shifting expectations regarding monetary policy easing. The correlation between lower rates and higher equities holds, as seen in the September 2024 rally. However, a hawkish cut remains the current consensus.
Our take
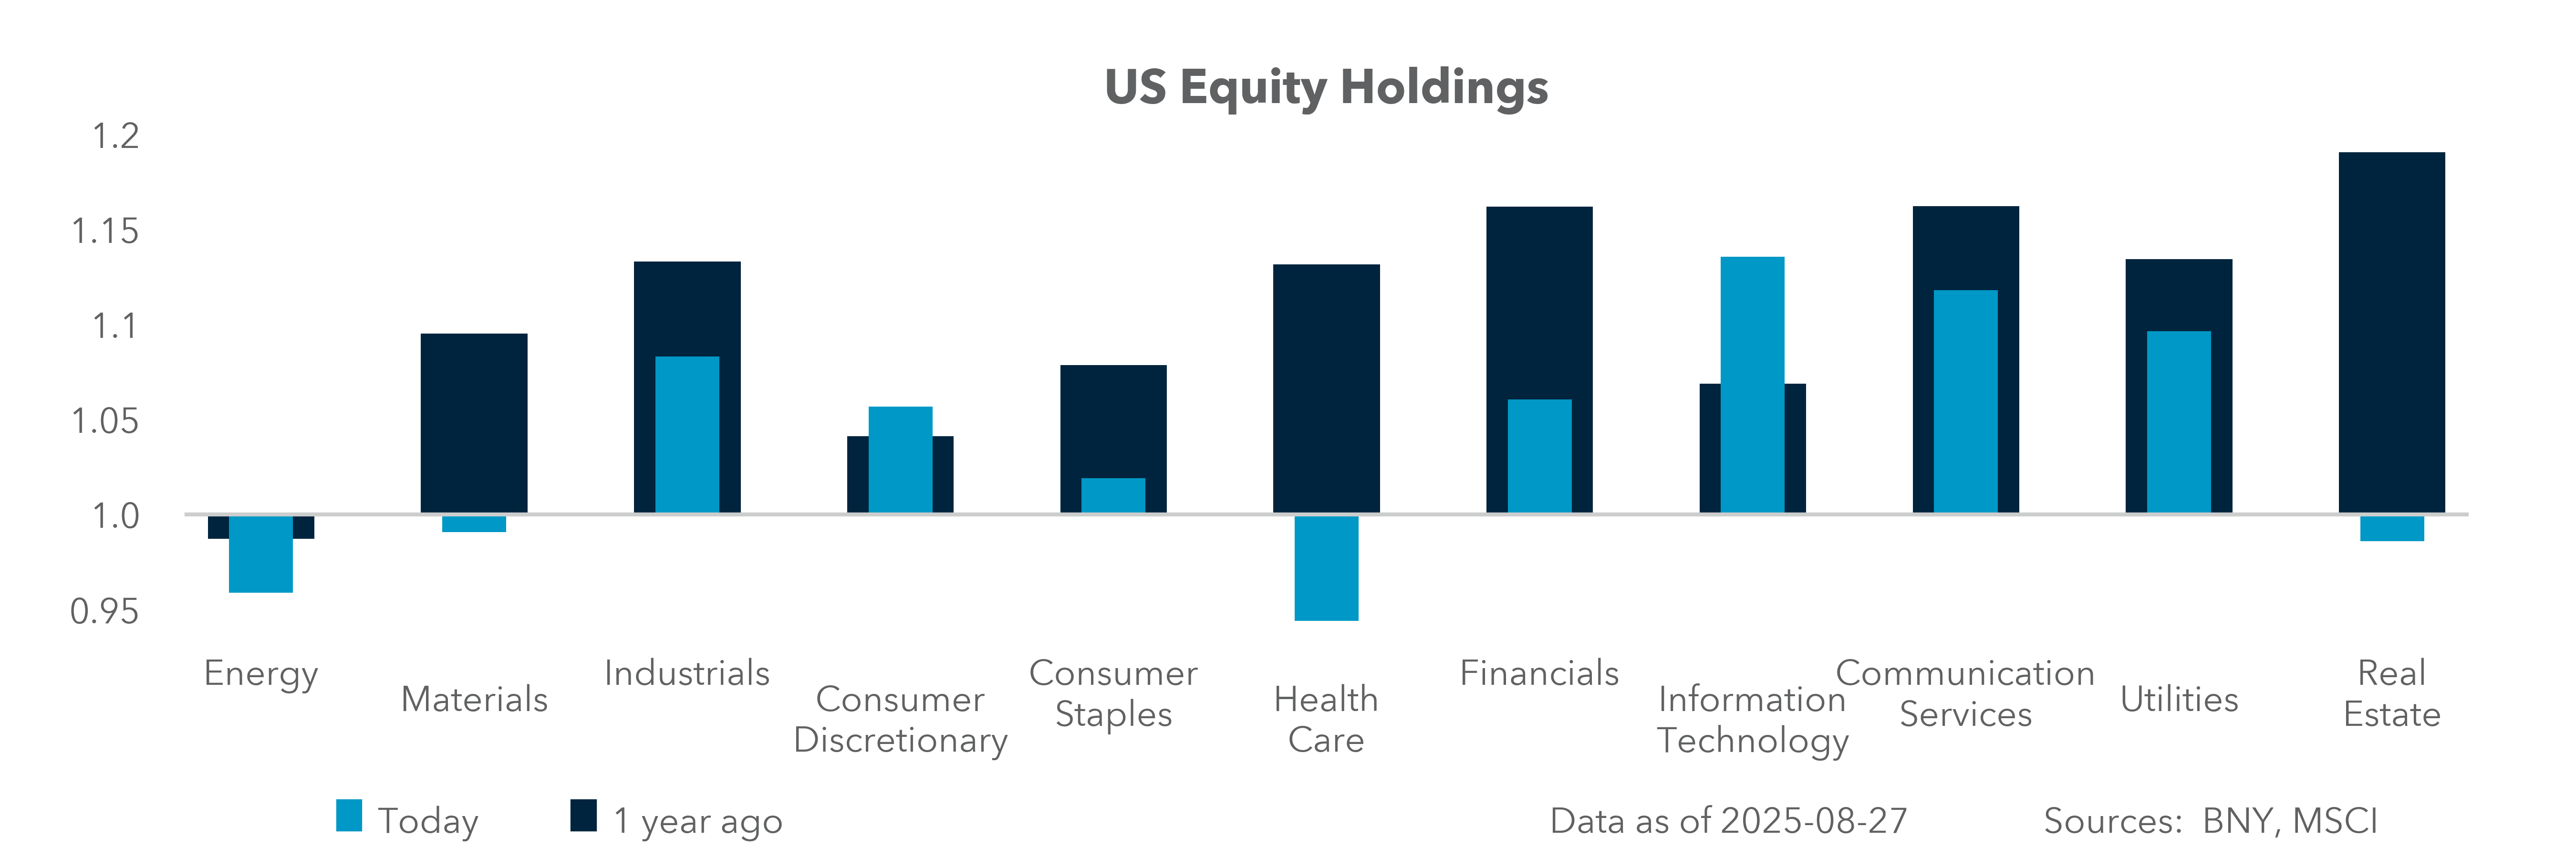
The concentration risk for U.S. equity markets has been a consistent fear. The chart shows that improved market breadth has alleviated some of these concerns, with only two sectors having fewer than 50% of constituents trading above the 200-day moving average. Further, iFlow data suggest there is room for additional performance gains. Health Care, Real Estate and Energy underheld against their long-term averages, while Materials, Consumer Discretionary and Consumer Staples are in line with their one-year average holdings. Overall, U.S. holdings in iFlow remain at a modest 4% above the long-term average and slightly below last year’s average. Further rotational investment may occur if the FOMC eases rates in September.
Forward look
The “Sell America” trade that was part of the April market correction took a summer vacation. The rally back in U.S. assets has been notable and led by the IT sector. Nvidia rallied 84% from the April lows. However, selling of U.S. assets by cross-border investors is not solely about trade tariffs or the Trump administration. The risk for greater home bias across the global investment world reflects increasing global political polarization and market fragmentation. The current mix of U.S. holdings is above the two-year average for cross-border investors and suggests a higher bar for September performance to sustain momentum. Jobs data and inflation will influence whether the Fed cuts rates, while the ongoing debate over the terminal rate for Fed Funds 2% or 3% will also shape the timing of the next equity correction.
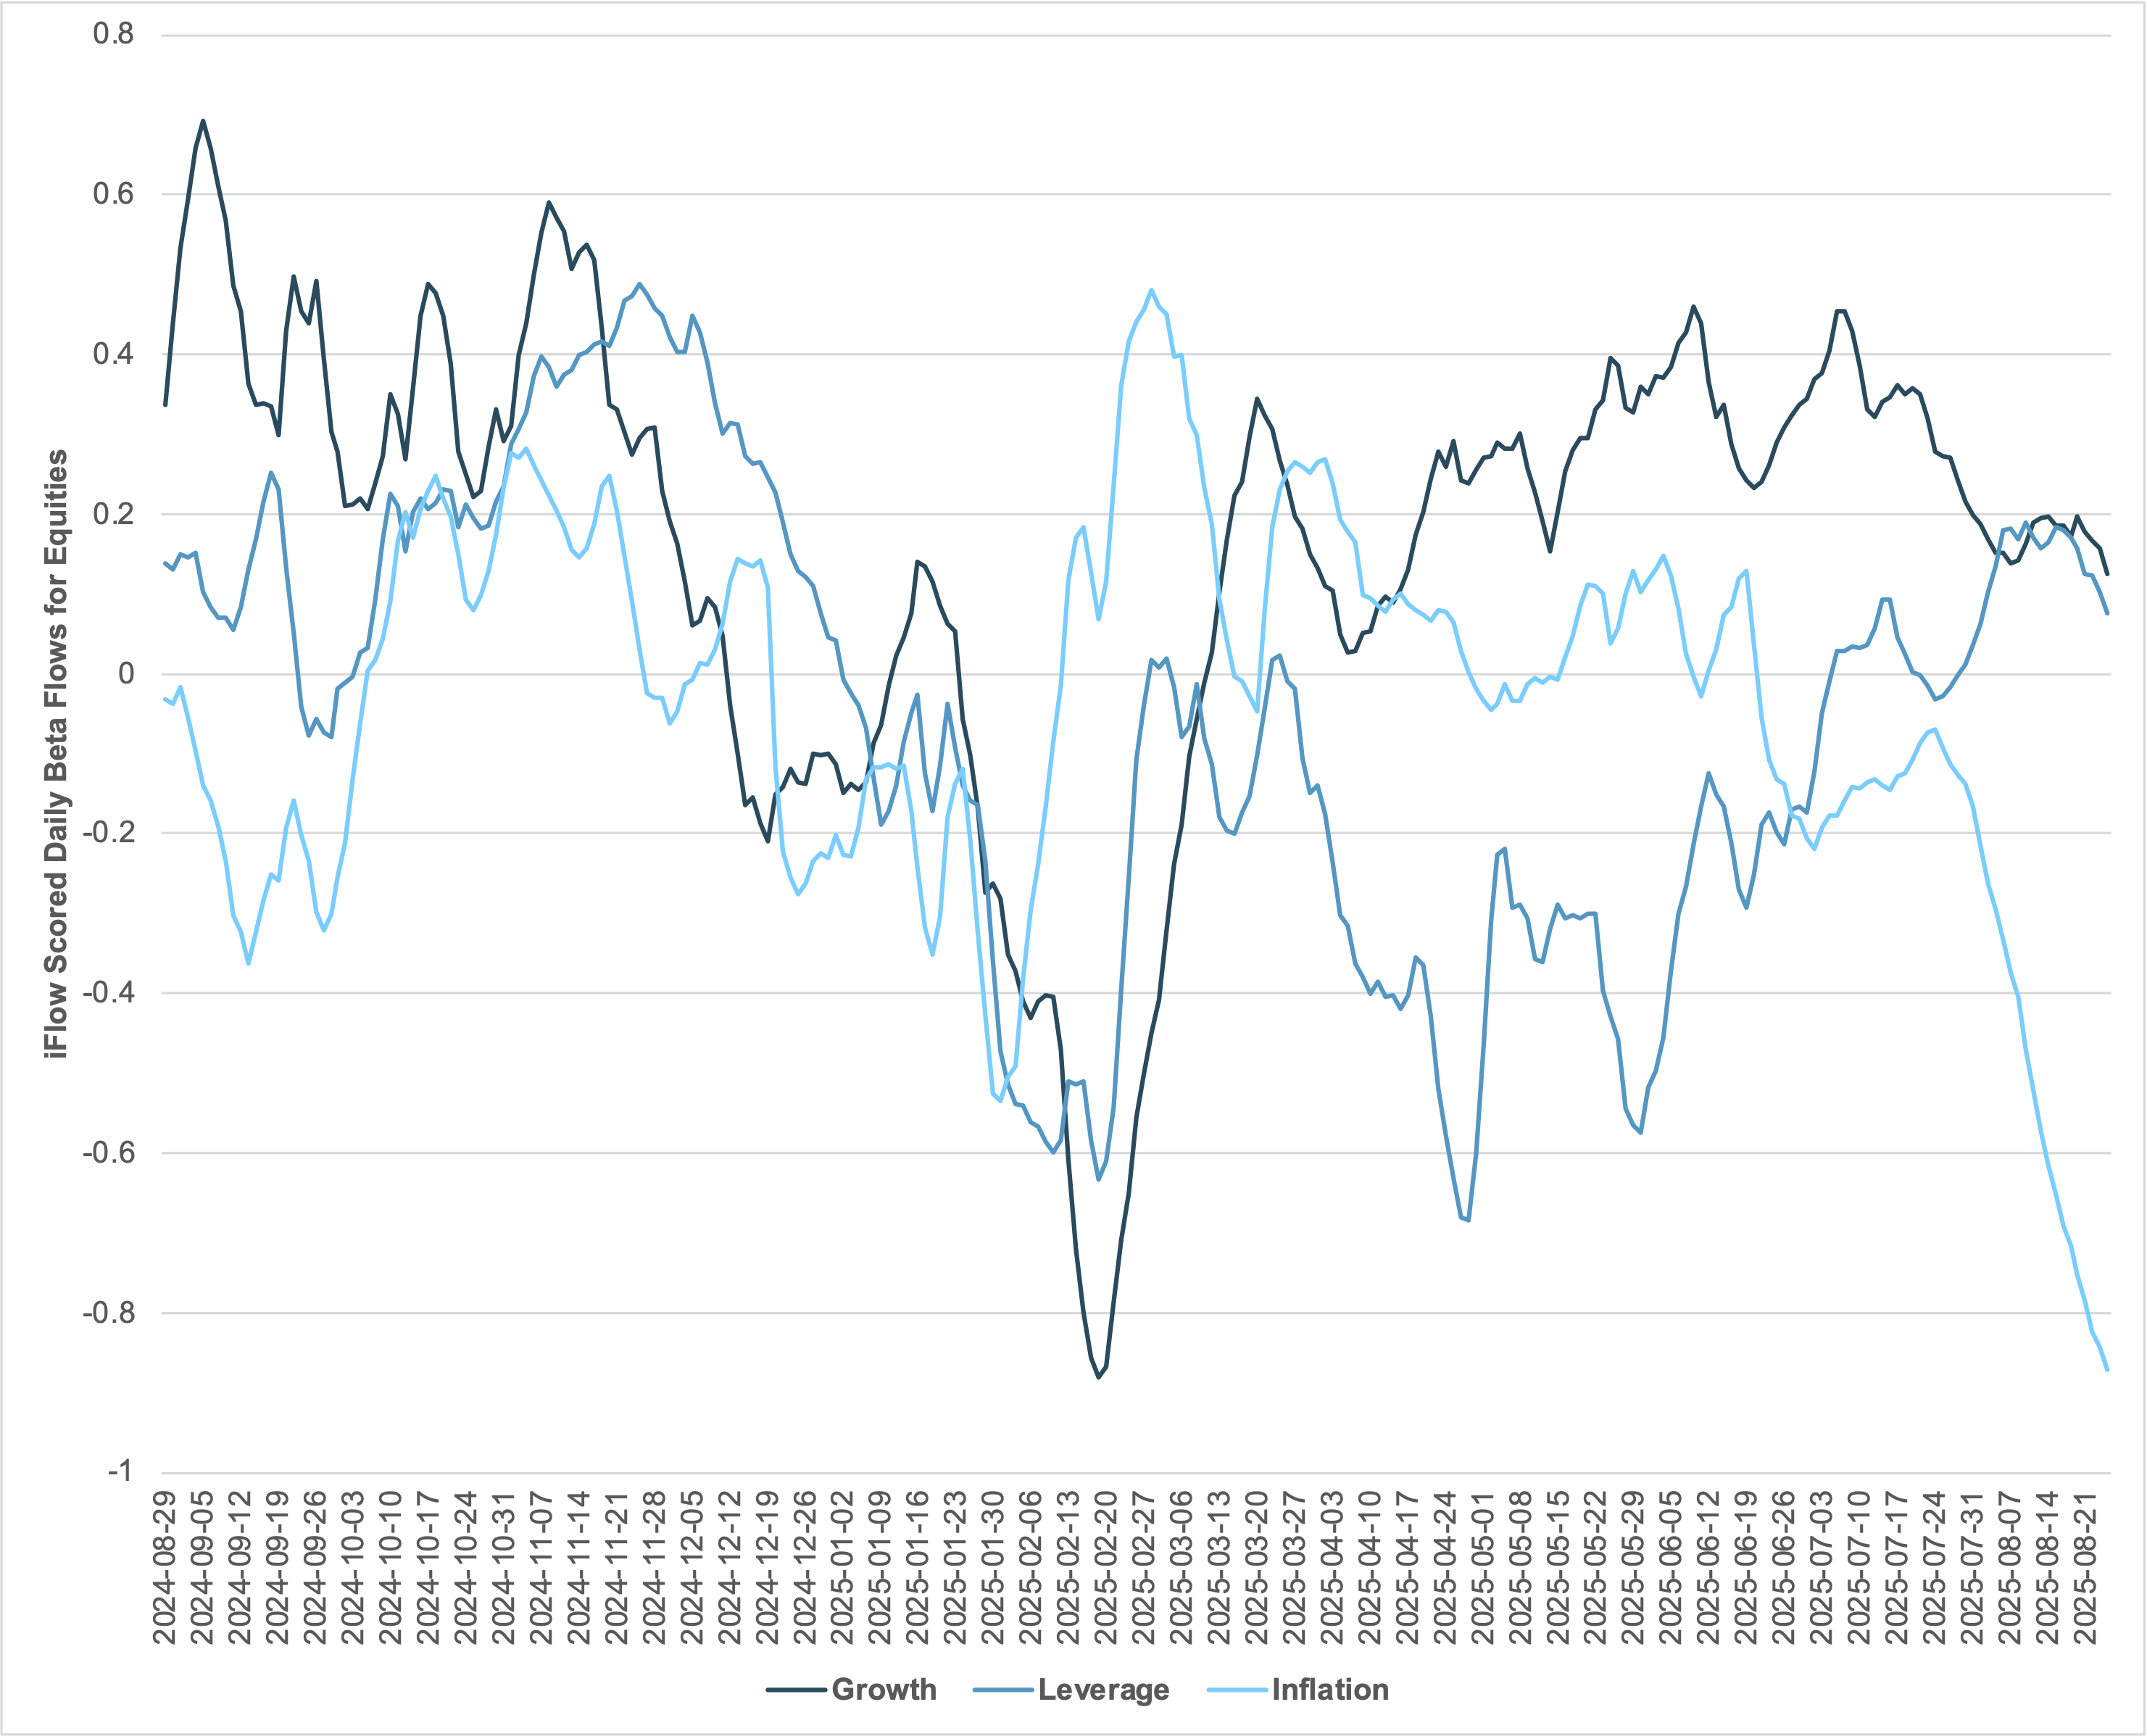
EXHIBIT #3: IFLOW EQUITY FACTOR FLOWS: GROWTH, LEVERAGE AND INFLATION
Source: BNY, Bloomberg
Our take
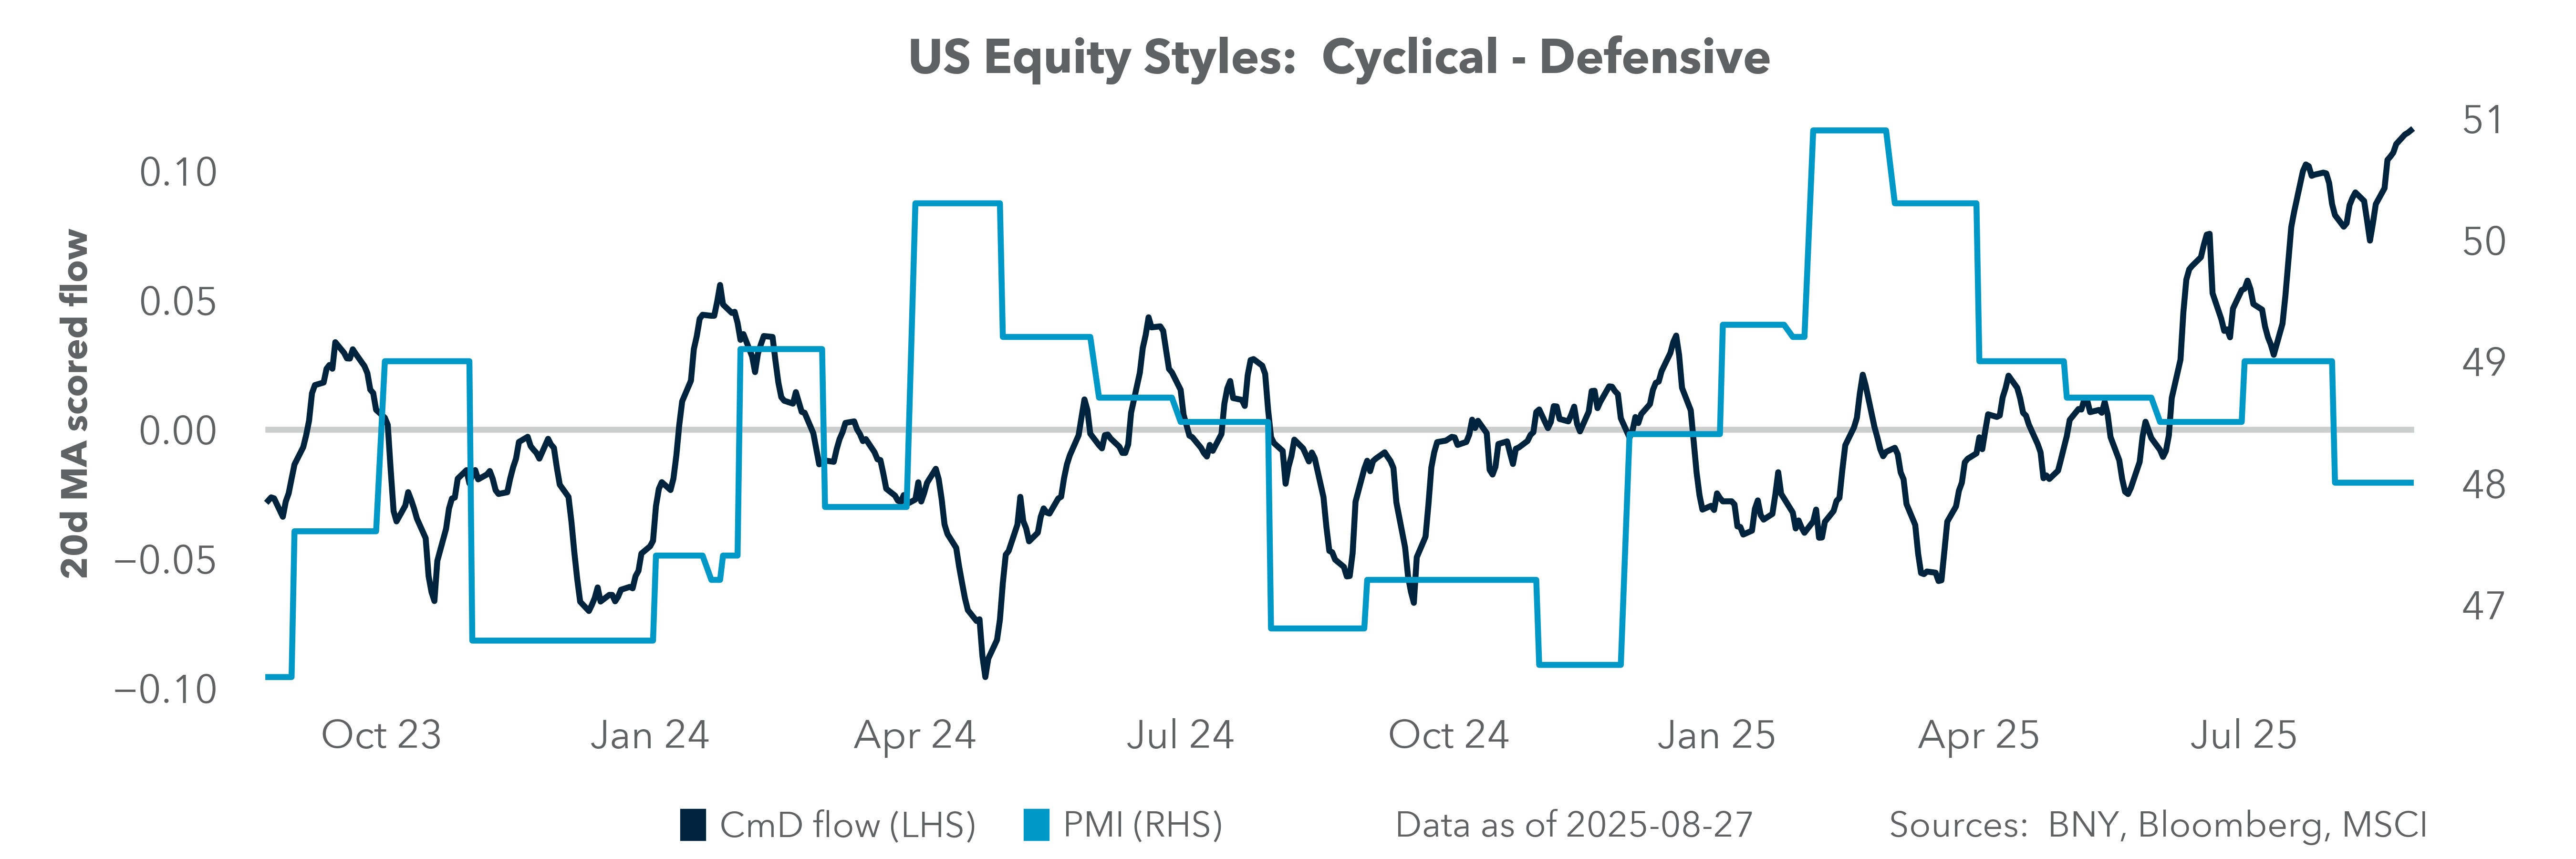
Equity investors are not prepared for growth or inflation shocks. iFlow data reveal a notable drop in inflation fears, as investors doubled down on risk, raising leverage and rotating back to cyclical expectations over defensive plays. This contrasts with the rest of the world, where our iFlow Mood index remains deeply negative, in the 12th percentile. Part of this reflects the widening earnings gap between the U.S. and Europe or APAC, while tariff fears and politics explain the rest. U.S. markets have outperformed globally, but foreign ownership of U.S. assets remains unremarkable. The domestic bias toward IT and confidence in Fed easing dominated summer trading. Growth, however, has moderated.
Forward look
Stagflation has not been a common economic condition in U.S. markets. The most recent global episode followed the “Great Financial Crisis” spanning 2010 to 2014. Overall, investors expect monetary policy to react to slower growth. “Stall speed” risks for the U.S. economy often precede recessions. Our positioning data show rising expectations for soft-landings or no-landings. The S&P 500 returns during quarters when GDP is below 1% have occurred only seven times in the last 50 years, with 1974 and 2008 seeing the sharpest stock declines (<-25%). The most resilient U.S. sectors in slow-growth quarters have been Consumer Staples, Health Care and Utilities. Thematically, companies paying dividends above 10y rates have also outperformed. Growth or higher inflation surprises could undermine the current S&P 500 uptrend, given the summer rally and underheld positions in U.S. defensive sectors, except Utilities, which are already well held.
Breadth and rotation support resilience, but complacency, Fed timing, and stagflation risks argue for selective defensiveness into September.