Higher Treasury yields may present opportunities
Long-dated U.S. Treasury yields are in the spotlight following recent Treasury intervention. In our view, the recent rise in yields reflects underlying supply and demand dynamics, rather than concerns about U.S. solvency. Meanwhile, recent market repricing may create opportunities for active investors, especially at the front end of the curve.
 3 mins Reading time
Published on 09 September 2026
3 mins Reading time
Published on 09 September 2026


U.S. Treasury yields are back in the headlines
The 30-year U.S. Treasury yield reached 5.3% in August 2026 – its highest level since 2007.
This was followed by an unscheduled August 19 Treasury announcement expanding the government’s established bond buyback program.
The program itself is modest, with each buyback representing less than 0.1% of the longer-dated Treasury market it is targeting.1 However, the signal that the Treasury is willing to proactively attempt to contain long-term yields has helped renew attention on U.S. debt costs. Although headlines are focused on instability in long-term yields, we see potential opportunities in shorter maturities.
Supply, not solvency, may be driving yields higher
On August 18, the day before the Treasury’s announcement, the total level of U.S. federal debt reached $40 trillion. Its upward trajectory is set to continue. The Congressional Budget Office (CBO) estimates the annual fiscal deficit trending at ~6% of GDP for the foreseeable future.
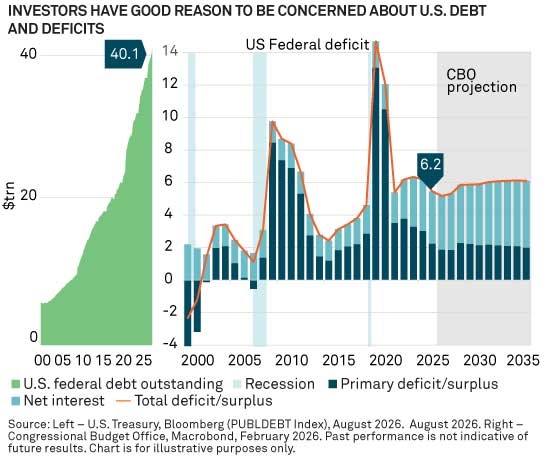
However, we do not believe markets are pricing in an impending fiscal crisis. U.S. credit default swap (CDS) spreads have narrowed through August 2026, in our view reflecting relatively healthy U.S. nominal GDP growth. Meanwhile, Treasury bond auctions have continued to function smoothly, with no evidence of foreign investor flight or stress in currency markets.
The deficit does, however, imply substantial and continuing borrowing at a time when demand may be more price-sensitive.
What is driving U.S. Treasury yields higher?
1) U.S. markets have been caught in a global trend
Rising yields this year have been a global story. Foreign yields have generally risen in step or more than they have in the U.S.
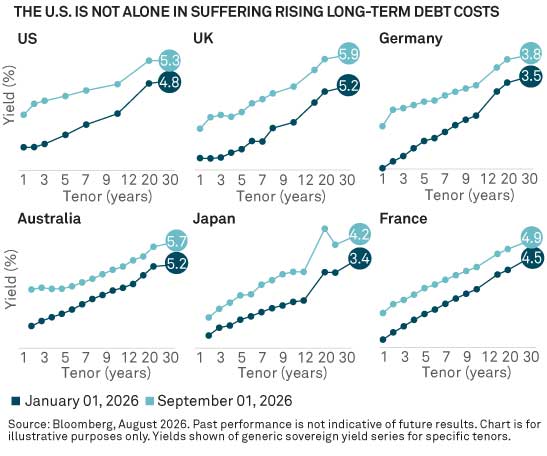
The drivers have, in some cases, been related to policy trends, including concerns around France’s budget outlook and Germany’s defense spending plans. In Japan, the central bank has also been normalizing interest rates. For some regions, domestic yields may have started offering an alternative to U.S. Treasuries.
2) Long-dated corporate issuance may offer an alternative to long-dated U.S. Treasuries
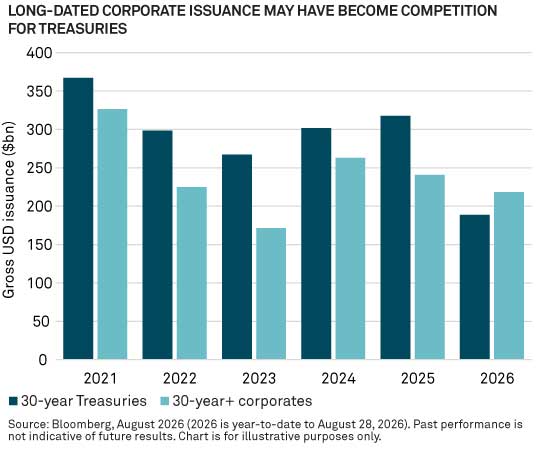
This year, gross U.S. dollar corporate issuance of maturities of 30 years or longer is on track to outpace 30-year Treasury issuance for the first time since the pandemic.
The largest 30-year-plus deals have been AI-related issues from Amazon, Google, Meta and Oracle.2 This has created some potential competition for Treasuries, particularly given the first two are rated AA, the same as the U.S. government. Overall, U.S. dollar hyperscaler debt issuance has reached $157 billion in the U.S. year-to-date, versus $93 billion in 2025, potentially contributing to pressure across the curve.
3) The new Fed regime has kept investors guessing
The Federal Reserve (Fed) is no longer expanding its balance sheet, leaving increasingly price-sensitive private investors to absorb most of the incremental Treasury bond supply.
Further, under Chair Kevin Warsh, the Fed has ceased to publish forward guidance. This may have increased uncertainty around the future path of inflation and monetary policy and resulted in investors demanding a higher “term premium” in longer-dated bonds as compensation.
Warsh has noted that rising bond yields were working to tighten financial conditions, helping the central bank to achieve price stability. Markets appeared to view this as a signal that the Fed was willing to tolerate a rise in long-dated yields.
Finding value on the curve
For all the attention long-dated Treasury yields have received, U.S. yields have risen further at shorter maturities this year, “flattening” the shape of the yield curve.
Macroeconomic developments could help reverse some of these trends in the near term.
For example, clearer evidence of easing core inflation, a less hawkish Fed trajectory, and clarity from the central bank around its balance-sheet policy could help calm investors and increase demand for Treasury bonds.
However, we expect such developments may have a larger impact on the front of the curve than the long end.
For long-dated yields to sustainably fall, it would ideally take an improvement in the U.S. fiscal trajectory (and thus a lighter bond supply calendar). At this point, there is no sign of any political will for that.
If the selloff deepens, higher yields could eventually attract renewed interest from foreign investors. For patient investors, opportunities at the long end of the curve may emerge over time.
Watching the short end of the curve
We believe that short and intermediate-dated fixed income exposure, along with “relative value” trades that aim to benefit from the U.S. yield curve returning to a steeper shape, could be worth considering in the current environment.
Ultimately, we believe higher long-term and near-term yields may enhance fixed income’s broader appeal. Active investors may also find strategic and tactical opportunities through targeting value at specific points of the yield curve or through relative value trades.
1Bloomberg (Bloomberg U.S. Treasury Bond Index), August 2026
2The mention of a specific security is not a recommendation to buy or sell such security. The specific securities identified are not representative of all the securities purchased, sold or recommended for advisory clients. It should not be assumed that an investment in the securities identified will be profitable. Actual holdings will vary for each client and there is no guarantee that a particular client’s account will hold any or all of the securities listed.
ABOUT INSIGHT INVESTMENT
Insight Investment is a leading global investment manager and fixed income specialist firm within BNY Investments.
Appendix
Credit spread is the difference in yield between a bond and a comparable “risk-free” government bond (typically a U.S. Treasury) of the same maturity. Credit spread return is the gain or loss resulting from the narrowing or widening of a bond’s credit spread. Credit default swap (CDS) is a financial contract that offers protection against the risk of default on debt instruments. Yield curve plots the interest rates of bonds over time.
The Bloomberg U.S. Treasury Index measures U.S. dollar-denominated, fixed-rate, nominal debt issued by the U.S. Treasury. The Bloomberg U.S. Corporate Index tracks the U.S. investment grade corporate bond market, or bonds rated BBB or higher. Investors cannot directly invest in any index.
“BLOOMBERG” and the Bloomberg indices listed herein (the “Indices”) are service marks of Bloomberg Finance L.P. and its affiliates, including Bloomberg Index Services Limited (“BISL”), the administrator of the Indices (collectively, “Bloomberg”) and have been licensed for use for certain purposes by the distributor hereof (the “Licensee”). Bloomberg is not affiliated with Licensee, and Bloomberg does not approve, endorse, review, or recommend the financial products named herein (the “Products”). Bloomberg does not guarantee the timeliness, accuracy, or completeness of any data or information relating to the Products.
Risks
Bonds are subject generally to interest-rate, credit, liquidity, call and market risks, to varying degrees. Generally, all other factors being equal, bond prices are inversely related to interest-rate changes and rate increases can cause price declines.
Bond ratings reflect the rating entity’s evaluation of the issuer’s ability to pay interest and repay principal on the bond on a timely basis. Bonds rated BBB/Baa or higher are considered investment grade, while bonds rated BB/Ba or lower are considered speculative as to the timely payment of interest and principal. Credit ratings reflect only those assigned by Nationally Recognized Statistical Rating Organizations (NRSRO) that have rated fund holdings. Split-rated bonds, if any, are reported in the higher rating category.
Important information
BNY Investments is the brand name for the investment management business of BNY and its investment firm affiliates worldwide. BNY is the corporate brand of The Bank of New York Mellon Corporation and may be used to reference the corporation as a whole or its various subsidiaries generally.
The information contained herein reflects general views and is provided for informational purposes only. This material is not intended as investment advice nor is it a recommendation to adopt any investment strategy.
Opinions and views expressed are subject to change without notice.
Past performance is no guarantee of future results.
Issuing entities
This material is only for distribution in those countries and to those recipients listed, subject to the noted conditions and limitations: • United States: by BNY Mellon Securities Corporation (BNYSC), 240 Greenwich Street, New York, NY 10286. BNYSC, a registered broker-dealer and FINRA member, has entered into agreements to offer securities in the U.S. on behalf of certain BNY Investments firms. • Europe (excluding Switzerland): BNY Mellon Fund Management (Luxembourg) S.A., 2-4 Rue EugèneRuppertL-2453 Luxembourg. • UK, Africa and Latin America (ex-Brazil): BNY Mellon Investment Management EMEA Limited, BNY Mellon Centre, 160 Queen Victoria Street, London EC4V 4LA. Registered in England No. 1118580. Authorised and regulated by the Financial Conduct Authority. • South Africa: BNY Mellon Investment Management EMEA Limited is an authorised financial services provider. • Switzerland: BNY Mellon Investments Switzerland GmbH, Bärengasse 29, CH-8001 Zürich, Switzerland. • Middle East: DIFC branch of The Bank of New York Mellon. Regulated by the Dubai Financial Services Authority. • South East Asia and South Asia: BNY Mellon Investment Management Singapore Pte. Limited Co. Reg. 201230427E. Regulated by the Monetary Authority of Singapore. • Hong Kong: BNY Mellon Investment Management Hong Kong Limited. Regulated by the Hong Kong Securities and Futures Commission. • Japan: BNY Mellon Investment Management Japan Limited. BNY Mellon Investment Management Japan Limited is a Financial Instruments Business Operator with license no 406 (Kinsho) at the Commissioner of Kanto Local Finance Bureau and is a Member of the Investment Trusts Association, Japan and Japan Investment Advisers Association and Type II Financial Instruments Firms Association. • Brazil: ARX Investimentos Ltda., Av. Borges de Medeiros, 633, 4th floor, Rio de Janeiro, RJ, Brazil, CEP 22430-041. Authorized and regulated by the Brazilian Securities and Exchange Commission (CVM). • Canada: BNY Mellon Asset Management Canada Ltd. is registered in all provinces and territories of Canada as a Portfolio Manager and Exempt Market Dealer, and as a Commodity Trading Manager in Ontario. All issuing entities are subsidiaries of The Bank of New York Mellon Corporation.
No part of this material may be reproduced in any form, or referred to in any other publication, without express written permission. All information contained herein is proprietary and is protected under copyright law.
NOT FDIC INSURED | NO BANK GUARANTEE | MAY LOSE VALUE |
©2026 THE BANK OF NEW YORK MELLON CORPORATION
MARK-996827-2026-09-04
GU-936 Exp : 04 September 2027
YOU MIGHT ALSO LIKE

Explore the 2027 changes and what they could mean for insurers across capital requirements, governance expectations and investment flexibility.

Why we believe an active, flexible approach to fixed income may provide attractive income and improve resilience in portfolios.

Leaders rotate in and out. No single fixed income sector consistently dominates performance over time, and strong performance in one sector rarely carries over from one year to the next. For example, emerging markets local debt and global bonds — two of 2024’s worst performers — rebounded strongly in 2025. Timing fixed income markets and predicting which sector will lead next is extremely difficult.

Positive correlation between risk assets and government bonds breaks the roles these asset classes play within a portfolio. Here, we outline why correlations have risen, and how investors can seek to limit the impact on their portfolios.
