Please ensure Javascript is enabled for purposes of website accessibility Retail Sales Remain Resilient
be
en
intermediary
intermediary
false
true
Gathering data
Disclaimer Not Available

Retail sales remain resilient

Retail sales remain resilient

Considering the slowing job market, we dove into retail sales data to search for signs of the direction of household spending. We analyzed existing-store sales and found that, despite the softening labor market and concerns about growth, aggregate consumer spending remains resilient.

Chart-of-the-week-twentysix


In the wake of the government shutdown, investors have been turning to alternate sources of data in the private domain. Last week, a private outplacement firm announced that October layoffs were higher than many anticipated, raising concerns that growth could slow. With that in mind, we dove into retail sales data to search for signs of a consumer slowdown; after all, consumption comprises 70% of gross domestic product (GDP), and a softening labor market could potentially subdue spending.  

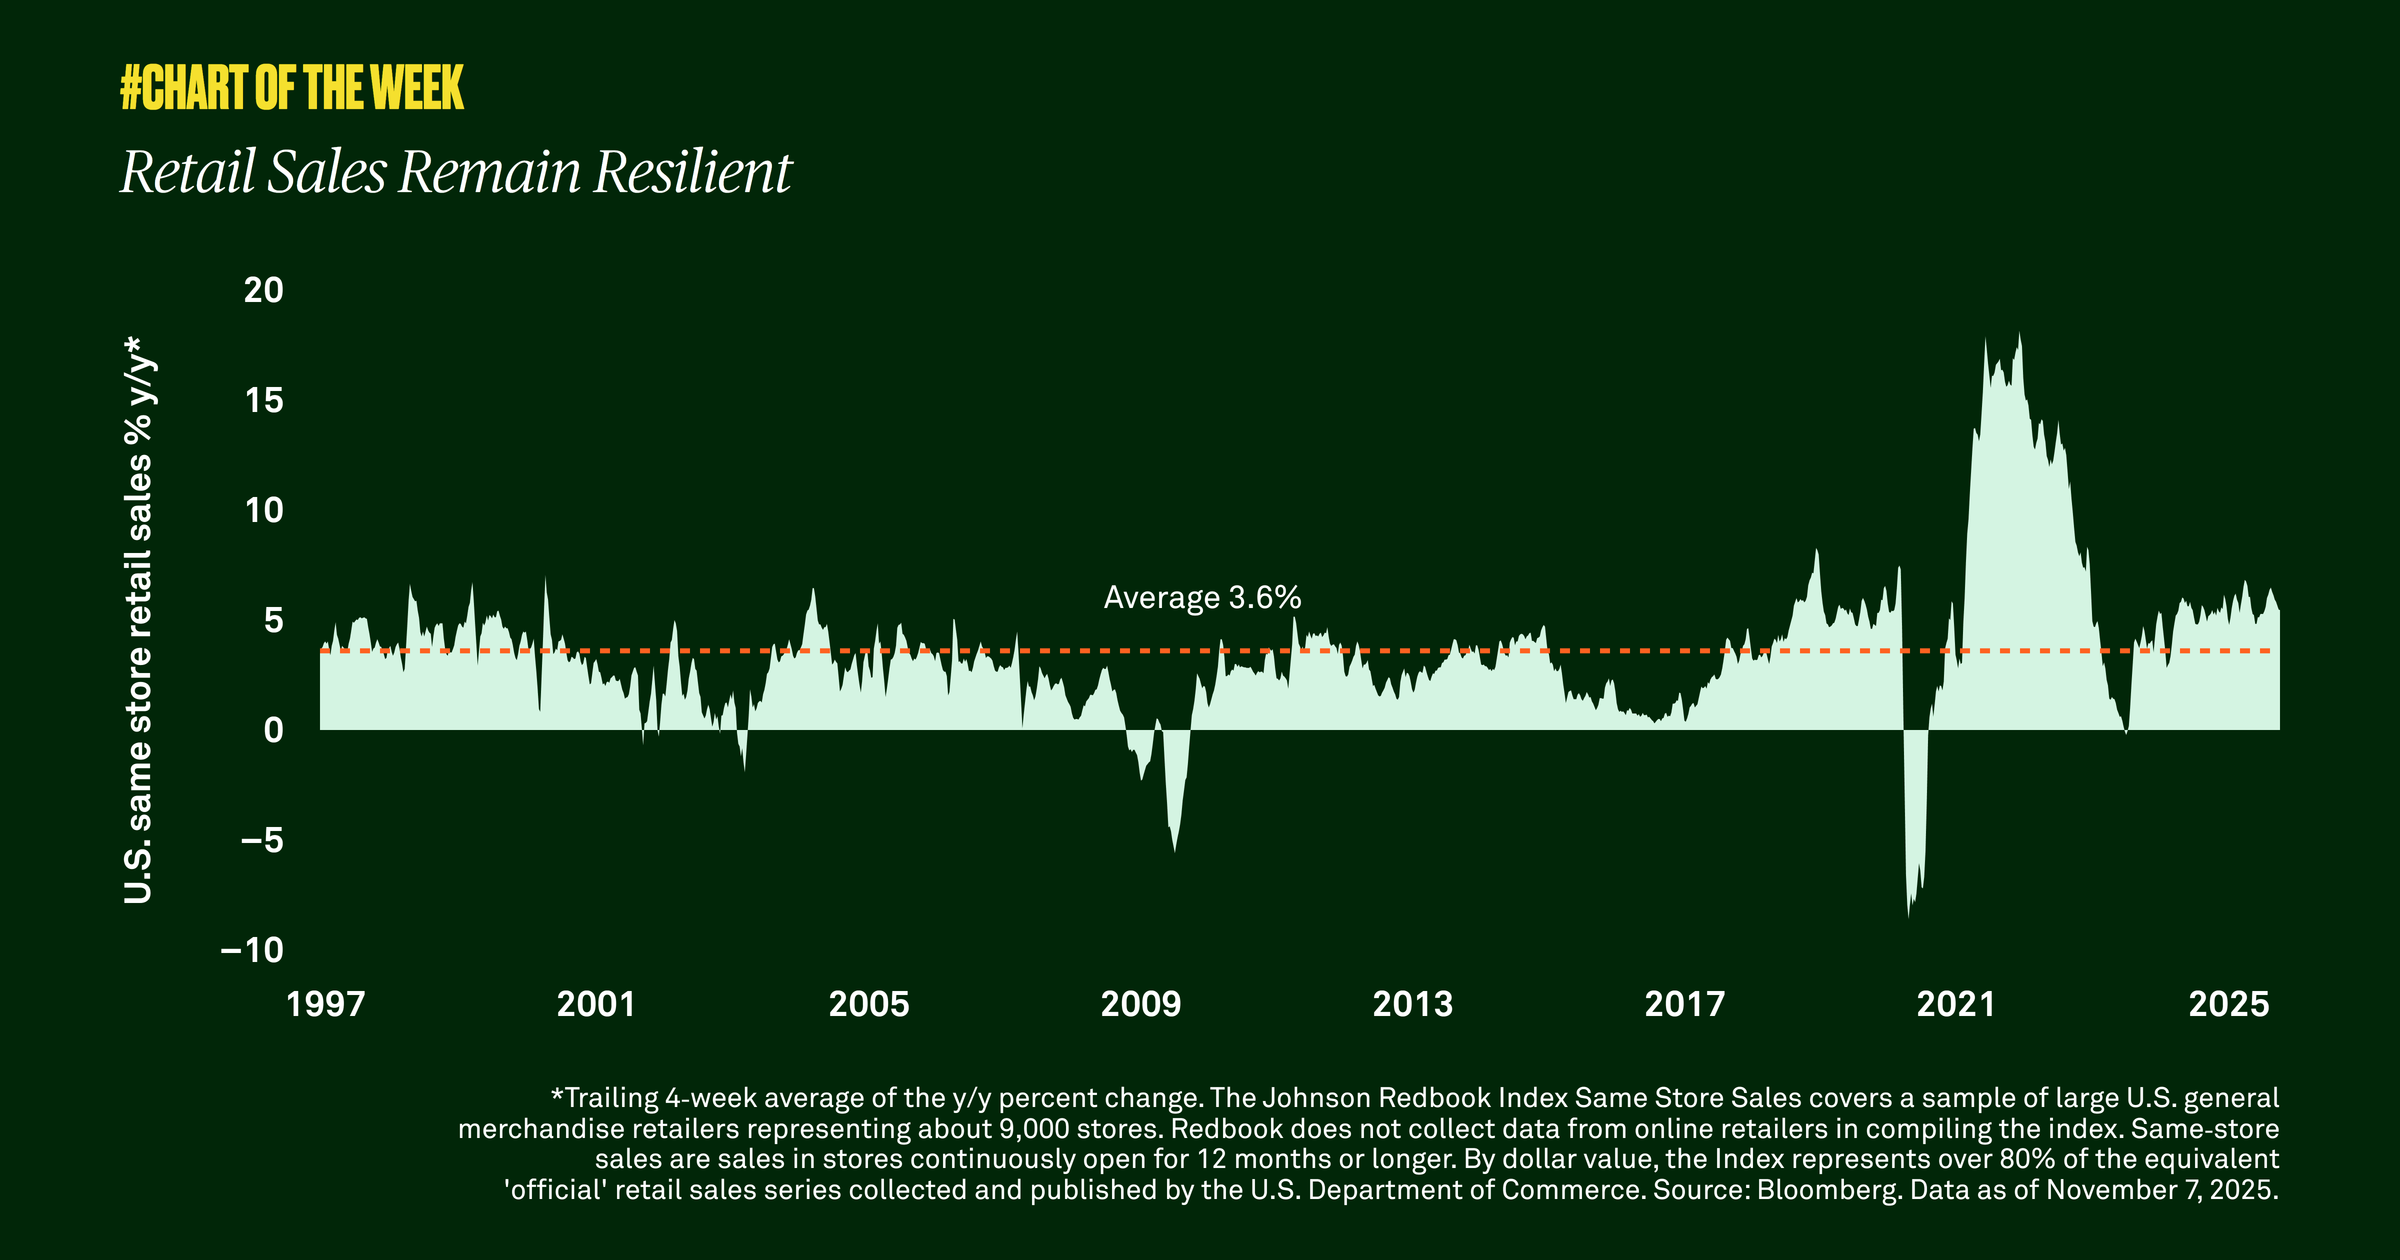
We found that the consumer’s shopping habits remain resilient. Same store retail sales, which measure in-store sales for existing stores, grew 5.7% year over year in October — 2% above the historical average going back to 1997.

In our view, retail sales will continue to be an important barometer of consumer health. While there have been differences in spending by income cohort, thus far total spending has remained resilient, In addition, next year households will enjoy some relief when the Federal Reserve’s easing results in lower borrowing costs. They can also expect stimulus of an estimated $160 billion in additional tax refunds compared to 2025. We believe consumption should continue to support positive economic growth this year and next.

RELATED CONTENT
Are earnings broadening beyond the magnificent 7?
Chart of the week | Macroeconomic

Tech stocks have outperformed the rest of the S&P 500 for several years, and while we expect earnings growth among these companies to continue in 2026, we see another encouraging trend emerging. Earnings across the rest of the market are on an upward path too — and are set to contribute more to earnings growth for the S&P 500 Index in 2026 than the Magnificent 7.

Positive signals from industrial production?
Chart of the week | Macroeconomic

Industrial production is a proxy for the level of manufacturing in the economy, and last week’s report showed the highest growth rate in three years. Not only is this positive for the manufacturing sector and those companies tied to it, but it is also an indication that a recession may be unlikely in the near term.

Healthy correction?
Chart of the week | Macroeconomic

After climbing 17% year to date through late October, the S&P 500 declined 5% through November 20. We believe the market was due for a healthy correction. While further downside is possible, it would not concern us.

The global economy is holding up
Chart of the week | Macroeconomic

This past year was rife with risks to the global economy: policy changes, tariff uncertainty and more. Yet, the global economy held up as manufacturing and services activity strengthened across the world. We see an opportunity for U.S. investors to diversify geographically.

Gathering data
Disclaimer Not Available

This is a marketing communication