PORTFOLIO CONSULTATION
BNY PINPOINT
Explore new perspectives on your model portfolios in a bespoke report that can be tailored for you.
Explore new perspectives on your model portfolios in a bespoke report that can be tailored for you.
A portfolio analysis tool for professional investors: greater portfolio insights that enhance conversations with your clients. BNY PinPointSM enables the comparison of historical portfolio data against benchmarks selected by the client for illustrative purposes.


BNY PinPointSM is a sophisticated tool which provides factual, data-driven insights, allowing financial professionals to evaluate their portfolio performance to help them make informed decisions.
Our team will work with you to use BNY PinPointSM to analyse your model portfolios. The analysis can illustrate sector, market capitalisation, regional exposure, style, duration, credit quality and maturity, depending on your instructions.
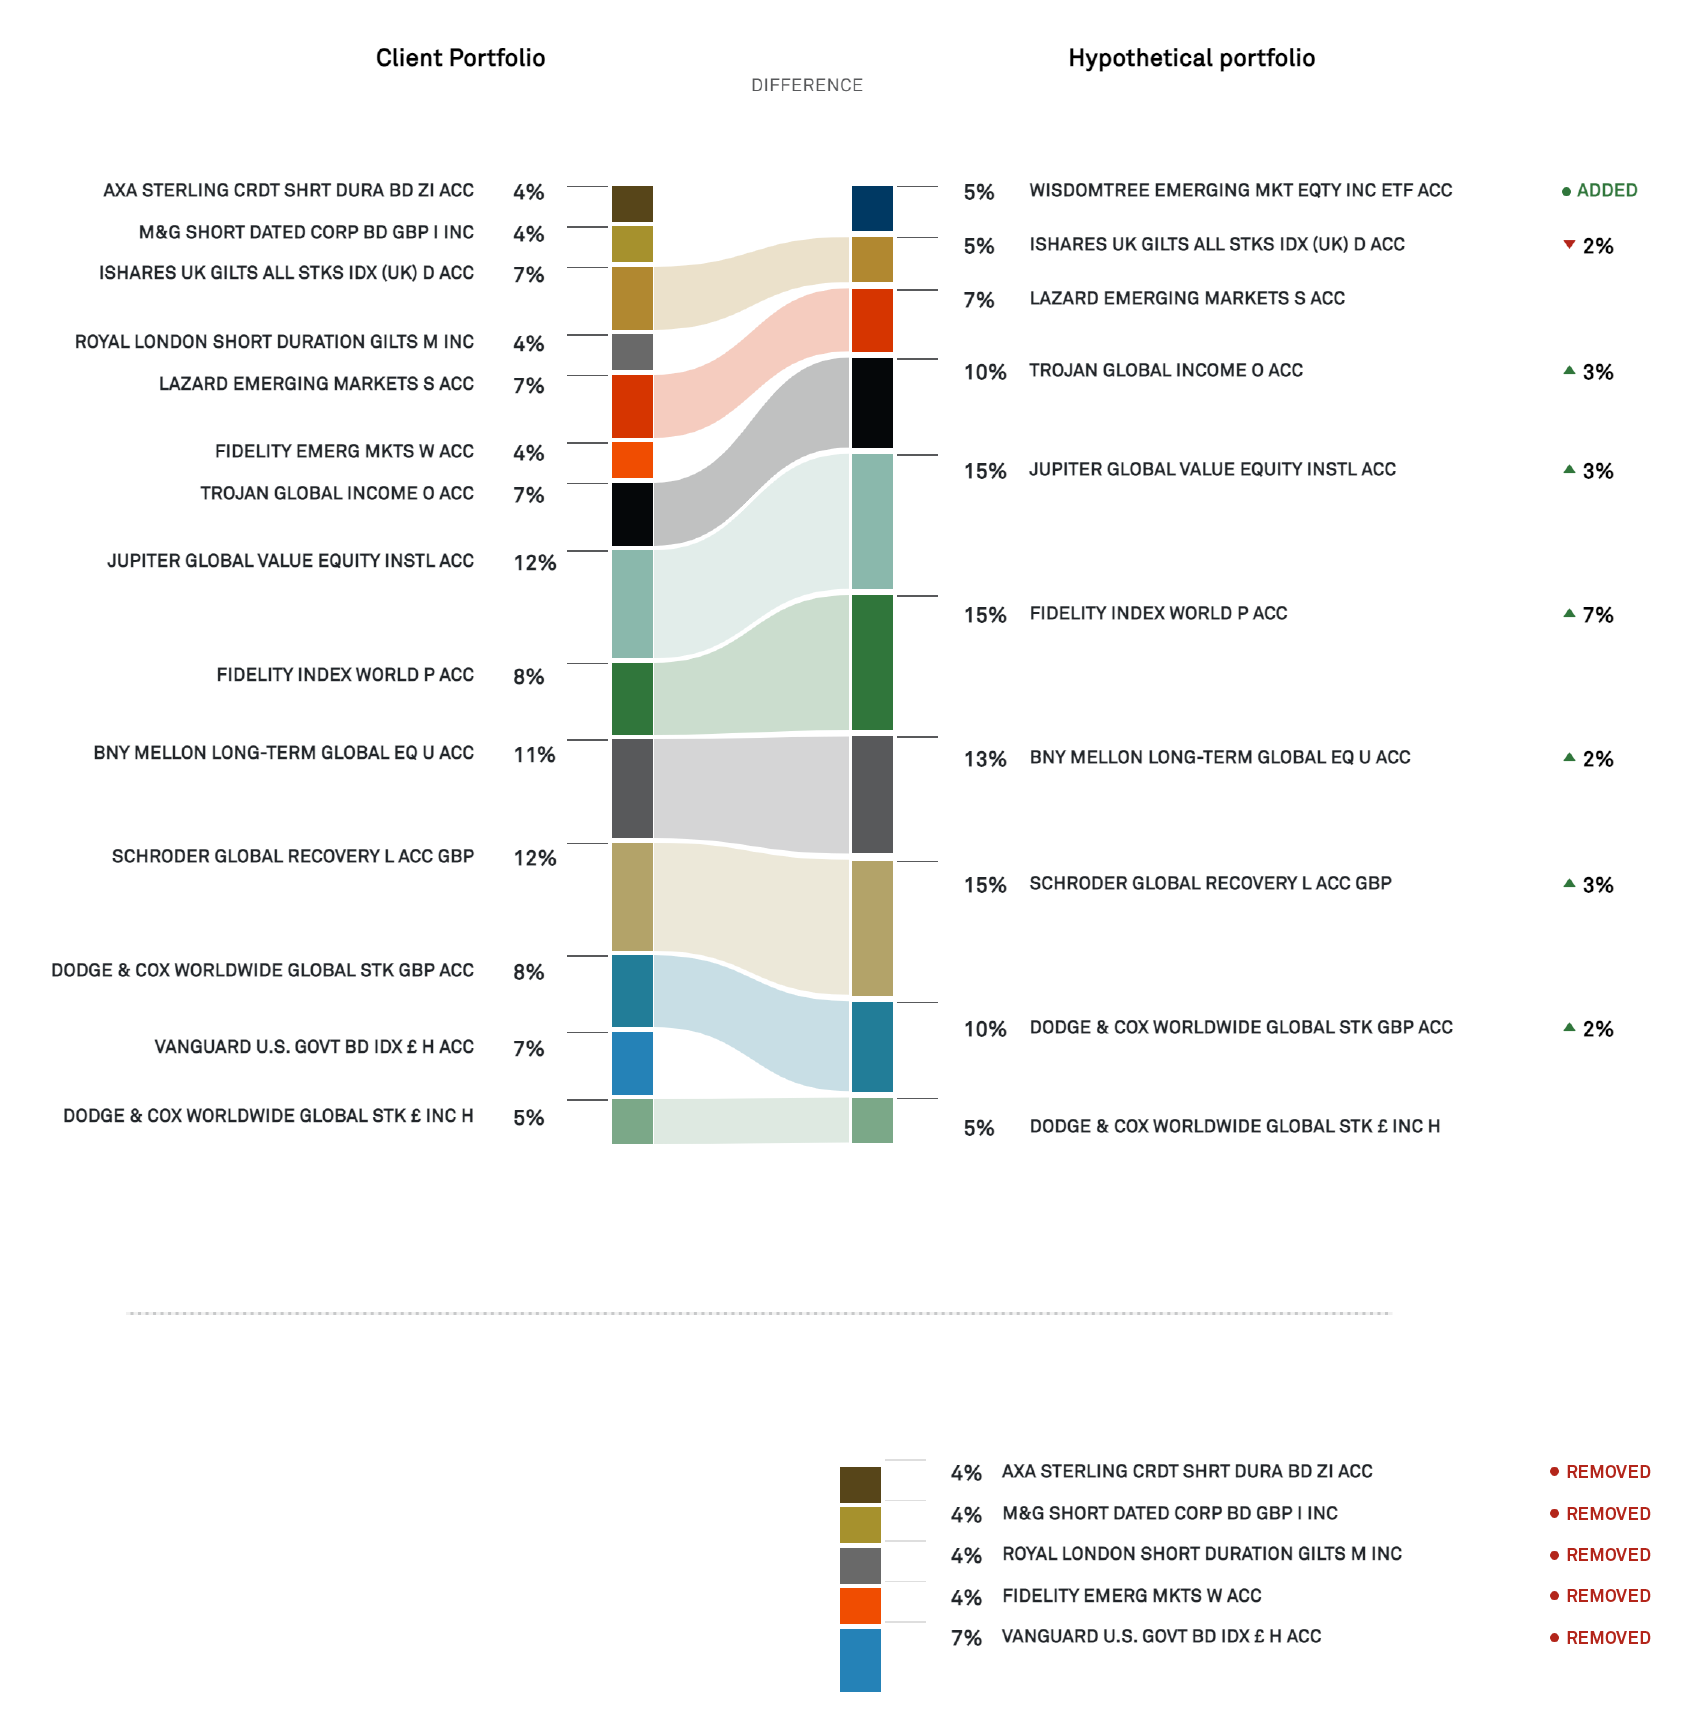
Highly engaging visual design that contains only the content you consider most relevant to provide a more compact, efficient report.
Dynamic, interactive, visual charts that summarize the changes between current and hypothetical portfolios, packaged for you in your report.
Includes a wide variety of “What-IF...?” scenarios to compare performance between benchmark, current, and hypothetical portfolios to illustrate how they would have performed under various scenarios.
A report that lets you talk to your clients about how to potentially enhance their portfolios. The report could help you to:
Harnesses a wide range of risk and performance analytics.
Identify opportunities.
Identify structural weaknesses.
Assess whether each portfolio has exposure to an appropriate level of risk to seek the desired return

This is designed to be a long-term partnership between us and the financial professional, in which BNY PinPointSM enables the financial professional to revisit the analytical process regularly- typically every six to twelve months – to reassess the portfolio, based on the prevailing market backdrop and the client’s evolving needs.
Enables the adviser/financial professional to potentially identify opportunities, highlight structural weaknesses, and understand the right amount of risk exposure for the desired return.
Meaningful analysis that enables the adviser/financial professional to assess practical solutions. BNY PinPointSM is designed to deliver insights that could lead to better, more informed decisions and ultimately to more resilient, refined model portfolios for your clients.
BNY PinPointSM delivers illustrative, historical comparisons based on input data. The tool looks through your model portfolio to analyse its underlying holdings, enabling you to identify strengths, weaknesses, possible opportunities and potential threats.
One of its key functions includes “What if..?” analysis in which the model portfolio is stress-tested against varying market situations using historical data to see how it might behave. Depending on your instructions, these situations include typical scenarios seen throughout the economic cycle – from bull or bear markets to scenarios of high or low growth, high or low volatility, and rising or falling interest rates – and also a range of exceptional historical events such as specific currency crises, oil crashes, and sovereign debt crises.
| As an advisor I need | BNY PinPointSM helps me to... |
|---|---|
| Partnership with experts, with an experience that is personalized to my needs. | Your engagement with our Portfolio Solutions team is tailored to suit your needs. Our team will work with you to use BNY PinPointSM to analyse your model portfolios and the report can be tailored to include the most pertinent sections for you. |
| Detailed but clear analytics of my clients’ investments. I want to understand ways to improve and make more robust portfolios. | BNY PinPointSM analyses the existing portfolio using a comprehensive range of risk and portfolio analytics enabling you to identify opportunities and structural weaknesses.
It drills down to enable you to gain an in-depth understanding of each portfolio to create a comprehensive snapshot. This analysis can illustrate sector, market capitalisation, regional exposure, style, duration, credit quality and maturity depending on your instruction. |
| To understand how my clients’ portfolios will perform under periods of market stress. | BNY PinPointSM stress-tests the portfolio to see how it might behave in response to a wide range of market scenarios. |
| The ability to communicate portfolio insights with my clients. | BNY PinpointSM enables you to develop comprehensive insights that you can use to help manage your next meeting or in conversations with your clients. |
Comprehensive and clear with real substance.
BNY PinPointSM exhaustive analysis culminates in a report that can be tailored for each financial professional to provide them with their preferred content and level of detail.

Nicolas Reuland, CFA1
Investment Strategist
Portfolio Solutions

Matthew Hutchinson, CFA1
Head of Portfolio Solutions

Sebastian Vismara
Senior Global Macro Economist
1 CFA® and Chartered Financial Analyst® are registered trademarks owned by CFA Institute.

The value of investments can fall. Investors may not get back the amount invested.
The value of investments can fall. Investors may not get back the amount invested.
IMPORTANT INFORMATION:
BNY PinPoint℠ (the “tool”) is intended to be used with Financial Professionals who set the parameters of the analysis contained herein and is not a proposed investment strategy or a comprehensive financial plan. The content produced by the tool is being provided for informational purposes only and should not be construed as and does not constitute investment advice or a recommendation of any particular investment product, strategy, investment manager or account arrangement, and should not serve as a primary basis for investment decisions.
By utilising the report generated from the use of this tool, Financial Professionals acknowledge their understanding of the following important information:
The content of the tool’s report is current as of the date of creation and subject to change. The report is provided for informational purposes only and should not be construed as and does not constitute investment advice. The report is not investment research or a research recommendation. Stress-testing may be carried out on a portfolio to determine how it may perform if a particular market or macroeconomic variable is to move. There is no assurance that such events or expectations will be achieved, and actual results may be significantly different from those shown here. The information is based on current market conditions which will fluctuate and may be superseded by subsequent market events or for other reasons. References to specific securities, asset classes and financial markets are for illustrative purposes only and are not intended to be and should not be interpreted as recommendations. Information contained in the tool has been obtained from third party sources believed to be reliable and BNY shall not assume any responsibility for the accuracy and/or completeness of such information, including any errors or omissions. No part of the tool’s output may be reproduced in any form, or referred to in any other publication, without express written permission.
Investors and their advisors should consider the investment objectives, risks, charges and expenses of a fund carefully before investing. Investors should contact a financial professional or visit www.bny.com/investments or relevant third-party websites to obtain the fund prospectus and Key Information Document or Key Investor Information Document and read them carefully before making any investment decisions.
Investment Risks
All investments involve some level of risk, including loss of principal. Certain investments have specific or unique risks that should be considered along with their objectives, fees and expenses. For a full list of risks applicable to funds included in the tool’s report, please refer to the respective fund’s prospectus or other offering documents. Asset allocation and diversification cannot assure a profit or protect against loss. There can be no assurance that an investment strategy based on the tool will be successful.
Charts are provided for illustrative purposes only. References to specific securities, asset classes and financial markets are for illustrative purposes only and are not intended to be and should not be interpreted as recommendations.
Morningstar Data
All data contained in the tool is provided by Morningstar, Inc., unless specified otherwise. Certain elements are created with MPI Stylus Pro, with data provided by Morningstar: Fund Attribution, Factor Attribution, Historical Scenarios, Regime Analysis, and Hypothetical Shocks.
Historical Performance Information
Historical performance reflects performance of the security or asset class shown under certain parameters and over time. Please note that careful consideration should be given to assets that have short-term historic performance records, i.e. less than five years as there is limited information as to how these assets may have performed during all market conditions. Past performance is not a guide to future performance.
Hypothetical Performance Information (Portfolio Analysis Only)
Information provided may illustrate the hypothetical historical performance of a current and hypothetical portfolio. While the individual asset classes and specific securities may have actual historical performance, the combination of these asset classes/securities in a current or hypothetical portfolio is new and, therefore, that combination does not have an actual performance record. Since these illustrations of the historic performance do not reflect the results of actual trading, but were calculated by the retroactive application of historical performance of the investment returns, such returns are hypothetical in nature.
Hypothetical performance results have many inherent limitations. No representation is being made that any fund or account will or is likely to achieve profit or loss. In fact, there are frequently sharp differences between hypothetical performance results and the actual results subsequently realised by any particular trading program. One of the limitations of hypothetical performance results is that they are generally prepared with the benefit of hindsight. In addition, hypothetical trading does not involve financial risk, and no hypothetical trading record can completely account for the impact of financial risk in actual trading. For example, the ability to withstand losses or adhere to a particular trading program in spite of trading losses are material points which can adversely affect actual trading results. There can be no assurance that the portfolios will remain the same in the future, or that an application of the current portfolio in the future will produce similar results, because the relevant market and economic conditions that prevailed during the hypothetical performance period will not necessarily recur. There are numerous other factors related to the markets in general or to the implementation of any specific trading program which cannot be fully accounted for in the preparation of hypothetical performance results, all of which can adversely affect actual trading results. All hypothetical performance results are presented for illustrative purposes only.
What If Scenarios
What If Scenarios are illustrations that aim to quantify the impact of an event or a series of events to a fund or portfolio. The historical market events, historical regime analysis and the portfolio stress testing measures the potential impact of discrete market events on a portfolio using a multi-factor statistical risk model. Based on the portfolio weightings the model determines the portfolio’s exposure to the risk factors defined in the risk model. The volatility of the risk factors used in the model as well as the sensitivity to the market event, regime or index is estimated using the available historical performance for the investments within the portfolio. The sensitivity of each risk factor to the discrete market event is aggregated to the portfolio’s total sensitivity to the market event. The scenarios used in this analysis may be different to those used by the fund or its investment manager for the purposes of monitoring and managing risk in accordance with the relevant laws, regulations and standards applicable to the fund and the investment manager. Reference should also be made to the risk disclosures and relevant risk indicator(s) set out in the fund prospectus and Key Information Document/Key Investor Information Document (as relevant).
Historical Market Events: Historical Market Events illustrate hypothetical portfolio performance during actual historical events. The investment’s exposure to the risk factor model is used to recreate the portfolio and determine hypothetical historical performance during predefined time periods.
Portfolio Stress Testing: Portfolio Stress Testing illustrates hypothetical portfolio performance if a hypothetical shock were to occur today. These stress events are not necessarily tied to actual historical event but illustrate how investments might behave in stress environments.
Historical Regime Analysis: Historical Regime Analysis illustrates hypothetical portfolio performance during actual historical market regimes. Regimes are based on historical periods that share a common characteristic or meet particular rules. Regimes are based on the trailing 25 years and are a collection of all the months that where the condition was meet. Market factors are used to recreate the portfolio and determine hypothetical historical performance.
General Disclosures
BNY Mellon Investment Funds (BNYMIF) is an open-ended investment company with variable capital (ICVC) with limited liability between sub-funds. Incorporated in England and Wales: registered number IC27. The Authorised Corporate Director (ACD) is BNY Mellon Fund Managers Limited (BNY MFM), incorporated in England and Wales: No. 1998251. Registered address: BNY Mellon Centre, 160 Queen Victoria Street, London EC4V 4LA. Authorised and regulated by the Financial Conduct Authority.
BNY Mellon Global Funds, plc (BNYMGF) is an open-ended investment company with variable capital (ICVC), with segregated liability between sub-funds. Incorporated with limited liability under the laws of Ireland and authorised by the Central Bank of Ireland as a UCITS Fund. The Management Company is BNY Mellon Fund Management (Luxembourg) S.A. (BNY MFML), regulated by the Commission de Surveillance du Secteur Financier (CSSF). Registered address: 2-4 Rue Eugène Ruppert L-2453 Luxembourg. Information on investor rights including the complaints handling policy and investor redress mechanisms is available at www.bnymellonim.com. For investors in the European Union (EU): The Manager may terminate the arrangements made for the marketing of one or more sub-funds of BNYMGF in one or more EU Member States and shareholders will receive prior notification in this event. For investors in the United Kingdom (UK): BNYMGF is authorised overseas but not in the UK. The Financial Ombudsman Service is unlikely to be able to consider complaints related to BNYMGF, its sub-funds, its operator or its depositary. Any claims for losses relating to the operator and the depositary of BNYMGF are unlikely to be covered under the compensation scheme. A prospective investor should consider getting financial advice before deciding to invest and should see the BNYMGF prospectus for more information.
BNY is the corporate brand of The Bank of New York Mellon Corporation and may be used to reference the corporation as a whole and/or its various subsidiaries generally.
No part of this material may be reproduced in any form. Not for use with the general public.
BNY PinPoint℠ (the “tool”) is intended to be used with Financial Professionals who set the parameters of the analysis contained herein and is not a proposed investment strategy or a comprehensive financial plan. The content produced by the tool is being provided for informational purposes only and should not be construed as and does not constitute investment advice or a recommendation of any particular investment product, strategy, investment manager or account arrangement, and should not serve as a primary basis for investment decisions.
By utilising the report generated from the use of this tool, Financial Professionals acknowledge their understanding of the following important information:
The content of the tool’s report is current as of the date of creation and subject to change. The report is provided for informational purposes only and should not be construed as and does not constitute investment advice. The report is not investment research or a research recommendation. Stress-testing may be carried out on a portfolio to determine how it may perform if a particular market or macroeconomic variable is to move. There is no assurance that such events or expectations will be achieved, and actual results may be significantly different from those shown here. The information is based on current market conditions which will fluctuate and may be superseded by subsequent market events or for other reasons. References to specific securities, asset classes and financial markets are for illustrative purposes only and are not intended to be and should not be interpreted as recommendations. Information contained in the tool has been obtained from third party sources believed to be reliable and BNY shall not assume any responsibility for the accuracy and/or completeness of such information, including any errors or omissions. No part of the tool’s output may be reproduced in any form, or referred to in any other publication, without express written permission.
Investors and their advisors should consider the investment objectives, risks, charges and expenses of a fund carefully before investing. Investors should contact a financial professional or visit www.bny.com/investments or relevant third-party websites to obtain the fund prospectus and Key Information Document or Key Investor Information Document and read them carefully before making any investment decisions.
Investment Risks
All investments involve some level of risk, including loss of principal. Certain investments have specific or unique risks that should be considered along with their objectives, fees and expenses. For a full list of risks applicable to funds included in the tool’s report, please refer to the respective fund’s prospectus or other offering documents. Asset allocation and diversification cannot assure a profit or protect against loss. There can be no assurance that an investment strategy based on the tool will be successful.
Charts are provided for illustrative purposes only. References to specific securities, asset classes and financial markets are for illustrative purposes only and are not intended to be and should not be interpreted as recommendations.
Morningstar Data
All data contained in the tool is provided by Morningstar, Inc., unless specified otherwise. Certain elements are created with MPI Stylus Pro, with data provided by Morningstar: Fund Attribution, Factor Attribution, Historical Scenarios, Regime Analysis, and Hypothetical Shocks.
Historical Performance Information
Historical performance reflects performance of the security or asset class shown under certain parameters and over time. Please note that careful consideration should be given to assets that have short-term historic performance records, i.e. less than five years as there is limited information as to how these assets may have performed during all market conditions. Past performance is not a guide to future performance.
Hypothetical Performance Information (Portfolio Analysis Only)
Information provided may illustrate the hypothetical historical performance of a current and hypothetical portfolio. While the individual asset classes and specific securities may have actual historical performance, the combination of these asset classes/securities in a current or hypothetical portfolio is new and, therefore, that combination does not have an actual performance record. Since these illustrations of the historic performance do not reflect the results of actual trading, but were calculated by the retroactive application of historical performance of the investment returns, such returns are hypothetical in nature.
Hypothetical performance results have many inherent limitations. No representation is being made that any fund or account will or is likely to achieve profit or loss. In fact, there are frequently sharp differences between hypothetical performance results and the actual results subsequently realised by any particular trading program. One of the limitations of hypothetical performance results is that they are generally prepared with the benefit of hindsight. In addition, hypothetical trading does not involve financial risk, and no hypothetical trading record can completely account for the impact of financial risk in actual trading. For example, the ability to withstand losses or adhere to a particular trading program in spite of trading losses are material points which can adversely affect actual trading results. There can be no assurance that the portfolios will remain the same in the future, or that an application of the current portfolio in the future will produce similar results, because the relevant market and economic conditions that prevailed during the hypothetical performance period will not necessarily recur. There are numerous other factors related to the markets in general or to the implementation of any specific trading program which cannot be fully accounted for in the preparation of hypothetical performance results, all of which can adversely affect actual trading results. All hypothetical performance results are presented for illustrative purposes only.
What If Scenarios
What If Scenarios are illustrations that aim to quantify the impact of an event or a series of events to a fund or portfolio. The historical market events, historical regime analysis and the portfolio stress testing measures the potential impact of discrete market events on a portfolio using a multi-factor statistical risk model. Based on the portfolio weightings the model determines the portfolio’s exposure to the risk factors defined in the risk model. The volatility of the risk factors used in the model as well as the sensitivity to the market event, regime or index is estimated using the available historical performance for the investments within the portfolio. The sensitivity of each risk factor to the discrete market event is aggregated to the portfolio’s total sensitivity to the market event. The scenarios used in this analysis may be different to those used by the fund or its investment manager for the purposes of monitoring and managing risk in accordance with the relevant laws, regulations and standards applicable to the fund and the investment manager. Reference should also be made to the risk disclosures and relevant risk indicator(s) set out in the fund prospectus and Key Information Document/Key Investor Information Document (as relevant).
Historical Market Events: Historical Market Events illustrate hypothetical portfolio performance during actual historical events. The investment’s exposure to the risk factor model is used to recreate the portfolio and determine hypothetical historical performance during predefined time periods.
Portfolio Stress Testing: Portfolio Stress Testing illustrates hypothetical portfolio performance if a hypothetical shock were to occur today. These stress events are not necessarily tied to actual historical event but illustrate how investments might behave in stress environments.
Historical Regime Analysis: Historical Regime Analysis illustrates hypothetical portfolio performance during actual historical market regimes. Regimes are based on historical periods that share a common characteristic or meet particular rules. Regimes are based on the trailing 25 years and are a collection of all the months that where the condition was meet. Market factors are used to recreate the portfolio and determine hypothetical historical performance.
No part of this material may be reproduced in any form. Not for use with the general public.
2345427 Exp: 31 January 2027
This is a marketing communication