Please ensure Javascript is enabled for purposes of website accessibility Global Leading Indicator Turning Higher
uk
en
intermediary
intermediary
false
true
Gathering data
Disclaimer Not Available

Global leading indicator turning higher

Global leading indicator turning higher

Headline volatility persists and yet the global growth outlook continues to improve.  We examined a leading indicator, and why there is good cause to diversify equity holdings if you haven’t already.
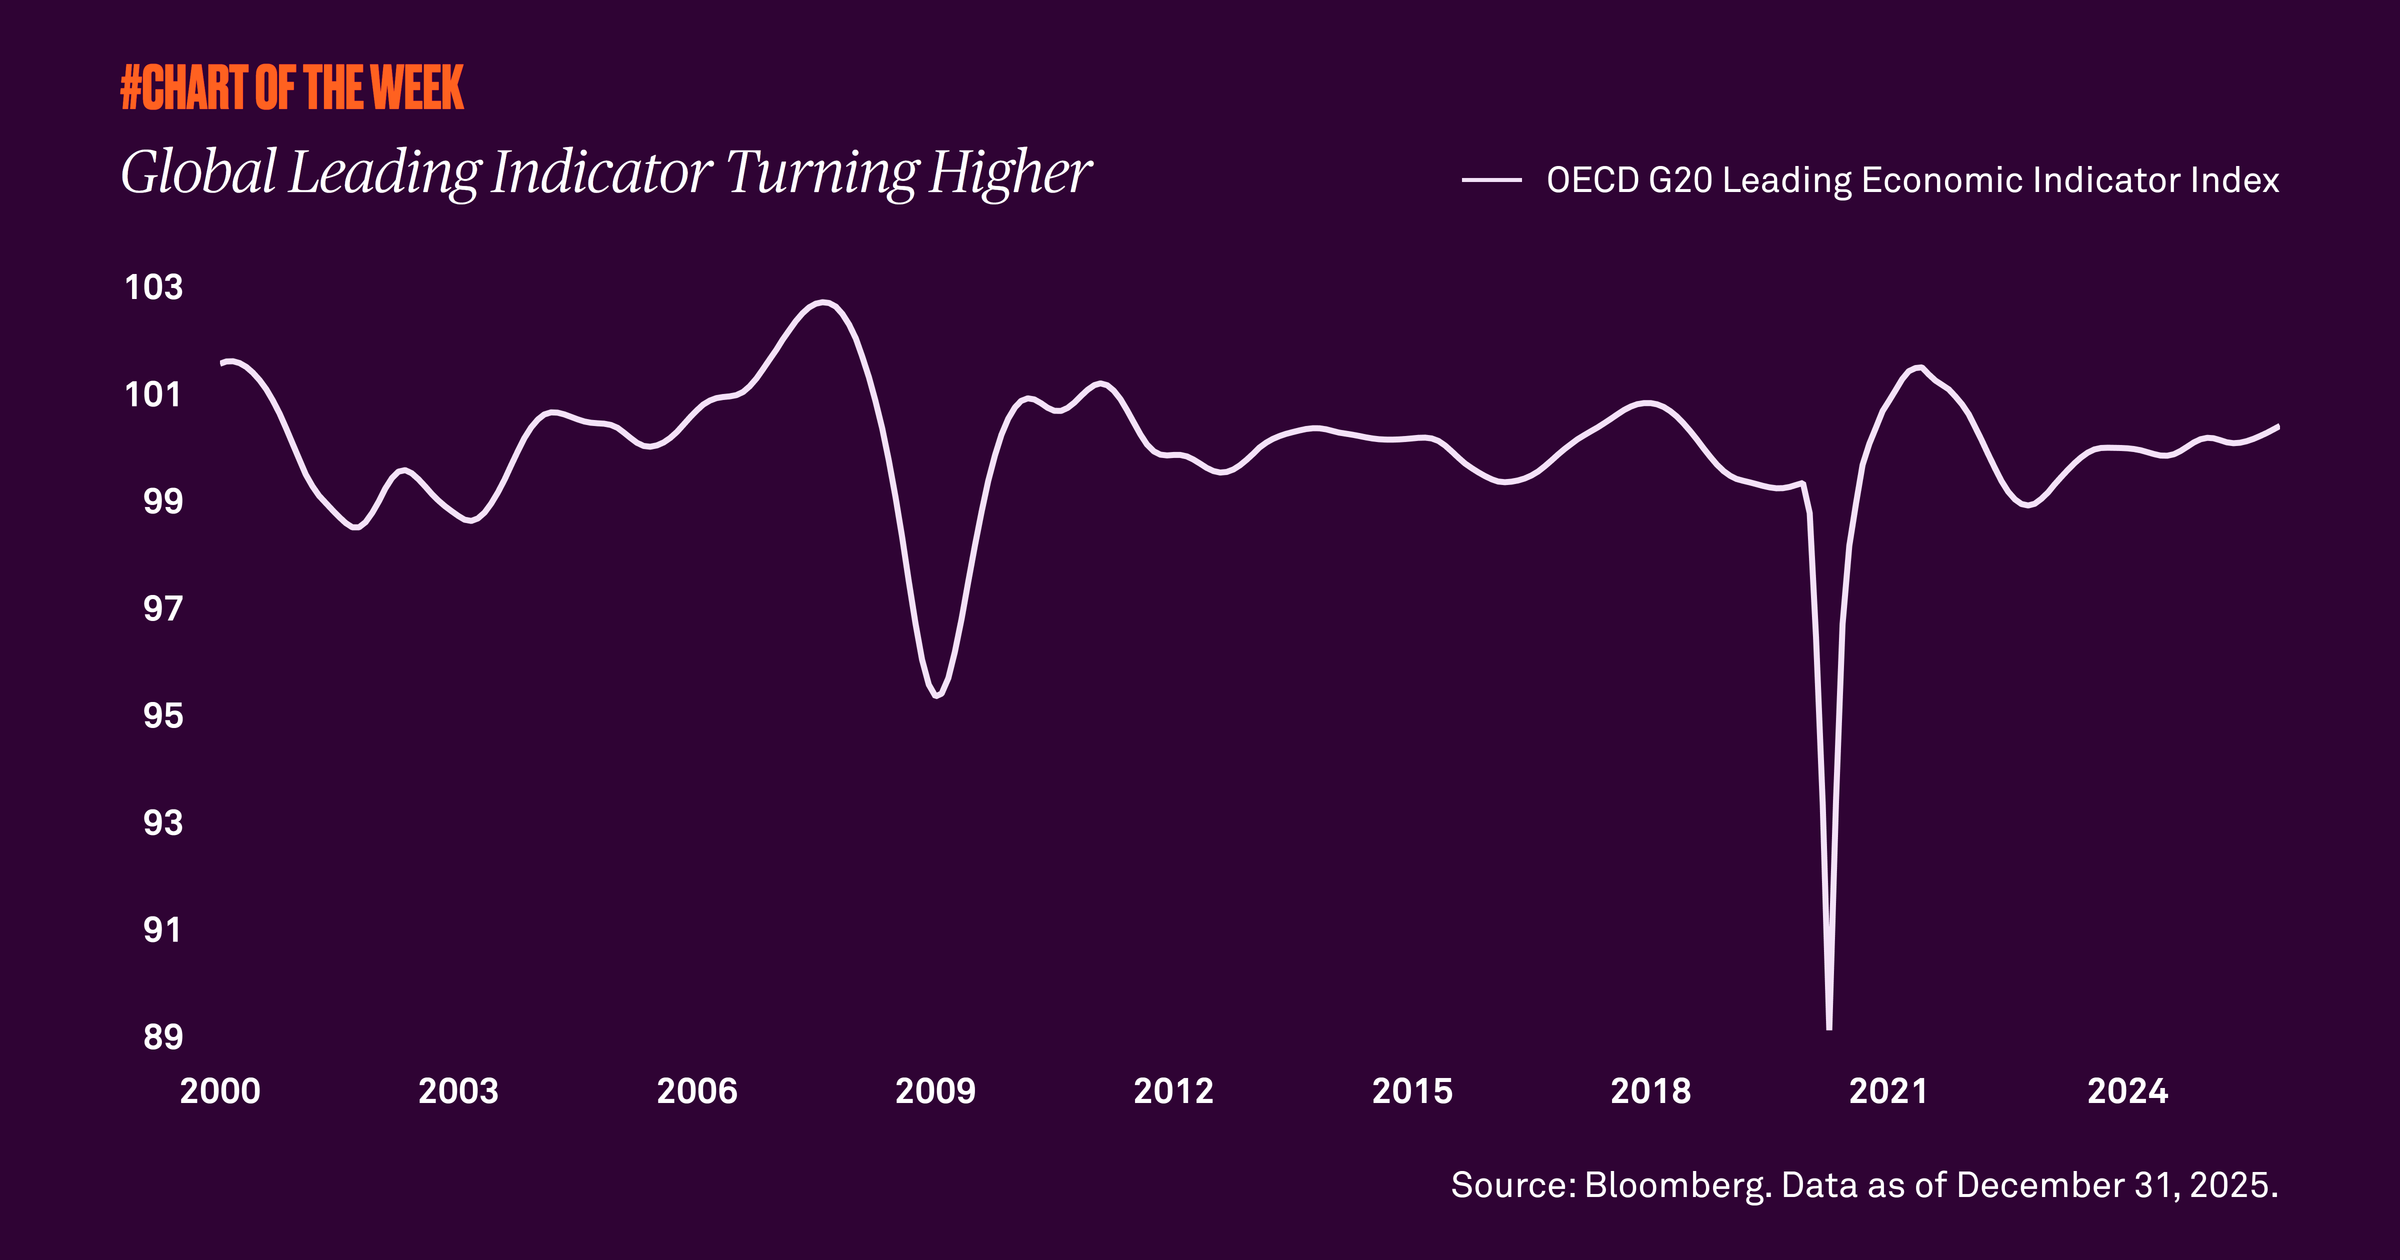

Headline volatility has risen recently as geopolitics in different corners of the globe play out on the world stage. While these headlines have been a source of uncertainty, the global economic outlook for 2026 appears to be improving.

The Organisation for Economic Co-operation and Development operates as an international forum for democratic countries to promote economic growth. Its G20 Composite Leading Indicator Index, a proxy for global activity, has reached its highest level in three years. This means that some of the world’s largest economies are expected to experience growth near or above long-term trends. Historically, an improved outlook has led to positive equity returns across both developed and emerging markets.

What does this mean for investors? Despite these headlines, stocks have proven resilient with positive equity returns year to date across the major global equity indices. Given this improved outlook, we have recently recommended increasing exposure to international and emerging markets to capture potential upside. While we still favor U.S. equities, we believe global diversification will remain critical in the year ahead. 
RELATED CONTENT
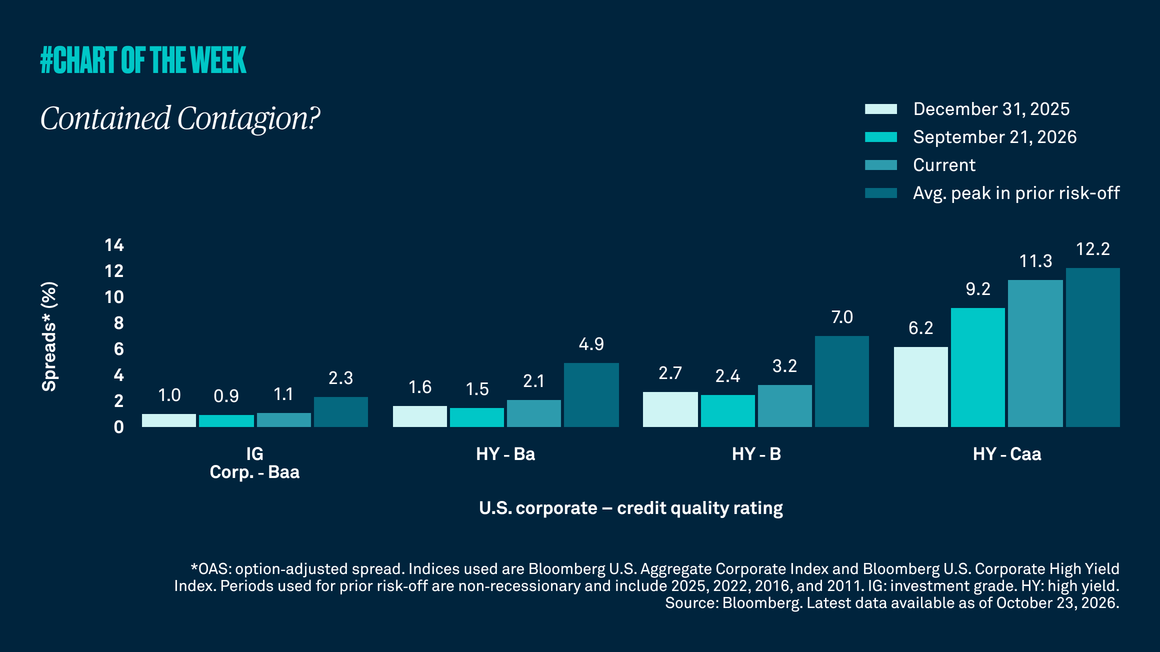
Contained contagion?
Chart of the Week | Macroeconomic

U.S. high yield credit spreads have widened year to date, reflecting greater investor caution about perceived default risk. The move also raises concerns about possible credit contagion. However, because spread widening has been concentrated in the lowest-quality issuers rather than higher-quality issuers, we don’t anticipate broader market stress.

Can the bull run in corporate margins continue?
Chart of the Week | Macroeconomic

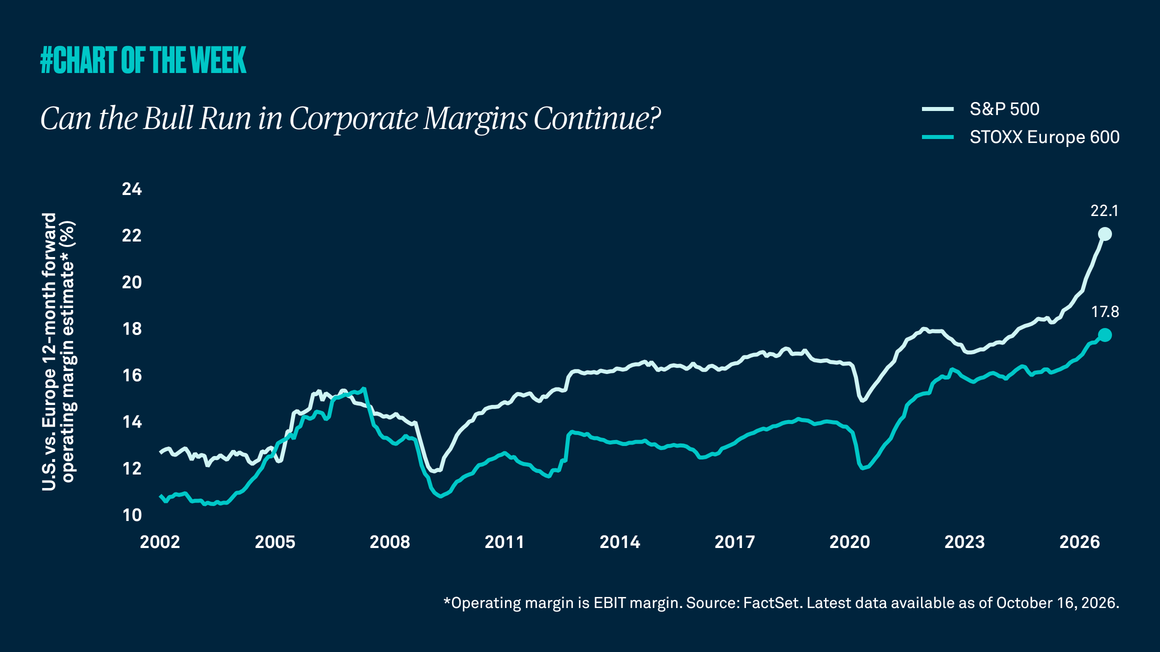
Higher inflation and elevated interest rates typically weigh on corporate profitability, yet corporate margins continue to climb to record highs. While that strength is evident both in the U.S. and abroad, U.S. outperformance versus Europe is now the widest on record. Stronger margins have helped contribute to better-than-expected earnings and reinforce U.S. equity leadership. The question now is whether that strength can persist?

Higher yields, but lower sensitivity
Chart of the Week | Macroeconomic

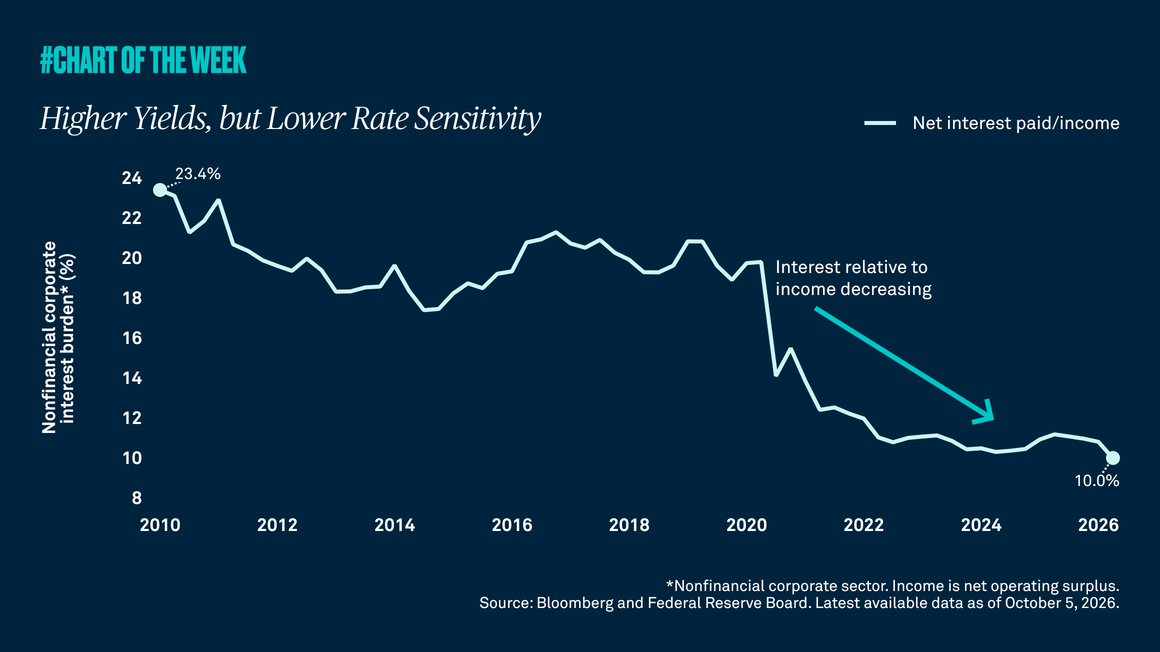
Higher interest rates have become a frequently cited risk to corporate earnings and the economy. The conventional thinking is straightforward: when borrowing costs rise, companies face higher interest expenses, profits come under pressure, and economic growth slows. While there is truth to that relationship, the current cycle may differ from investors’ expectations.

Is AI productivity hiding in the data?
Chart of the Week | Macroeconomic

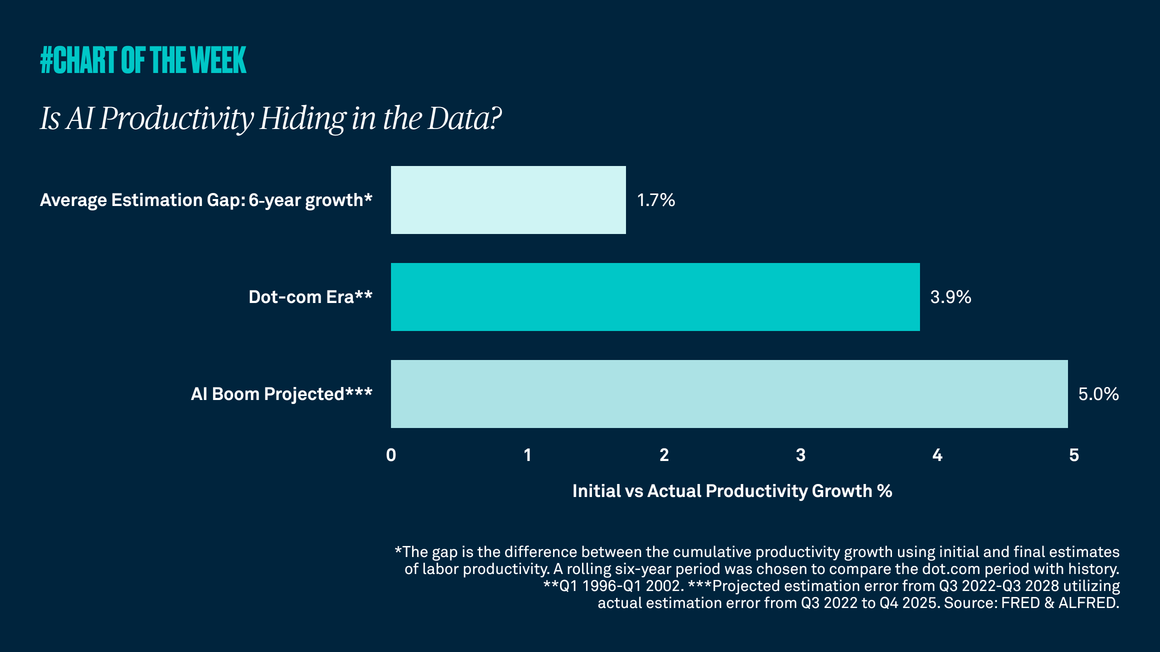
Both the dot-com era and the rise of artificial intelligence suggest that early productivity data can understate the actual economic impact of transformative technologies. In the case of the internet, later revisions to productivity gains surpassed early estimates. The same may prove true for AI, implying stronger support for growth.

Gathering data
Disclaimer Not Available

This is a marketing communication