Please ensure Javascript is enabled for purposes of website accessibility S&P 500 Returns After All-Time Highs
sg
en
institutional
institutional
false
true
Gathering data
Disclaimer Not Available

S&P 500 Returns After All-Time Highs

S&P 500 Returns After All-Time Highs

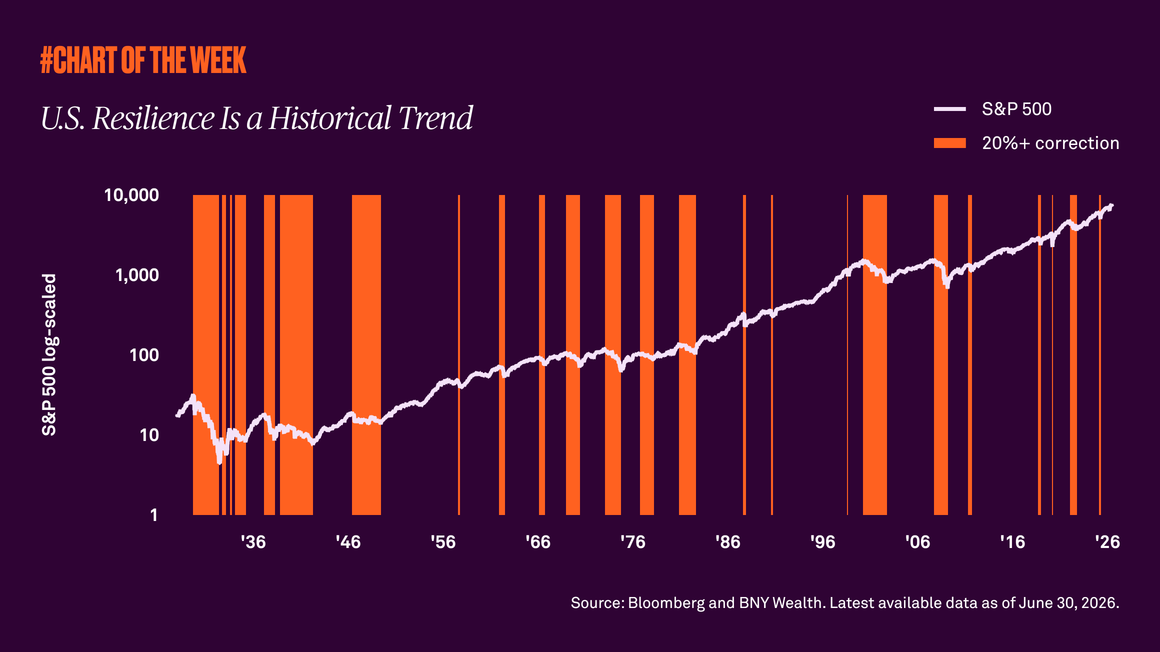
The S&P 500 recently hit a new all-time high after a notable year of peaks in 2025. Is now the time for caution? History tells us attractive performance often follows record highs.  


Last week, the S&P 500 set a record closing high that neared the still unbroached 7,000 level, after reaching a notable record of 39 all-time highs throughout 2025. Last year’s performance reflects the fifth most all-time highs in a year since 2000 and the 15th most in the entire history of the index.

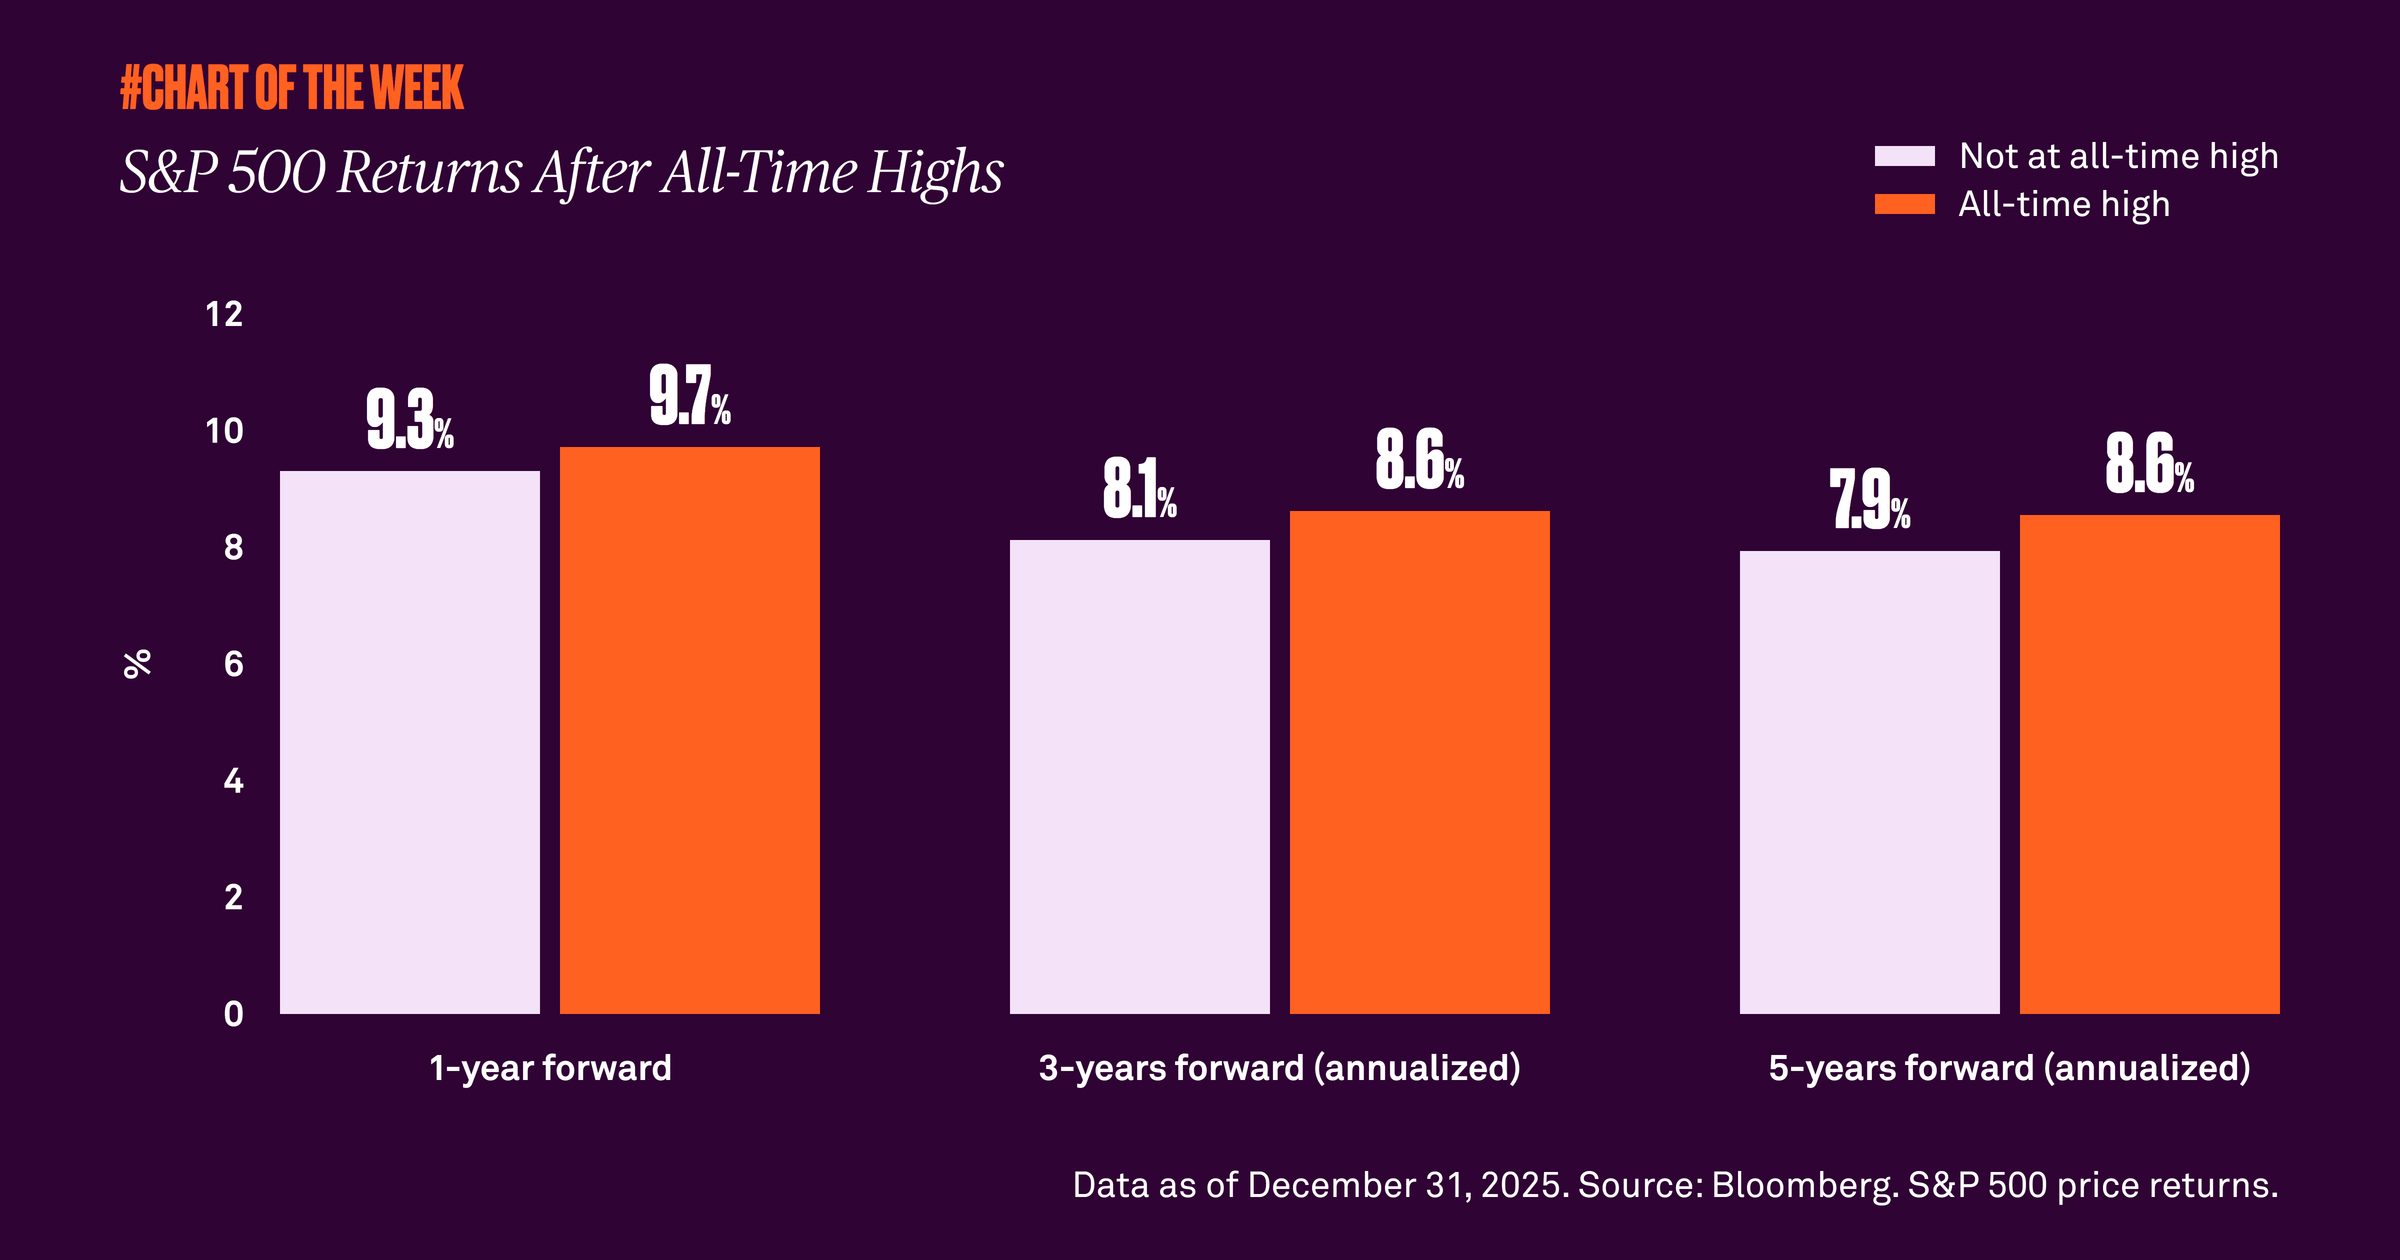
However, when markets reach new highs, some investors become overly cautious and conclude that the market has hit a ceiling. It’s therefore important to recognize that historically, forward returns after new all-time highs are higher on average than those following other days.

This is a key reason why we advise investors to stay invested at all times, including now. Even when faced with headlines on matters such as geopolitics, the labor market and artificial intelligence capital expenditures, looking past the noise and keeping a long-term perspective is the best way to build wealth.

RELATED CONTENT
Impact of geopolitics over time?
Chart of the week | Macroeconomic

Tensions between the U.S./Israel and Iran have recently boiled over into a military conflict, which has given many investors the jitters. However, our research shows that equity market pullbacks resulting from geopolitical events are often short lived with the S&P 500 typically higher in the months following these events.

Behind the numbers: Q4 GDP
Chart of the week | Macroeconomic

Gross domestic product undershot expectations last quarter, but the shortfall appears driven more by the temporary government shutdown than broad-based weakness. Consumer demand remains resilient, and with supportive fiscal policy, easing financial conditions and a steady labor market, the outlook points to a modest acceleration in economic activity this year.

Narrow drawdown?
Chart of the week | Macroeconomic

Equity volatility is rising, but all is not what it seems. The technology sector is weighing on the S&P 500 while value and cyclical stocks lead. A market rotation is underway as many investors begin to favor companies beyond tech.

Capex as a catalyst
Chart of the week | Macroeconomic

Improved business confidence and recent tax legislation are compelling corporations to reinvest their cash flows in their businesses. We believe this is a positive signal for economic growth.

Gathering data
Disclaimer Not Available

CONTACT US  |  +65 6432 0222