Please ensure Javascript is enabled for purposes of website accessibility S&P 500 Returns After All-Time Highs
lu
en
institutional
institutional
false
true
Gathering data
Disclaimer Not Available

S&P 500 Returns After All-Time Highs

S&P 500 Returns After All-Time Highs

The S&P 500 recently hit a new all-time high after a notable year of peaks in 2025. Is now the time for caution? History tells us attractive performance often follows record highs.  
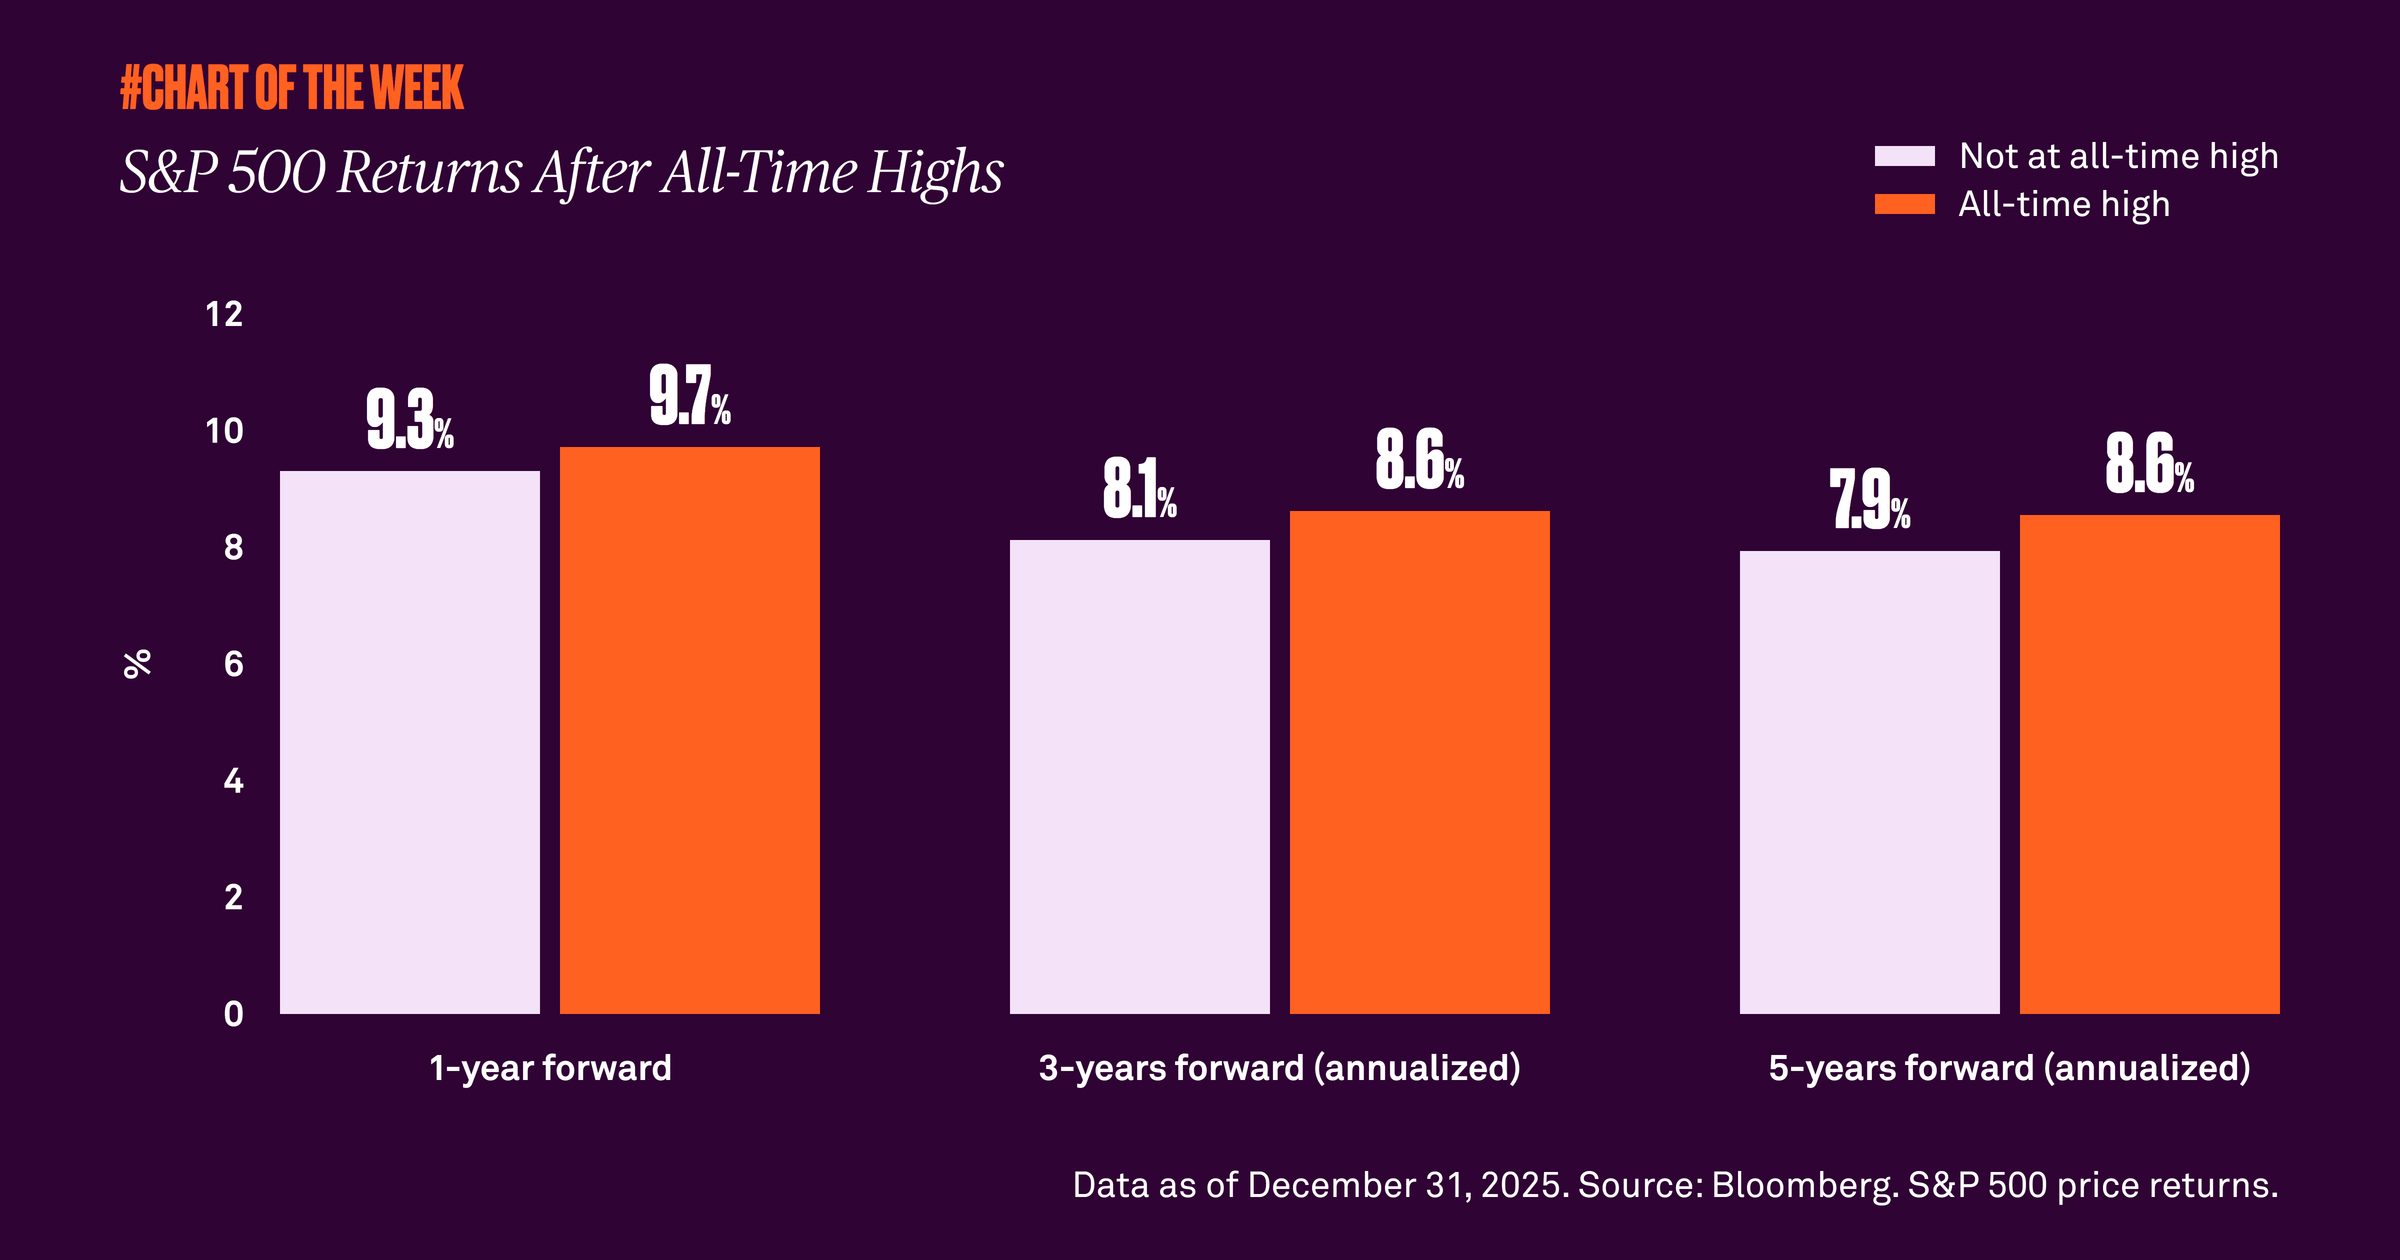

Last week, the S&P 500 set a record closing high that neared the still unbroached 7,000 level, after reaching a notable record of 39 all-time highs throughout 2025. Last year’s performance reflects the fifth most all-time highs in a year since 2000 and the 15th most in the entire history of the index.

However, when markets reach new highs, some investors become overly cautious and conclude that the market has hit a ceiling. It’s therefore important to recognize that historically, forward returns after new all-time highs are higher on average than those following other days.

This is a key reason why we advise investors to stay invested at all times, including now. Even when faced with headlines on matters such as geopolitics, the labor market and artificial intelligence capital expenditures, looking past the noise and keeping a long-term perspective is the best way to build wealth.
RELATED CONTENT
Getting real with real assets
Chart of the Week | Macroeconomic

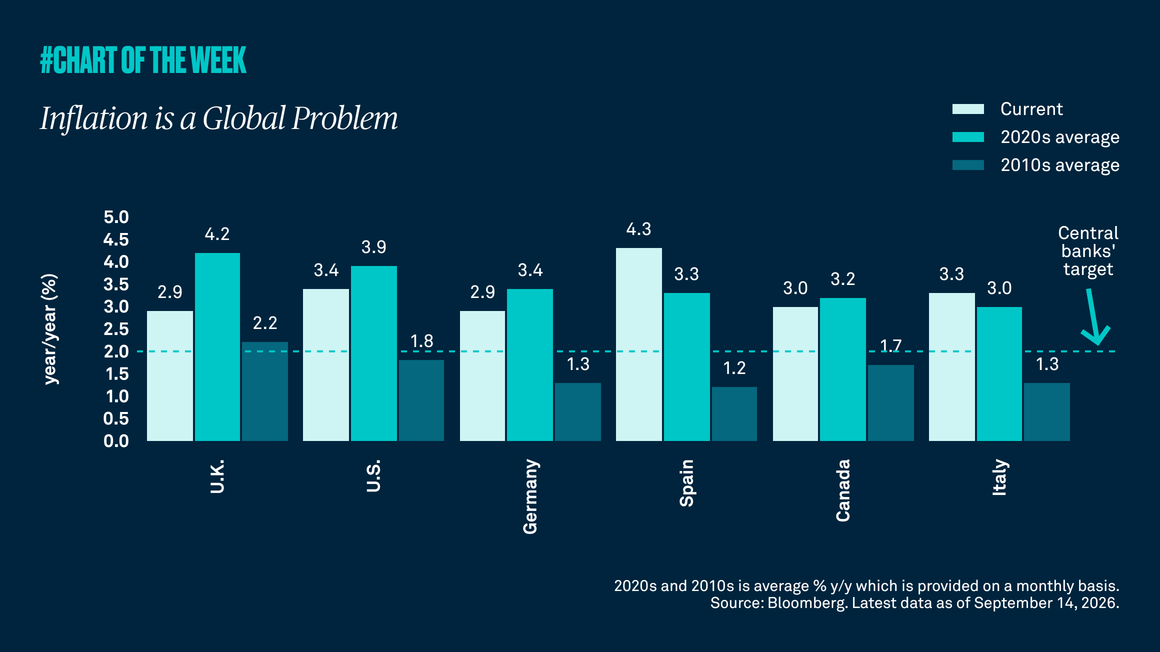
Inflation appears to have transitioned from its pre-Covid average of 2% to a stickier point closer to 3%, and we do not expect a near-term return to prior levels. In this environment, we believe real assets, such as commodities, infrastructure and REITs, can provide inflation protection, diversification and return potential.

Not in a bubble
Chart of the Week | Macroeconomic

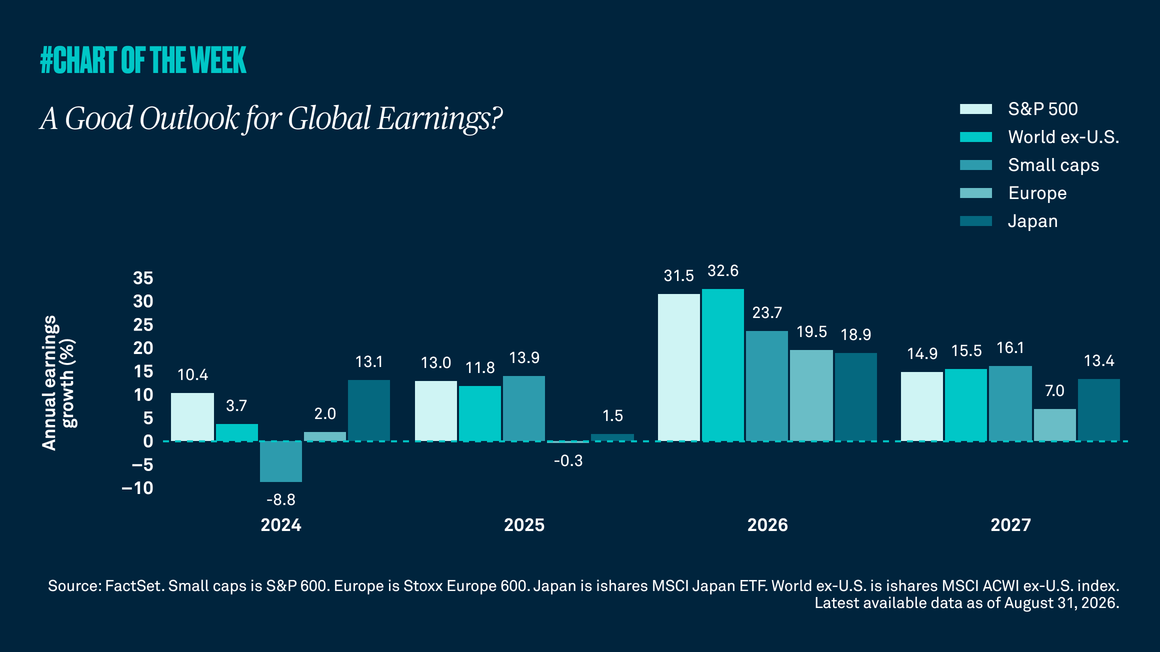
As the S&P 500 approaches all-time highs, there are renewed concerns among investors about elevated valuations. However, historically strong profitability and expected earnings growth appear to support current pricing. In addition, the current S&P 500 price-to-earnings (P/E) ratio is roughly equal to the average since Covid. As a result, we do not view U.S. equities as being in bubble territory and we remain constructive on the asset class.

Is the market rally broadening?
Chart of the Week | Macroeconomic

Stocks, as measured by the S&P 500, are up over 13% through early August. The solid gains have been fueled by a resilient economy, steady consumer spending, optimism around artificial intelligence and better-than-expected earnings growth. Still, some investors worry the advance may be too concentrated in technology and that AI-capex monetization may fall short of expectations. A closer look suggests that it is not just tech moving the market higher.

Fed friction?
Chart of the Week | Macroeconomic

Markets are navigating tensions between a Fed that offers less guidance and an inflation backdrop that remains sticky. Added uncertainty from Middle East tensions and energy-price swings is further shaping sentiment, with recent moves in Treasury yields suggesting the market wants the Fed to hike. However, with yield volatility expected to linger in the near term, we see today’s elevated Treasury yields as an especially compelling opportunity in fixed income.

Gathering data
Disclaimer Not Available

This is a marketing communication