
Advanced economies are grappling with historically high levels of sovereign debt. The debt sustainability was less concerning a decade ago when rates were at historic lows, coupled with ample demand from quantitative easing (QE). However, recent inflation shocks, higher rates, quantitative tightening, and political and economic pressures for expansive fiscal policies have revived questions about fiscal sustainability and its implications for investors.
While we do not see a near-term catalyst for fiscal shock, countries with unsustainable debt dynamics and little political appetite for adjustment are likely to face a gradual buildup of risk premia in their sovereign debt markets.
Elevated Debt Burdens and Persistent Fiscal Pressures
Developed market governments are likely to maintain an expansionary fiscal stance, driven by strategic priorities such as AI infrastructure investment, defense modernization, and the reshoring of critical supply chains.
U.S.
The One Big Beautiful Bill Act (OBBBA) is projected to add $4.1 trillion to the national debt over the next decade, pushing the debt-to-GDP ratio from 100% to over 125%. Current tariff policies are projected to raise roughly $2 trillion over the coming decade, after accounting for substitution effects, only partially mitigating the anticipated budget deficits.
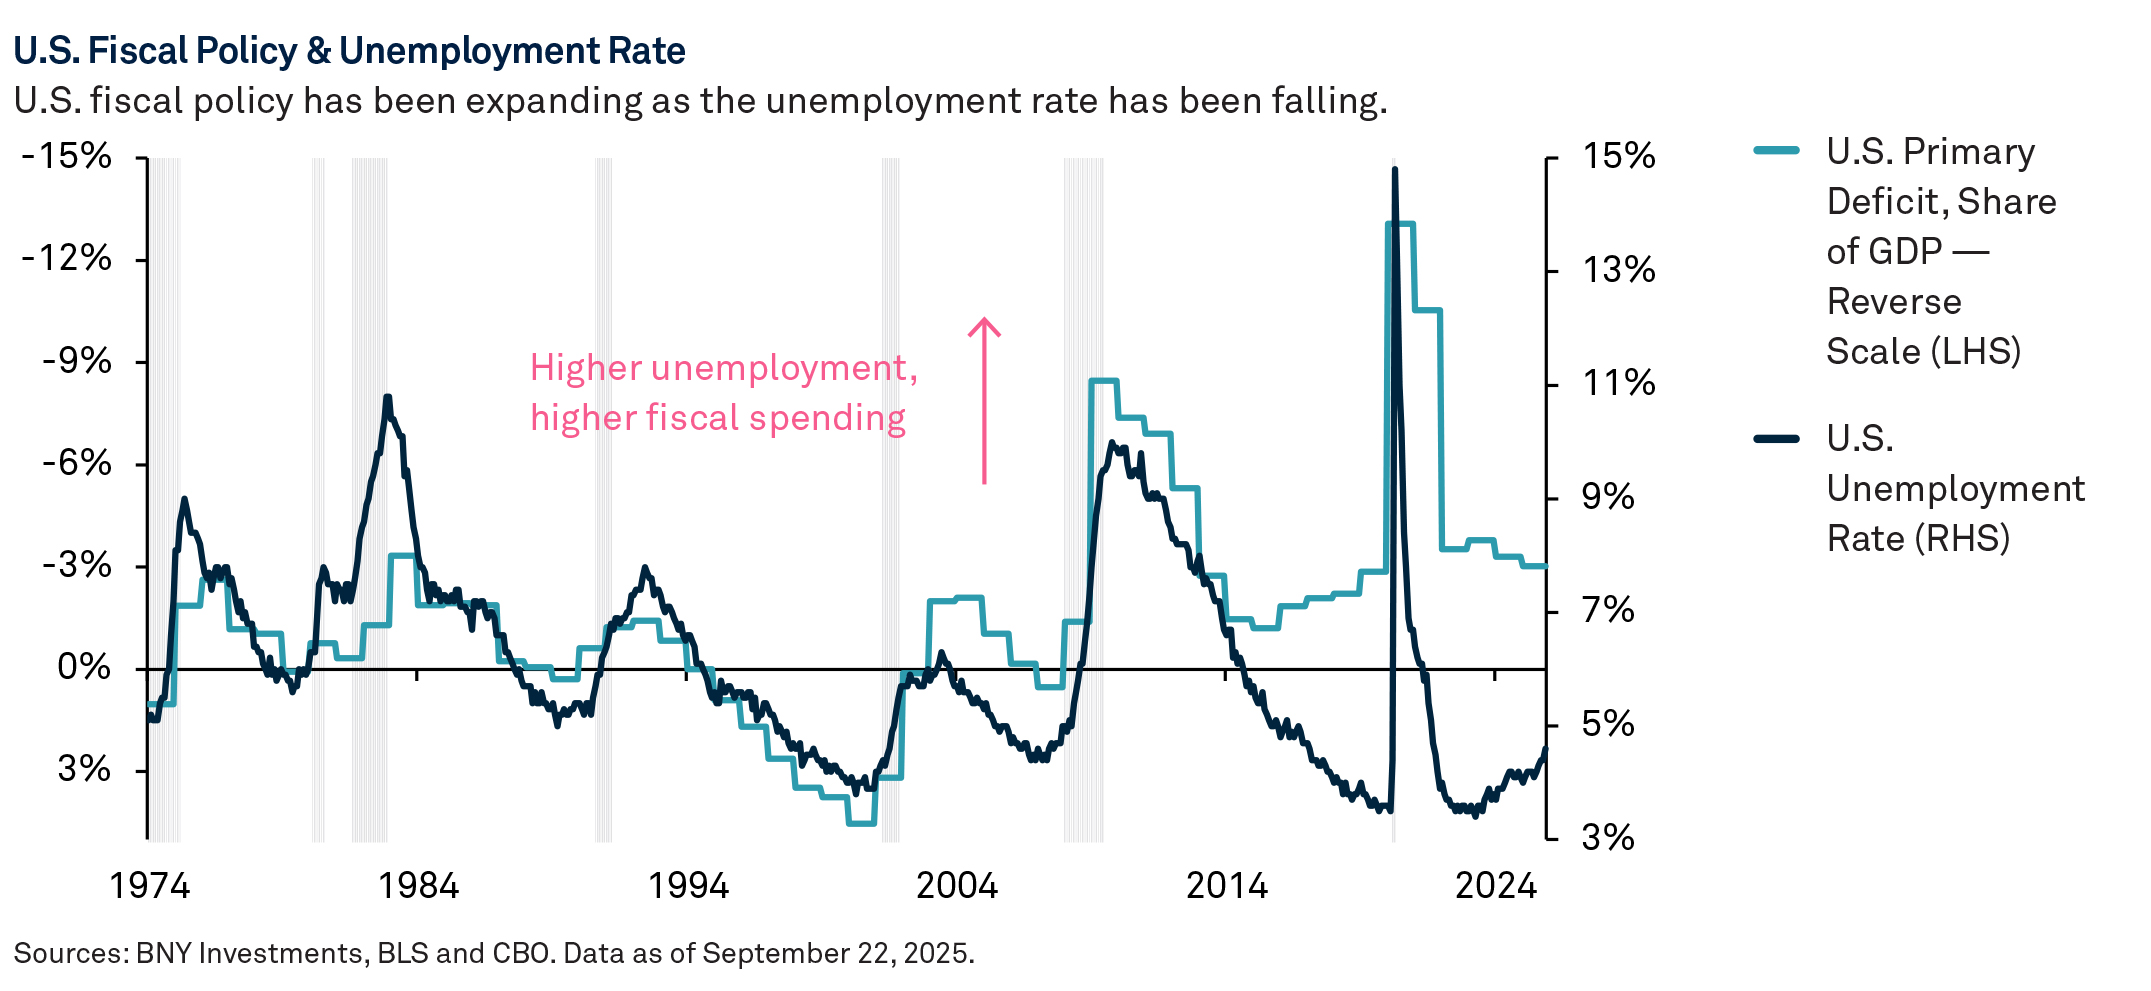
However, much of the tax bill is temporary by design, which will set in motion a series of fiscal cliffs, forcing lawmakers to either extend key provisions or let them expire. Historically, fiscal policy was countercyclical (loosened during economic downturns) as the government stepped in to boost aggregate demand. However, we observe fiscal policy has become procyclical (higher government spending during high GDP growth) circa the passing of the Tax Cuts and Jobs Act (TCJA). As fiscal cliffs near, a pro-cyclical fiscal stance risks further steepening the debt trajectory.
Japan
Japan has one of the highest debt-to-GDP ratios in the world, exceeding 200%. For decades, this dynamic has coexisted with low interest rates. However, the Bank of Japan (BOJ) implemented quantitative tightening in late 2024, effectively reversing the course of its extensive bond-buying program, which once accounted for nearly half of outstanding government debt.
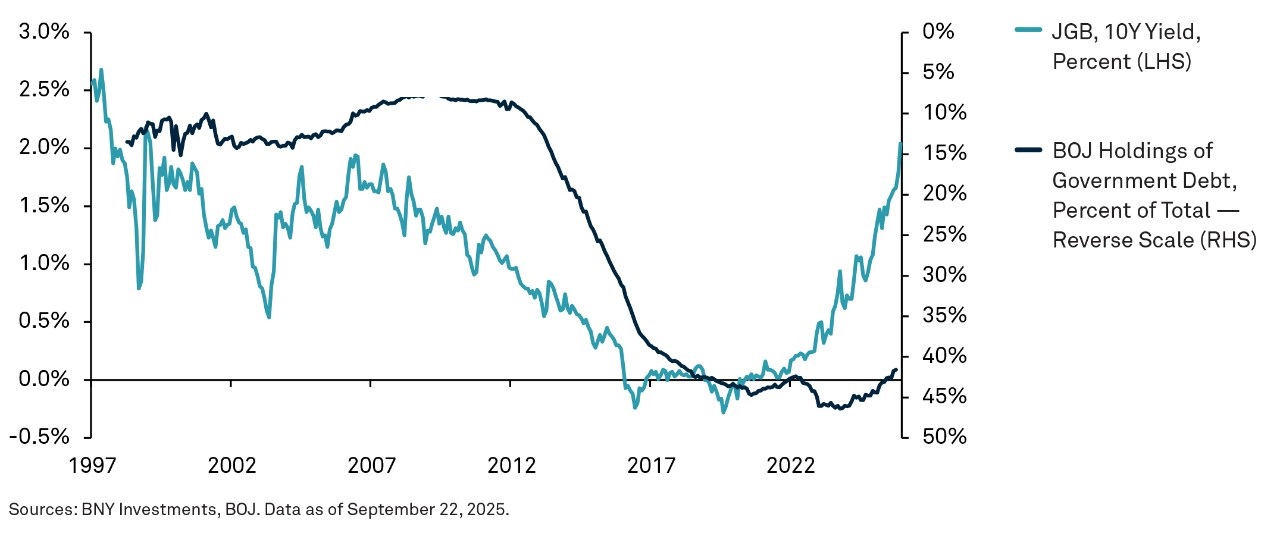
BOJ Holdings of Japanese Government Bonds (JGBs) & 10-Year JGB Yields
The BOJ began tapering its bond purchases in late 2024, effectively reversing the course of its extensive bond-buying program.
With BOJ demand plateauing, the burden of absorbing new JGB issuance is increasingly falling on large domestic institutions and foreign investors, particularly for the long end of the curve. The JGB market faces both liquidity and sustainability risks with gross financing needs over 30% of GDP, creating two main questions.
First, who will step in to meet the increase in net supply while the BOJ normalizes policy? Historically, pension funds and life insurers would be first in line to absorb excess issuance. While these traditional buyers of excess issuance still hold around 18% of outstanding JGBs, their role has diminished over time, mostly due to domestic reforms. Now, demand from both the central bank and domestic institutions is falling, which means excess supply, likely leading to lower bond prices and higher yields.
The second question is, how will elevated debt coexist with higher cost of debt? For most of the recent past, Japan lived with a high debt-to-GDP ratio without many consequences, largely due to record-low interest rates as the BOJ controlled the yield curve. But the BOJ’s tapering of bond purchases suggests it has abandoned yield curve control for now.
Meanwhile, fiscal policy, traditionally a lever for managing the debt-to-GDP ratio, may be less effective in this capacity for now, as the new prime minister is a fiscal dove. Japan’s supplementary budget highlights an additional spending package just shy of ¥18 trillion ($116 billion), about ¥4 trillion more than the previous year. To stabilize its debt burden, Japan may ultimately need stronger GDP growth driven by productivity gains. Persistently large fiscal impulses or stagnant growth can eventually lead to structural premiums in long-end yields, which has the potential to increase volatility and steepen the curve.
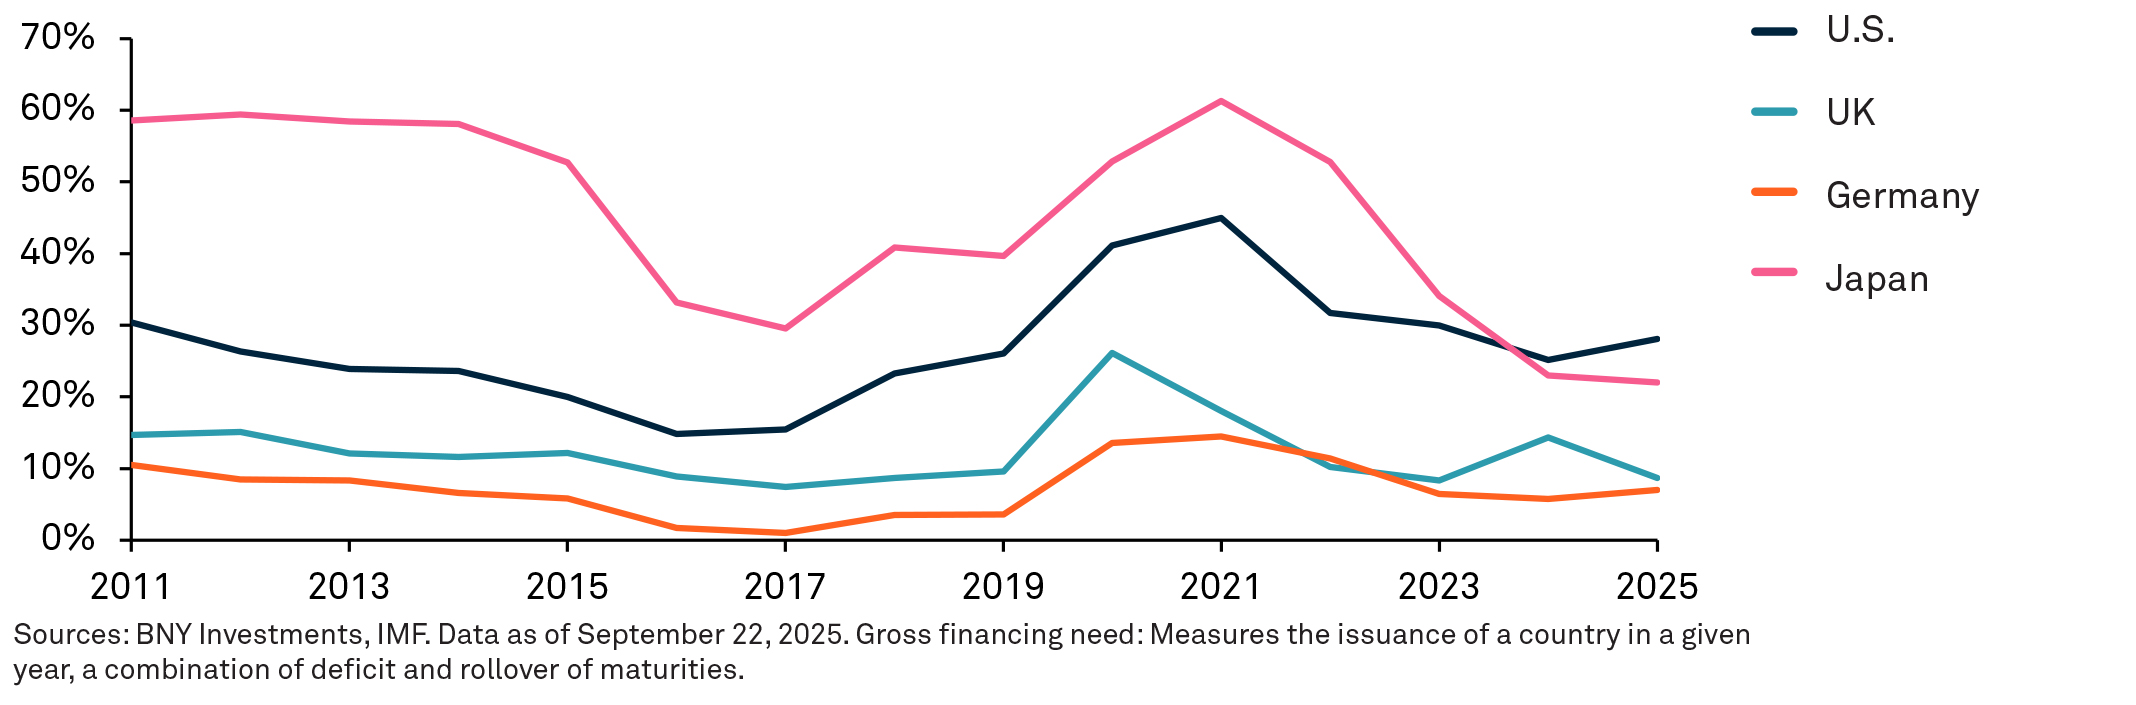
Gross Financing Need
Percent of GDP
Japan and the U.S. stand out as at-risk from a drying up of bond demand, with gross financing needs over 30% of GDP.
UK
The UK faces a similar backdrop with demand for duration softening. Defined benefit pension schemes, core buyers of long-dated gilts, are holding a smaller share of the market. While they remain key purchasers, these institutions’ demand has not kept up with gilt issuance, which has climbed as the UK’s debt-to-GDP ratio has risen. At the same time, many schemes are now in surplus and facing government encouragement to invest surplus assets in growth-oriented projects.
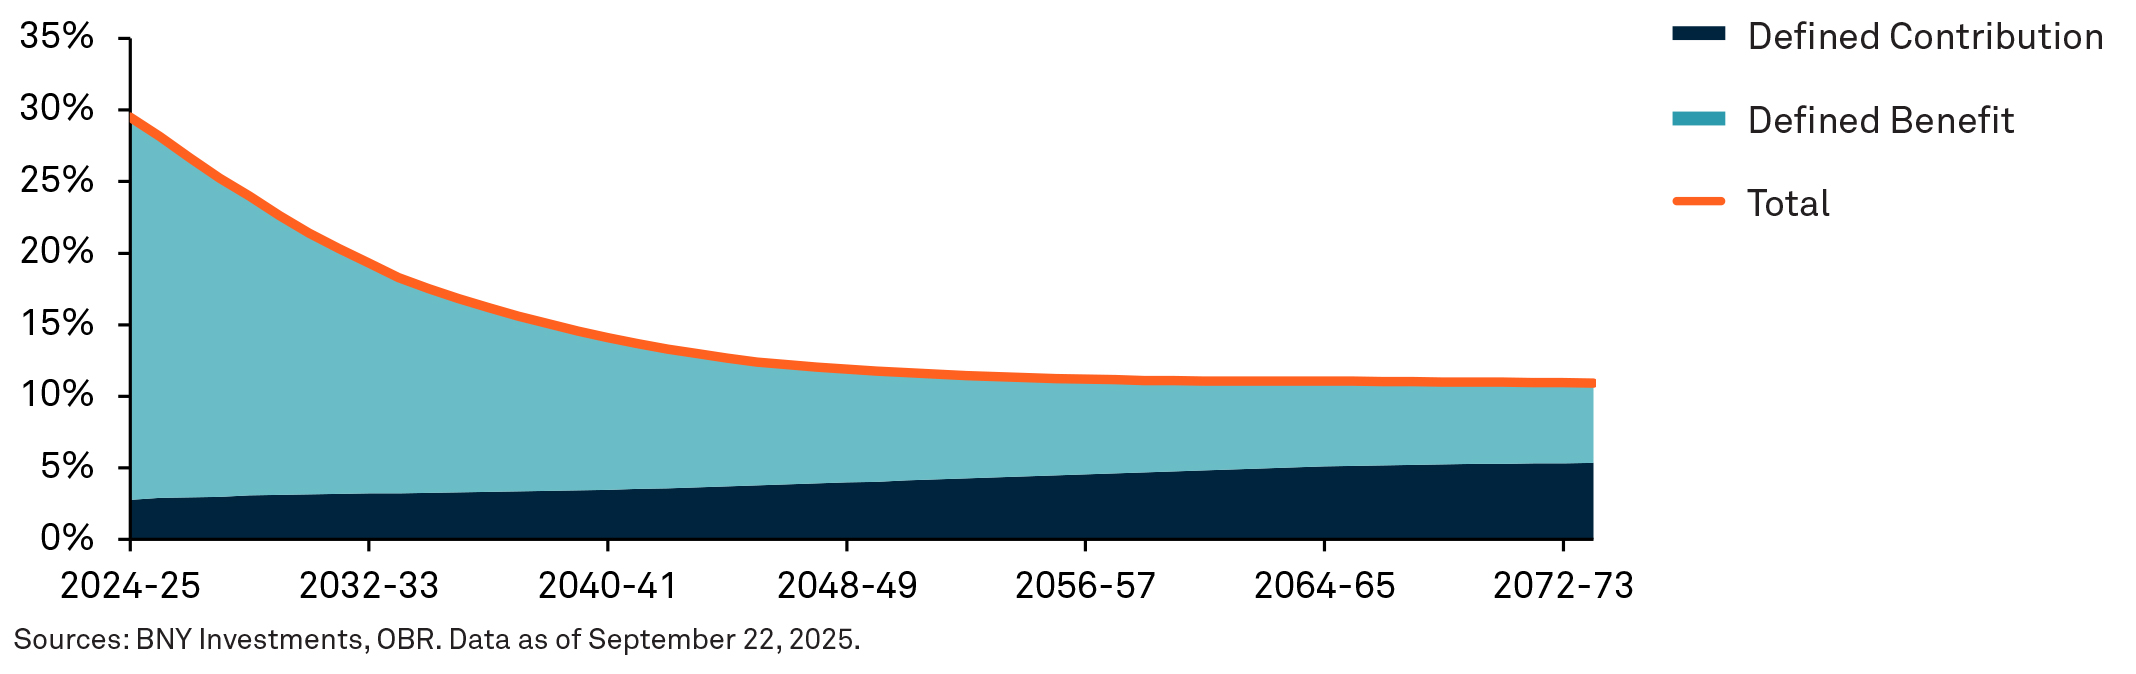
The rise in defined contribution schemes is unlikely to make up for the reduced demand as these portfolios tend to be more growth oriented. The UK’s Office for Budget Responsibility (OBR) projects pension sector gilt holdings could more than halve as a share of GDP by the early 2070s. Insurance buyouts are further shifting investment from gilts to other assets.
Projected Gilt Holdings
Percent of GDP
The OBR projects pension sector gilt holdings could more than halve as a share of GDP by the early 2070s.
Europe ex-UK
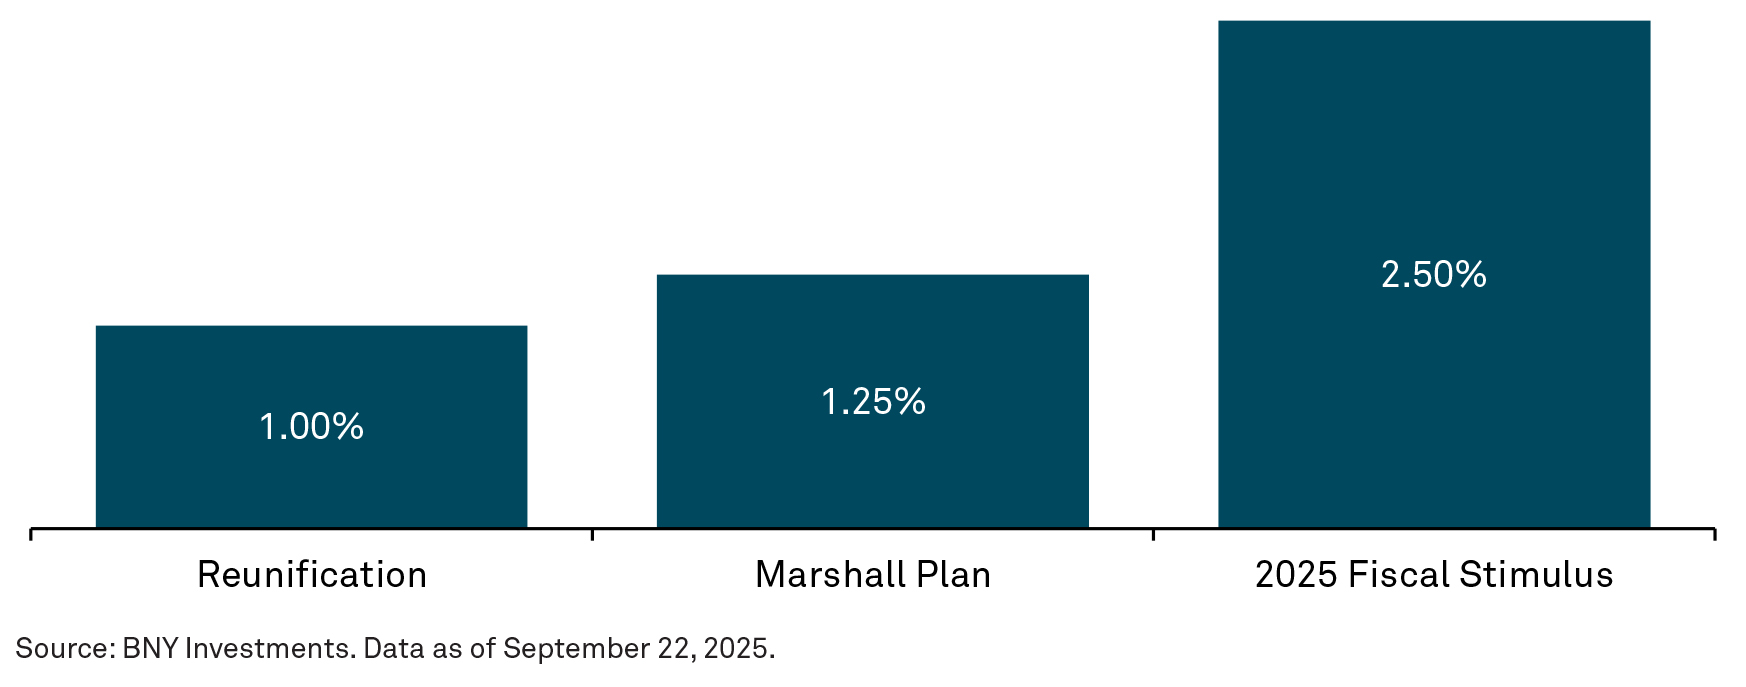
In March 2025, the German government approved a constitutional amendment to exempt defense spending above 1% of GDP from borrowing limits and establish a €500 billion extrabudgetary fund for infrastructure and climate investment. This represents a significant loosening of Berlin’s constitutional “debt brake,” which surpasses the post-WWII Marshall Plan and the 1990s reunification stimulus. Implications of an increase in debt-to-GDP are highly dependent on allocating resources to productivity-improving projects. According to Fitch Ratings, Germany’s debt-to-GDP ratio is forecast to climb to nearly 70% by 2027 from its 2024 level of 64%, testing the limits of its AAA credit rating (the AAA median debt-to-GDP ratio is currently 36.5%).
Germany Fiscal Stimulus in Perspective
Percent of GDP
The post-Cold War model of maintaining fiscal leeway by minimizing defense spending under the U.S. security umbrella, while relying on inexpensive Russian energy and access to the Chinese market, has been upended by geopolitics. NATO defense spending targets (reaching 5% of GDP by 2035) are poised to boost spending by member states.
Slower Growth and Higher Interest Costs Squeeze Governments
To understand the trajectory of sovereign debt, we provide a formula that relates changes in government debt (d) to the cost of debt (r), nominal growth rate (g),and primary surplus (s).
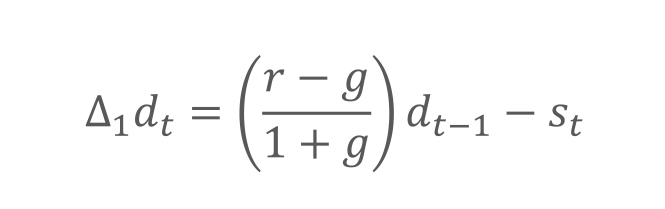
As we explored earlier, governments can control the growth of debt-to-GDP by one or more of the following:
Controlling the interest rate (r) via credibly lowering interest rates or exercising financial repression strategies.
Increasing nominal GDP growth (g) either via inflation or higher real growth.
Running tighter fiscal policy via higher primary surplus/lower primary deficit (s).
The differential between cost of debt and growth (the r-g gap) largely denotes the sustainability of a country’s fiscal policy, even more so when the country runs a fiscal deficit, as is the current case with most developed markets. When interest rates are less than growth, or r < g, a country with a primary deficit can offset an increase in its debt burden by simply growing faster. When the cost of debt is greater than rate of growth, or r > g, with a given primary deficit, a country’s debt burden inexorably rises due to rising interest costs.
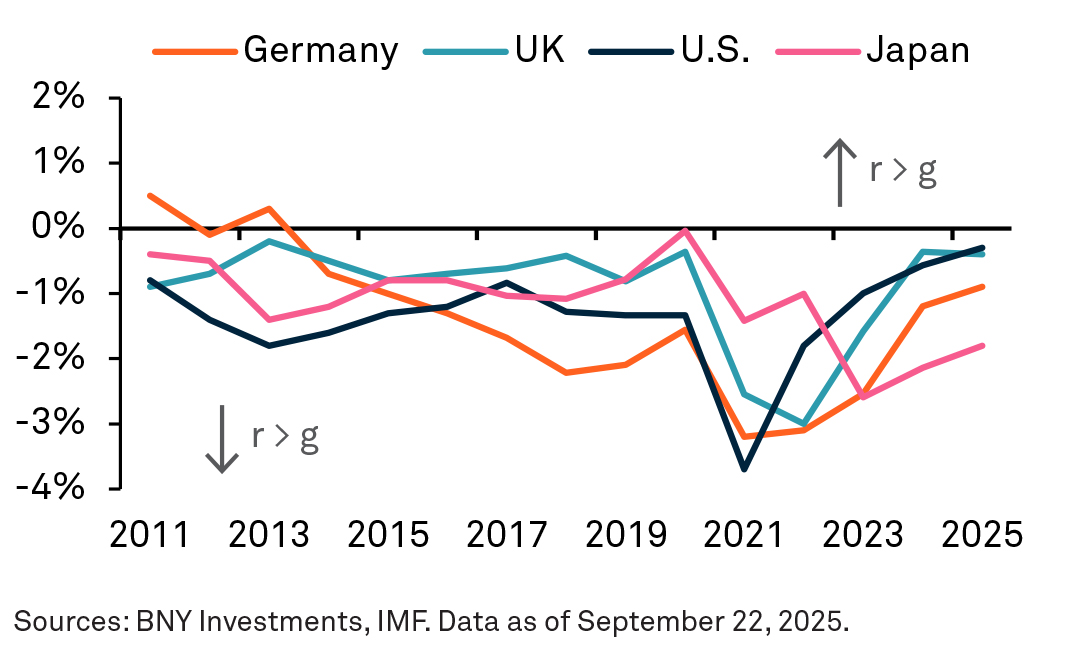
Currently, this r-g gap remains favorable in major economies (i.e., r < g), and there is fiscal space to run primary deficits. However, according to IMF projections, interest costs are expected to narrow while primary budget balances are expected to deteriorate, apart from in the UK. As the r-g differential shrinks, the risk of a fiscal reckoning increases, especially for economies with limited flexibility to cut spending or boost revenue (monetize assets).
Projected Interest Rate-Growth Differential Next Five Years
The r-g gap remains negative (i.e., fiscal space to run primary deficits); however, is expected to narrow.
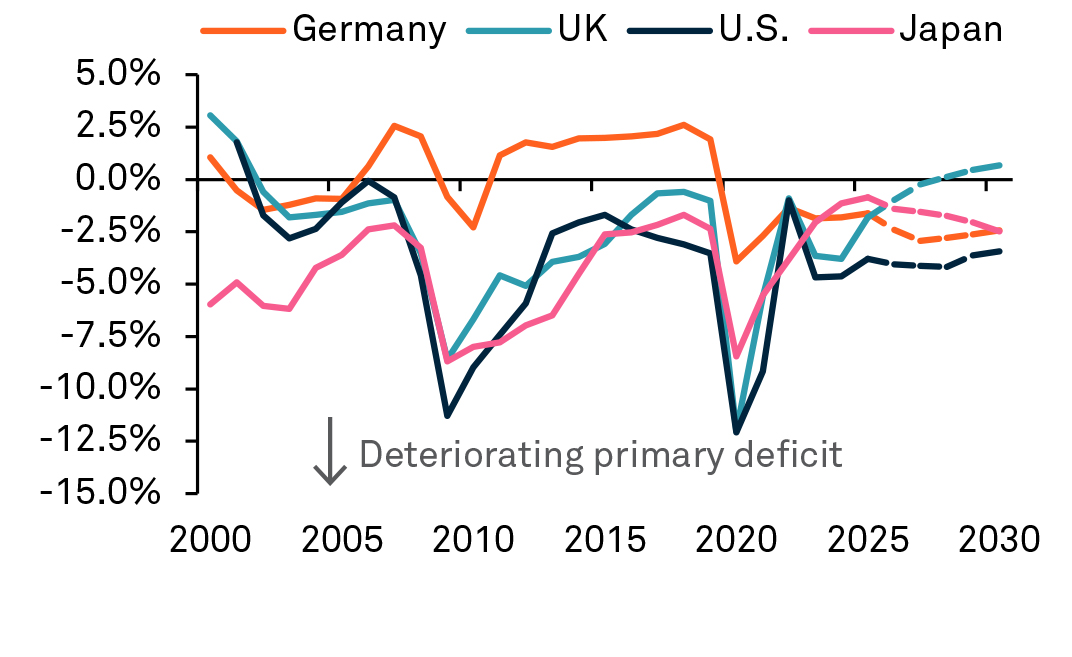
Primary Budget Balance
Percent of GDP
Primary budget balance is expected to deteriorate, except in the UK.
Two Levers for Policy
We believe there are two main levers a country can realistically pull to manage the sustainability of its sovereign debt burden. The first is gradual public sector deleveraging through deficit reduction (i.e., increase s), coupled with policies that stimulate private sector growth via productivity gains or controlled re-leveraging. This is considered an economically sound way to increase g.
The second more direct, albeit riskier, approach is managing elevated sovereign debt through the artificial suppression of interest rates (i.e., lowering r), potentially through financial repression strategies. These can range from forced debt absorption by domestic institutions and households (such as by the issuance of debt at below market rates, or non-marketable securities) to unorthodox strategies such as yield curve control, which can raise perceptions of currency debasement.
These mechanisms may temporarily ease debt servicing costs, but each strategy carries distinct inflationary risks and credibility costs. Crucially, for such an approach to succeed in reducing the debt burden, without undermining price stability, inflationary shocks would need to be one-offs in nature and quickly revert to target, with inflation expectations remaining firmly anchored.
Implications for Bond Markets
We anticipate a gradual easing of developed market policy rates. At the same time, fiscal policy is likely to remain expansionary, driven by public investment demand for energy infrastructure and economic reshoring. However, without a clear focus on balancing capital deployment with debt sustainability, bond investors may demand greater fiscal discipline, a potential risk for bond markets that could keep long-end yields elevated or drive them even higher.
This is an excerpt from our 2026 report, Capital Market Assumptions: Endurance Under Pressure
For further discussion and in-depth analysis, read the full report.

FOR INSTITUTIONAL, PROFESSIONAL, QUALIFIED INVESTORS AND QUALIFIED CLIENTS.
Disclosure
CAPITAL MARKET ASSUMPTIONS
The capital market assumptions are BNY Advisors’ estimates based upon historical market performance and the current market environment. References to future expected returns are not promises of actual returns that may be realized and should not be relied upon. Actual returns may vary significantly. In addition, the historical returns used as a basis for this analysis are based on information gathered by BNY or from third-party sources and have not been independently verified.
The forecasts contained herein are for illustrative purposes only and are not guarantees of performance. The forecasts have inherent limitations because they are not based on actual transactions. The forecasts are based upon historical returns of the selected investments and subjective estimates and assumptions about circumstances and events that may not have taken place and may never do so.
Some of the factors that could impact these forecasts include, but are not limited to:
- General economic conditions
- Financial market performance
- Interest rate levels
- Changes to current laws or regulations, and
- Future geopolitical conditions
Asset class returns are not reflective of anticipated returns for associated indexes.
The results do not represent, and are not necessarily indicative of, the results that may be achieved in the future.
Robust Strategic Asset Allocation (RSAA) is a framework for classifying the market environment with a combination of macroeconomic and market indicators with judgment. BNY Advisors has defined historical regimes for the period starting in May 1973.
The asset classes referenced in our capital market assumptions are represented by broad-based indices which have been selected because they are well known and are easily recognizable by investors. Indices have limitations because indices have volatility and other material characteristics that may differ from an actual portfolio. For example, investments made for a portfolio may differ significantly in terms of security holdings, industry weightings and asset allocation from those of the index. Also, the indices noted in this presentation are unmanaged, are not available for direct investment, and are not subject to management fees, transaction costs or other types of expenses that a portfolio may incur. Finally, the performance of the indices reflects reinvestment of dividends and, where applicable, capital gain distributions. Therefore, investors should carefully consider these limitations and differences when evaluating the index performance.
The indices may be trademarks of various organizations and in those cases have been licensed for use by BNY and are used solely herein for comparative purposes. The foregoing index licensers are not affiliated with BNY, do not endorse, sponsor, sell or promote the investment strategies mentioned in this presentation and they make no representation regarding advisability of investing in the strategies described herein. Description of the indices are available upon request.
RISKS
All investments involve risk including loss of principal. Certain investments involve greater or unique risks that should be considered along with the objectives, fees, and expenses before investing.
Asset allocation and diversification cannot assure a profit or protect against loss.
FOR INSTITUTIONAL, PROFESSIONAL, QUALIFIED INVESTORS AND QUALIFIED CLIENTS ONLY.
The information contained herein reflects general views and is provided for informational purposes only. This material is not intended as investment advice nor is it a recommendation to adopt any investment strategy.
Opinions and views expressed are subject to change without notice.
Past performance is no guarantee of future results.
ISSUING ENTITIES
This material is only for distribution in those countries and to those recipients listed, subject to the noted conditions and limitations: • United States: by BNY Mellon Securities Corporation (BNYSC), 240 Greenwich Street, New York, NY 10286. BNYSC, a registered broker-dealer and FINRA member, has entered into agreements to offer securities in the U.S. on behalf of certain BNY Investments firms. • Europe (excluding Switzerland): BNY Mellon Fund Management (Luxembourg) S.A., 2-4 Rue Eugène Ruppert L-2453 Luxembourg. • UK, Africa and Latin America (ex-Brazil): BNY Mellon Investment Management EMEA Limited, BNY Mellon Centre, 160 Queen Victoria Street, London EC4V 4LA. Registered in England No. 1118580. Authorised and regulated by the Financial Conduct Authority. • South Africa: BNY Mellon Investment Management EMEA Limited is an authorised financial services provider. • Switzerland: BNY Mellon Investments Switzerland GmbH, Bärengasse 29, CH-8001 Zürich, Switzerland. • Middle East: DIFC branch of The Bank of New York Mellon. Regulated by the Dubai Financial Services Authority. • South East Asia and South Asia: BNY Mellon Investment Management Singapore Pte. Limited Co. Reg. 201230427E. Regulated by the Monetary Authority of Singapore. • Hong Kong: BNY Mellon Investment Management Hong Kong Limited. Regulated by the Hong Kong Securities and Futures Commission. • Japan: BNY Mellon Investment Management Japan Limited. BNY Mellon Investment Management Japan Limited is a Financial Instruments Business Operator with license no 406 (Kinsho) at the Commissioner of Kanto Local Finance Bureau and is a Member of the Investment Trusts Association, Japan and Japan Investment Advisers Association and Type II Financial Instruments Firms Association. • Brazil: ARX Investimentos Ltda., Av. Borges de Medeiros, 633, 4th floor, Rio de Janeiro, RJ, Brazil, CEP 22430-041. Authorized and regulated by the Brazilian Securities and Exchange Commission (CVM). • Canada: BNY Mellon Asset Management Canada Ltd. is registered in all provinces and territories of Canada as a Portfolio Manager and Exempt Market Dealer, and as a Commodity Trading Manager in Ontario. All issuing entities are subsidiaries of The Bank of New York Mellon Corporation.
NOT FDIC INSURED | NO BANK GUARANTEE | MAY LOSE VALUE
© 2026 THE BANK OF NEW YORK MELLON CORPORATION
BABR-880200-2026-02-04 | GU-796 - 15 February 2027