The AI revolution is not just a tech story; it is a capital allocation story, and private markets are at the center of an AI-driven capital expenditure boom. Given AI’s infrastructure requirements from data centers and semiconductor fabricators to energy infrastructure, private investment should become a facilitator of AI adoption, creating significant investment opportunities for investors.
AI as a Capital Allocation Story
In 2024, global venture capital (VC) funding for AI startups surged to $131.5 billion, marking a 52% increase year over year.1 Landmark deals, such as Databricks ($10 billion),2 Anthropic ($13 billion),3 and OpenAI (close to $7 billion),4 underscore the scale of private investment flowing into foundational models and infrastructure. This deal flow reflects confidence in AI as a dynamic sector with significant growth potential.
We are also seeing more partnerships between large tech companies and startups, as corporations tap into the VC sector for R&D and selective acquisitions, expanding exit opportunities for early investors. Additionally, crossover public-private investment in later-stage rounds helps to temper bubble concerns by estimating value from cash flow fundamentals and comparable valuations rather than speculation.
AI Drives Infrastructure Spending
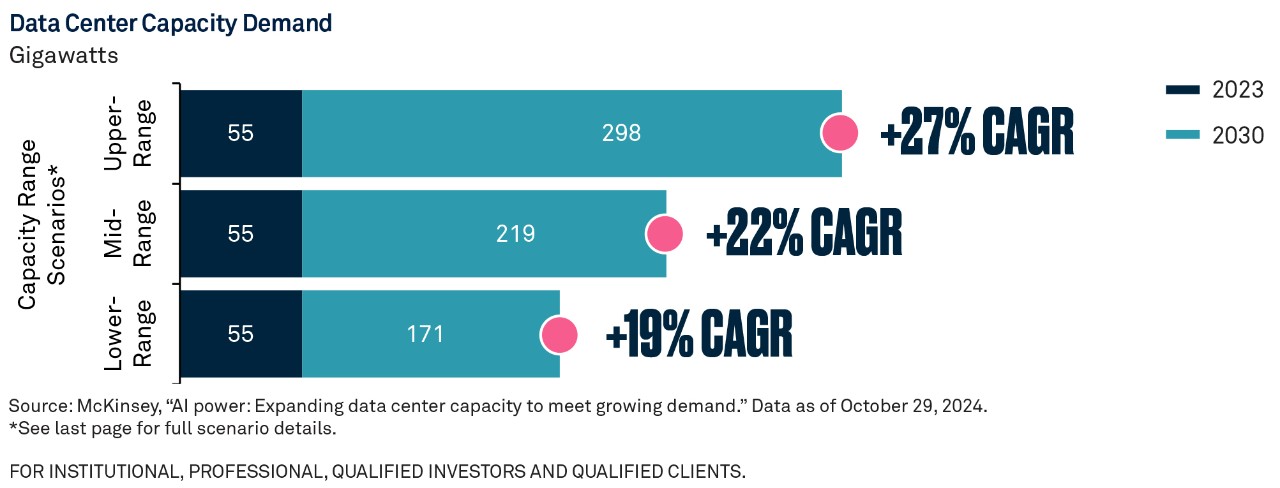
AI’s potential for productivity growth is fueling unprecedented demand for data centers, semiconductor facilities, and energy systems critical in supporting the computationally intensive workloads of AI. The top five hyperscalers spent over $215 billion on data center infrastructure in 2024 — a 50% year-over-year increase.5 As shown in the chart on the previous page, data center capacity is expected to grow at a CAGR of 19% to 27% through 2030.6 This creates significant opportunities for private real asset funds to invest in the initial buildout of the AI ecosystem.7
Energy & Electricity Requirements
The energy implications from AI are profound. U.S. data centers consumed 176 terawatt-hours (TWh) of electricity in 2023, accounting for 4.4% of total national energy usage. That figure is projected to rise at a much faster rate, to between 7% and 12% of total U.S. consumption by 2028.8 Meeting this demand requires private investment in energy infrastructure, including natural gas, independent power producers, and renewables. Private real asset funds are well-positioned to capitalize on this trend.
Private Market Vehicles for Infrastructure
Private equity and venture capital remain key funders of startups and are well-suited for long-term, active investments in AI infrastructure. They are increasingly complemented by private infrastructure and real estate funds, which offer inflation-linked returns and exposure to secular trends in energy and data.
Private Credit: A Bigger Deal
Over the last three decades, private credit has evolved from a niche allocation to a core component of corporate financing. While the number of FDIC-insured banks fell from 14,434 in 1980 to approximately 4,200 in 2024,9 private credit funds stepped in to supply middle-market companies with flexible capital. Filling this disintermediation gap pushed assets under management in private credit to approximately $1.7 trillion by 2025.10
Rise of Direct Lending
Direct lending - privately negotiated loans typically secured as senior debt from asset managers by middle-market companies - has become one of the fastest-growing segments of private credit. Transactions now routinely exceed $1 billion and offer a compelling alternative to public markets or syndicated loans. Borrowers benefit from faster execution, tailored terms, and reduced syndication risk, while lenders benefit from higher interest rates and an illiquidity premium. Private credit has historically delivered a 200–300 basis point premium over public debt.11
Asset-Backed Lending as a Complement
Asset-backed lending - another subset of private credit - has also gained traction and complements direct lending by offering loans secured by tangible assets such as inventory, receivables, and equipment. The global asset-based lending market was valued at $661.7 billion in 2023 and is projected to grow at a CAGR of over 11% through 2032.12 These loans offer front-loaded cash flows and reduced correlation to public markets, enhancing diversification and income generation.
Private vs. Public Markets: Shifting Capital Formation
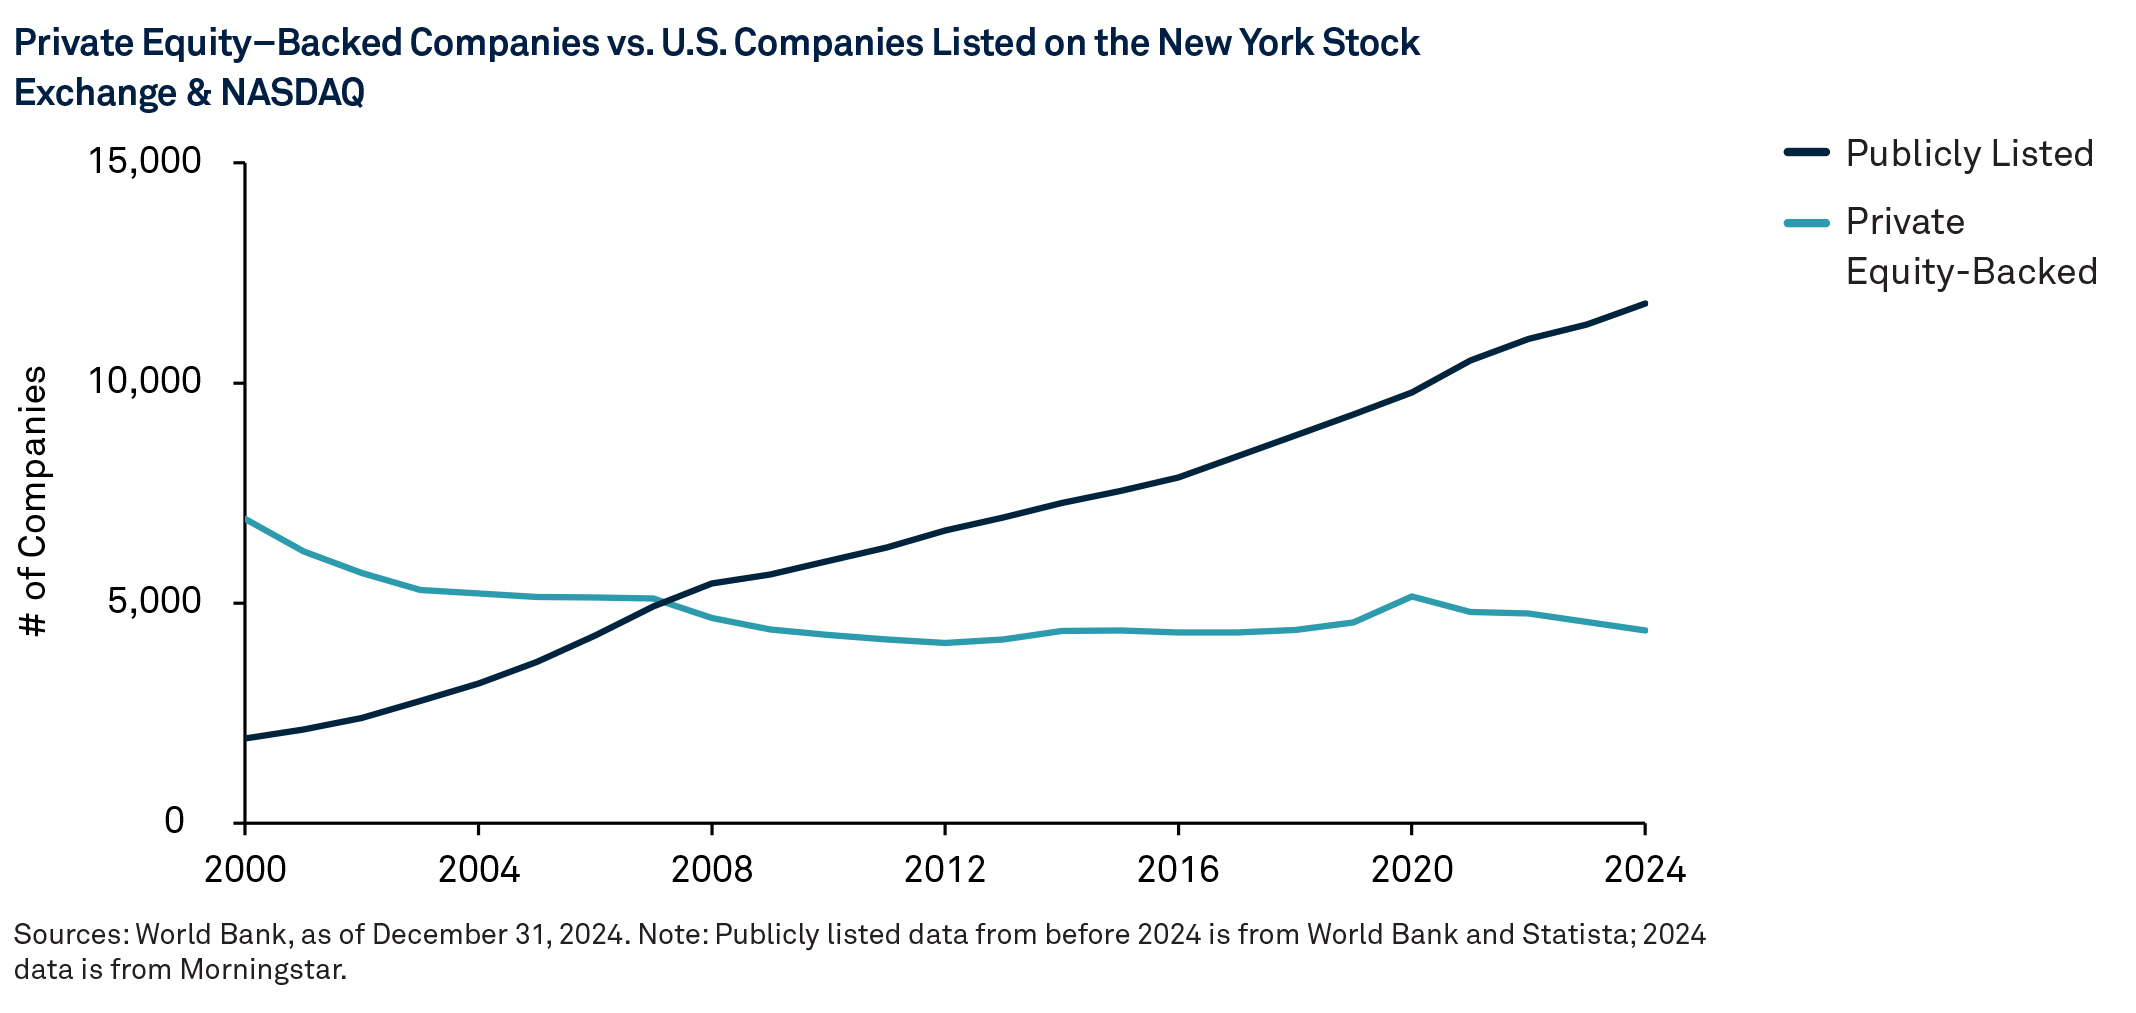
The structural shift in capital formation is reshaping where value is created. More companies are choosing to remain private for longer, allowing more growth to occur before reaching public markets. This shift is reflected in market composition. As of December 2024, there are almost three times as many U.S. companies with private equity-backing than public listings.13 Many firms opt to remain private to retain strategic flexibility and avoid the regulatory burden that comes with a public listing, while maintaining access to capital with potentially favorable terms.
This backdrop has important implications for investors. With fewer companies entering public markets and more value creation happening privately, investors are increasingly looking beyond traditional markets to access the full spectrum of growth opportunities.
Private Markets: Finding Value
With more value creation happening before companies go public, early-stage growth is shifting from small-cap stocks to private investors. As a result, venture capital and growth equity strategies are capturing much of the dynamic opportunity set that once fueled the small-cap premium. This shift has compressed public market returns while expanding access to high-growth potential for private investors.
Within private markets, venture capital continues to thrive -particularly in sectors like technology, health care, and energy. In fact, AI startups captured 53% of all global venture capital dollars in the first half of 2025, with that percentage jumping to 64% in the U.S.14 The post-2021 valuation reset has created a more investor-friendly environment, characterized by higher-quality entrants and more favorable deal terms.
Growth equity complements this trend by targeting founder-led businesses with scalable models in transformative sectors such as technology, health care innovation, and energy transition. By remaining private longer, these companies can scale efficiently before public exposure, allowing investors to benefit from extended growth cycles and stronger return profiles.15
Concentrated Public Markets: Strategies for Risk Management
Meanwhile, public markets are becoming increasingly concentrated. With fewer companies going public, leading stocks now hold a larger share of the market, raising portfolio risk, especially for investors with meaningful exposure to mega-cap names. Hedge fund strategies, particularly long-short equity strategies, can play an effective role in helping investors diversify from crowded exposures while hedging market-wide drawdowns. These strategies can serve as a complementary risk management tool in an environment where public market performance is dependent on an increasingly narrow set of companies.
This is an excerpt from our 2026 report, Capital Market Assumptions: Endurance Under Pressure
For further discussion and in-depth analysis, read the full report.
FOR INSTITUTIONAL, PROFESSIONAL, QUALIFIED INVESTORS AND QUALIFIED CLIENTS ONLY.
Endnotes
- PitchBook, “AI startups grabbed a third of global VC dollars in 2024,” January 9, 2025.
- The New York Times, “Databricks Is Raising $10 Billion, in One of the Largest Venture Capital Deals,” December 2024.
- The Wall Street Journal, “Anthropic Valuation Hits $183 Billion in New $13 Billion Funding Round,” September 2025.
- Forbes, “OpenAI Valued at $157 Billion After Closing $6.6 Billion Funding Round,” October 2, 2024.
- MetLife Investment Management, “Data Center Investments: A 360-Degree View,” June 2, 2025.
- McKinsey & Company, “AI power: Expanding data center capacity to meet growing demand,” October 2024.
- McKinsey & Company, October 2024.
- Berkeley Lab: Energy Analysis & Environmental Impacts Division, “2024 United States Data Center Energy Usage Report,” December 2024.
- Preqin, “2025 Global Report: Private Debt,” December 11, 2024.
- Preqin, December 2024.
- Global Market Insights, “Asset-Based Lending Market Size Industry Report,” July 2024.
- Global Market Insights, July 2024.
- Apollo Global Management, Inc., Apollo Academy, “Share of public and private companies in the U.S. with revenue greater than $100 million,” April 2024.
- PitchBook, “2024 Annual Venture Capital First Look,” January 6, 2025.
- Apollo Global Management, Inc. “Apollo Asset-Backed Finance Overview,” March 2024.
*Three scenarios showing the upper-, low- and mid-range estimates of demand, based on analysis of AI adoption trends; growth in shipments of different types of chips (application-specific integrated circuits, graphics processing units, etc.) and associated power consumption; and the typical compute, storage, and network needs of AI workloads. Demand is measured by power consumption to reflect the number of services a facility can house. Based on the McKinsey Data Center Demand Model.
Disclosure
CAPITAL MARKET ASSUMPTIONS
The capital market assumptions are BNY Advisors’ estimates based upon historical market performance and the current market environment. References to future expected returns are not promises of actual returns that may be realized and should not be relied upon. Actual returns may vary significantly. In addition, the historical returns used as a basis for this analysis are based on information gathered by BNY or from third-party sources and have not been independently verified.
The forecasts contained herein are for illustrative purposes only and are not guarantees of performance. The forecasts have inherent limitations because they are not based on actual transactions. The forecasts are based upon historical returns of the selected investments and subjective estimates and assumptions about circumstances and events that may not have taken place and may never do so.
Some of the factors that could impact these forecasts include, but are not limited to:
- General economic conditions
- Financial market performance
- Interest rate levels
- Changes to current laws or regulations, and
- Future geopolitical conditions
Asset class returns are not reflective of anticipated returns for associated indexes.
The results do not represent, and are not necessarily indicative of, the results that may be achieved in the future.
Robust Strategic Asset Allocation (RSAA) is a framework for classifying the market environment with a combination of macroeconomic and market indicators with judgment. BNY Advisors has defined historical regimes for the period starting in May 1973.
The asset classes referenced in our capital market assumptions are represented by broad-based indices which have been selected because they are well known and are easily recognizable by investors. Indices have limitations because indices have volatility and other material characteristics that may differ from an actual portfolio. For example, investments made for a portfolio may differ significantly in terms of security holdings, industry weightings and asset allocation from those of the index. Also, the indices noted in this presentation are unmanaged, are not available for direct investment, and are not subject to management fees, transaction costs or other types of expenses that a portfolio may incur. Finally, the performance of the indices reflects reinvestment of dividends and, where applicable, capital gain distributions. Therefore, investors should carefully consider these limitations and differences when evaluating the index performance.
The indices may be trademarks of various organizations and in those cases have been licensed for use by BNY and are used solely herein for comparative purposes. The foregoing index licensers are not affiliated with BNY, do not endorse, sponsor, sell or promote the investment strategies mentioned in this presentation and they make no representation regarding advisability of investing in the strategies described herein. Description of the indices are available upon request.
RISKS
All investments involve risk including loss of principal. Certain investments involve greater or unique risks that should be considered along with the objectives, fees, and expenses before investing.
Asset allocation and diversification cannot assure a profit or protect against loss.
The information contained herein reflects general views and is provided for informational purposes only. This material is not intended as investment advice nor is it a recommendation to adopt any investment strategy.
Opinions and views expressed are subject to change without notice.
Past performance is no guarantee of future results.
ISSUING ENTITIES
This material is only for distribution in those countries and to those recipients listed, subject to the noted conditions and limitations: • United States: by BNY Mellon Securities Corporation (BNYSC), 240 Greenwich Street, New York, NY 10286. BNYSC, a registered broker-dealer and FINRA member, has entered into agreements to offer securities in the U.S. on behalf of certain BNY Investments firms. • Europe (excluding Switzerland): BNY Mellon Fund Management (Luxembourg) S.A., 2-4 Rue Eugène Ruppert L-2453 Luxembourg. • UK, Africa and Latin America (ex-Brazil): BNY Mellon Investment Management EMEA Limited, BNY Mellon Centre, 160 Queen Victoria Street, London EC4V 4LA. Registered in England No. 1118580. Authorised and regulated by the Financial Conduct Authority. • South Africa: BNY Mellon Investment Management EMEA Limited is an authorised financial services provider. • Switzerland: BNY Mellon Investments Switzerland GmbH, Bärengasse 29, CH-8001 Zürich, Switzerland. • Middle East: DIFC branch of The Bank of New York Mellon. Regulated by the Dubai Financial Services Authority. • South East Asia and South Asia: BNY Mellon Investment Management Singapore Pte. Limited Co. Reg. 201230427E. Regulated by the Monetary Authority of Singapore. • Hong Kong: BNY Mellon Investment Management Hong Kong Limited. Regulated by the Hong Kong Securities and Futures Commission. • Japan: BNY Mellon Investment Management Japan Limited. BNY Mellon Investment Management Japan Limited is a Financial Instruments Business Operator with license no 406 (Kinsho) at the Commissioner of Kanto Local Finance Bureau and is a Member of the Investment Trusts Association, Japan and Japan Investment Advisers Association and Type II Financial Instruments Firms Association. • Brazil: ARX Investimentos Ltda., Av. Borges de Medeiros, 633, 4th floor, Rio de Janeiro, RJ, Brazil, CEP 22430-041. Authorized and regulated by the Brazilian Securities and Exchange Commission (CVM). • Canada: BNY Mellon Asset Management Canada Ltd. is registered in all provinces and territories of Canada as a Portfolio Manager and Exempt Market Dealer, and as a Commodity Trading Manager in Ontario. All issuing entities are subsidiaries of The Bank of New York Mellon Corporation.
NOT FDIC INSURED | NO BANK GUARANTEE | MAY LOSE VALUE
© 2026 THE BANK OF NEW YORK MELLON CORPORATION
BABR-880111-2026-02-04 | GU-794 - 15 February 2027