Please ensure Javascript is enabled for purposes of website accessibility Risk On?
be
en
intermediary
intermediary
false
true
Gathering data
Disclaimer Not Available

The S&P 500 is trading at record highs, which some investors didn’t see coming after the tariff-fueled drop in April. What may come as a bigger surprise, however, is the rally is broadening beyond big technology companies. Let’s examine different measures that prove this point. 


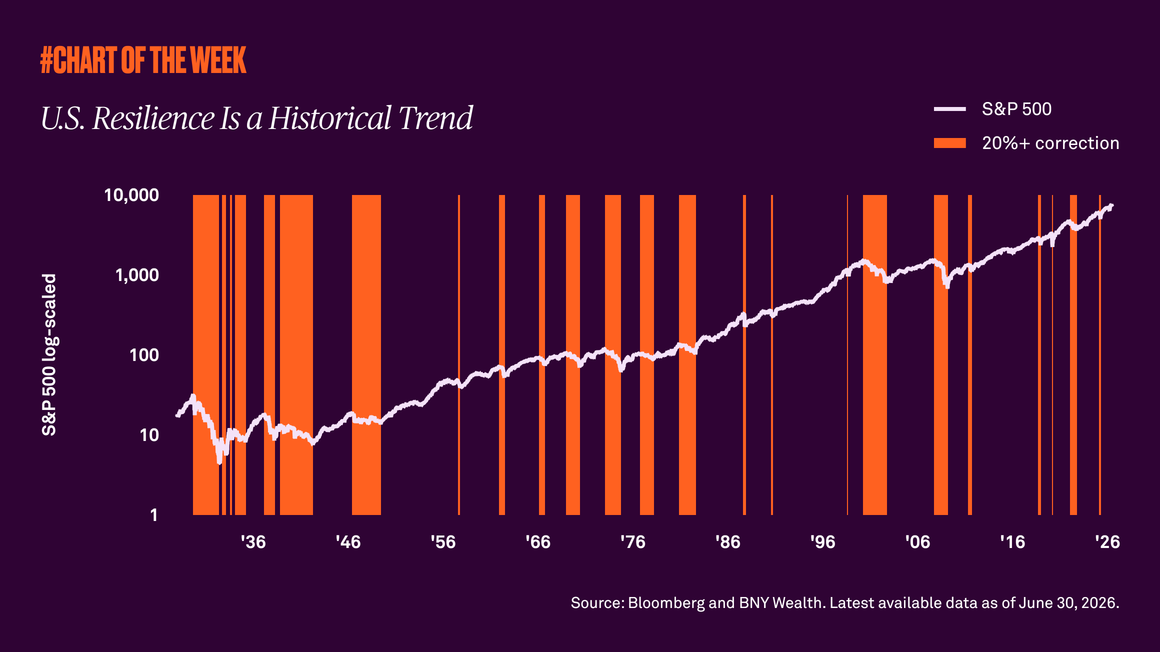
Ever since early April, when policy uncertainty took the market down around 20%, equity indices have been gaining, hitting all-time highs with notable frequency. The S&P 500 is now up over 13% year to date, which some investors didn’t see coming. What may come as a true surprise, however, is that the rally is broadening beyond big technology companies.

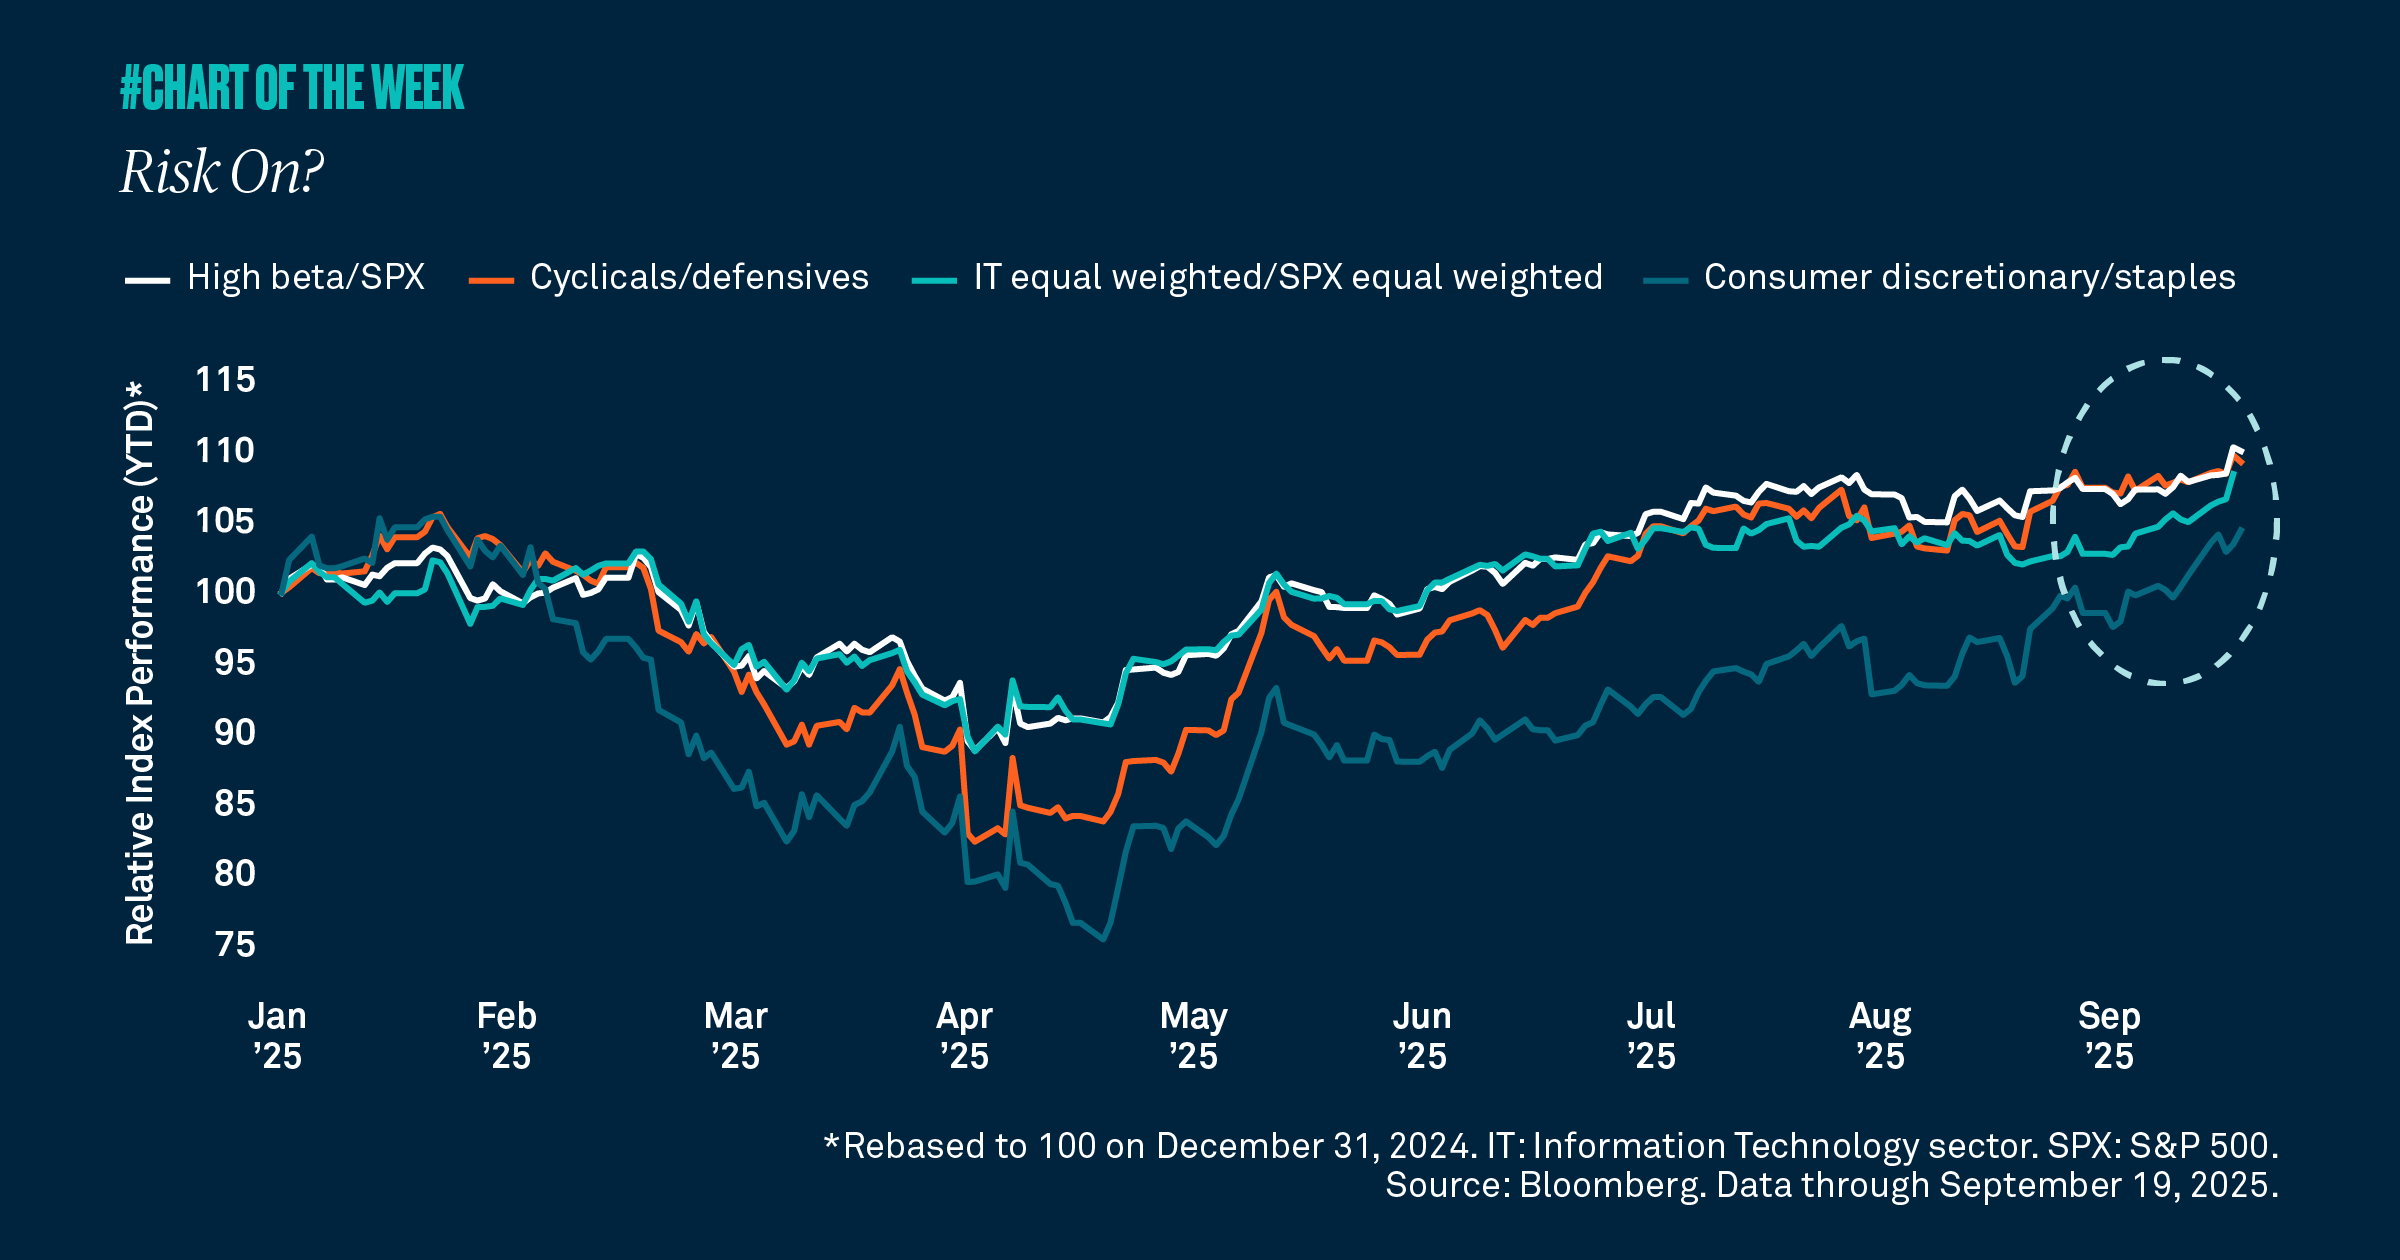
Cyclicals are outperforming defensive sectors, indicating that investors are becoming more positive on the outlook. Additionally, high beta stocks — or those that tend to experience larger price swings — are at a year-to-date high compared to the overall market, as measured by the S&P 500. When high beta stocks outperform, it typically signals the market is becoming more bullish. Consumer discretionary is leading staples, suggesting the consumer can remain resilient despite slowing job growth. Lastly, the equal-weighted technology sector is outperforming the average stock. This means technology stocks other than the Magnificent Seven are performing well too, implying a more diversified constellation of companies is gaining.

Together, these signals demonstrate that the market is more positive on the forward outlook. Slowing job growth remains a risk, and we will watch closely in case it spills over into consumer spending. Nonetheless, we believe equities can continue to move higher as the Federal Reserve eases into an improving earnings environment. 

RELATED CONTENT
Job market hanging in there
Chart of the week | Macroeconomic

Recent jobless claims data point to a resilient U.S. labor market, with both initial and continuing claims remaining low and signaling that unemployment is still contained. Although job growth has softened and remains subdued, March’s job growth of 178,000, the highest since 2024, is encouraging. Our constructive outlook still holds despite continued uncertainty related to the war in the Middle East.

cotw-30-03-2026-thumbnail-580x326px
Chart of the week | Macroeconomic

Markets are reacting to the Middle East conflict with sharp moves across asset classes, signaling broad risk repricing and shifting safe haven behavior. While volatility is elevated, fundamentals like earnings growth continue to support our constructive outlook.

Signals from spreads
Chart of the week | Macroeconomic

Credit spreads have risen yet remain historically low, reinforcing our view that the oil shock is likely temporary — not a driver of long-term growth concerns.

Dollar strength: what does it mean for markets?
Chart of the week | Macroeconomic

Geopolitical tensions have lifted oil prices, sent U.S. stocks slightly lower and driven flows into the safety of the U.S. dollar, which has strengthened versus peers. While a weaker dollar previously supported international equity outperformance, dollar stabilization now suggests that tailwind is fading, underscoring the importance of diversification across regions and asset classes.

Gathering data
Disclaimer Not Available

This is a marketing communication