Please ensure Javascript is enabled for purposes of website accessibility Dollar Strength: What Does It Mean for Markets?
be
en
institutional
institutional
false
true
Gathering data
Disclaimer Not Available

Dollar strength: what does it mean for markets?

Dollar strength: what does it mean for markets?

Geopolitical tensions have lifted oil prices, sent U.S. stocks slightly lower and driven flows into the safety of the U.S. dollar, which has strengthened versus peers. While a weaker dollar previously supported international equity outperformance, dollar stabilization now suggests that tailwind is fading, underscoring the importance of diversification across regions and asset classes.


The conflict in the Middle East has seen oil prices rise, equities fall slightly, and investors flock to safe haven assets. In times of turmoil, investors often seek the stability of the U.S. dollar (USD) because of its reserve currency status and liquidity, as well as the perceived credit strength of the U.S. This episode of geopolitical uncertainty is proving to be no different with the USD gaining strength relative to global peers.  

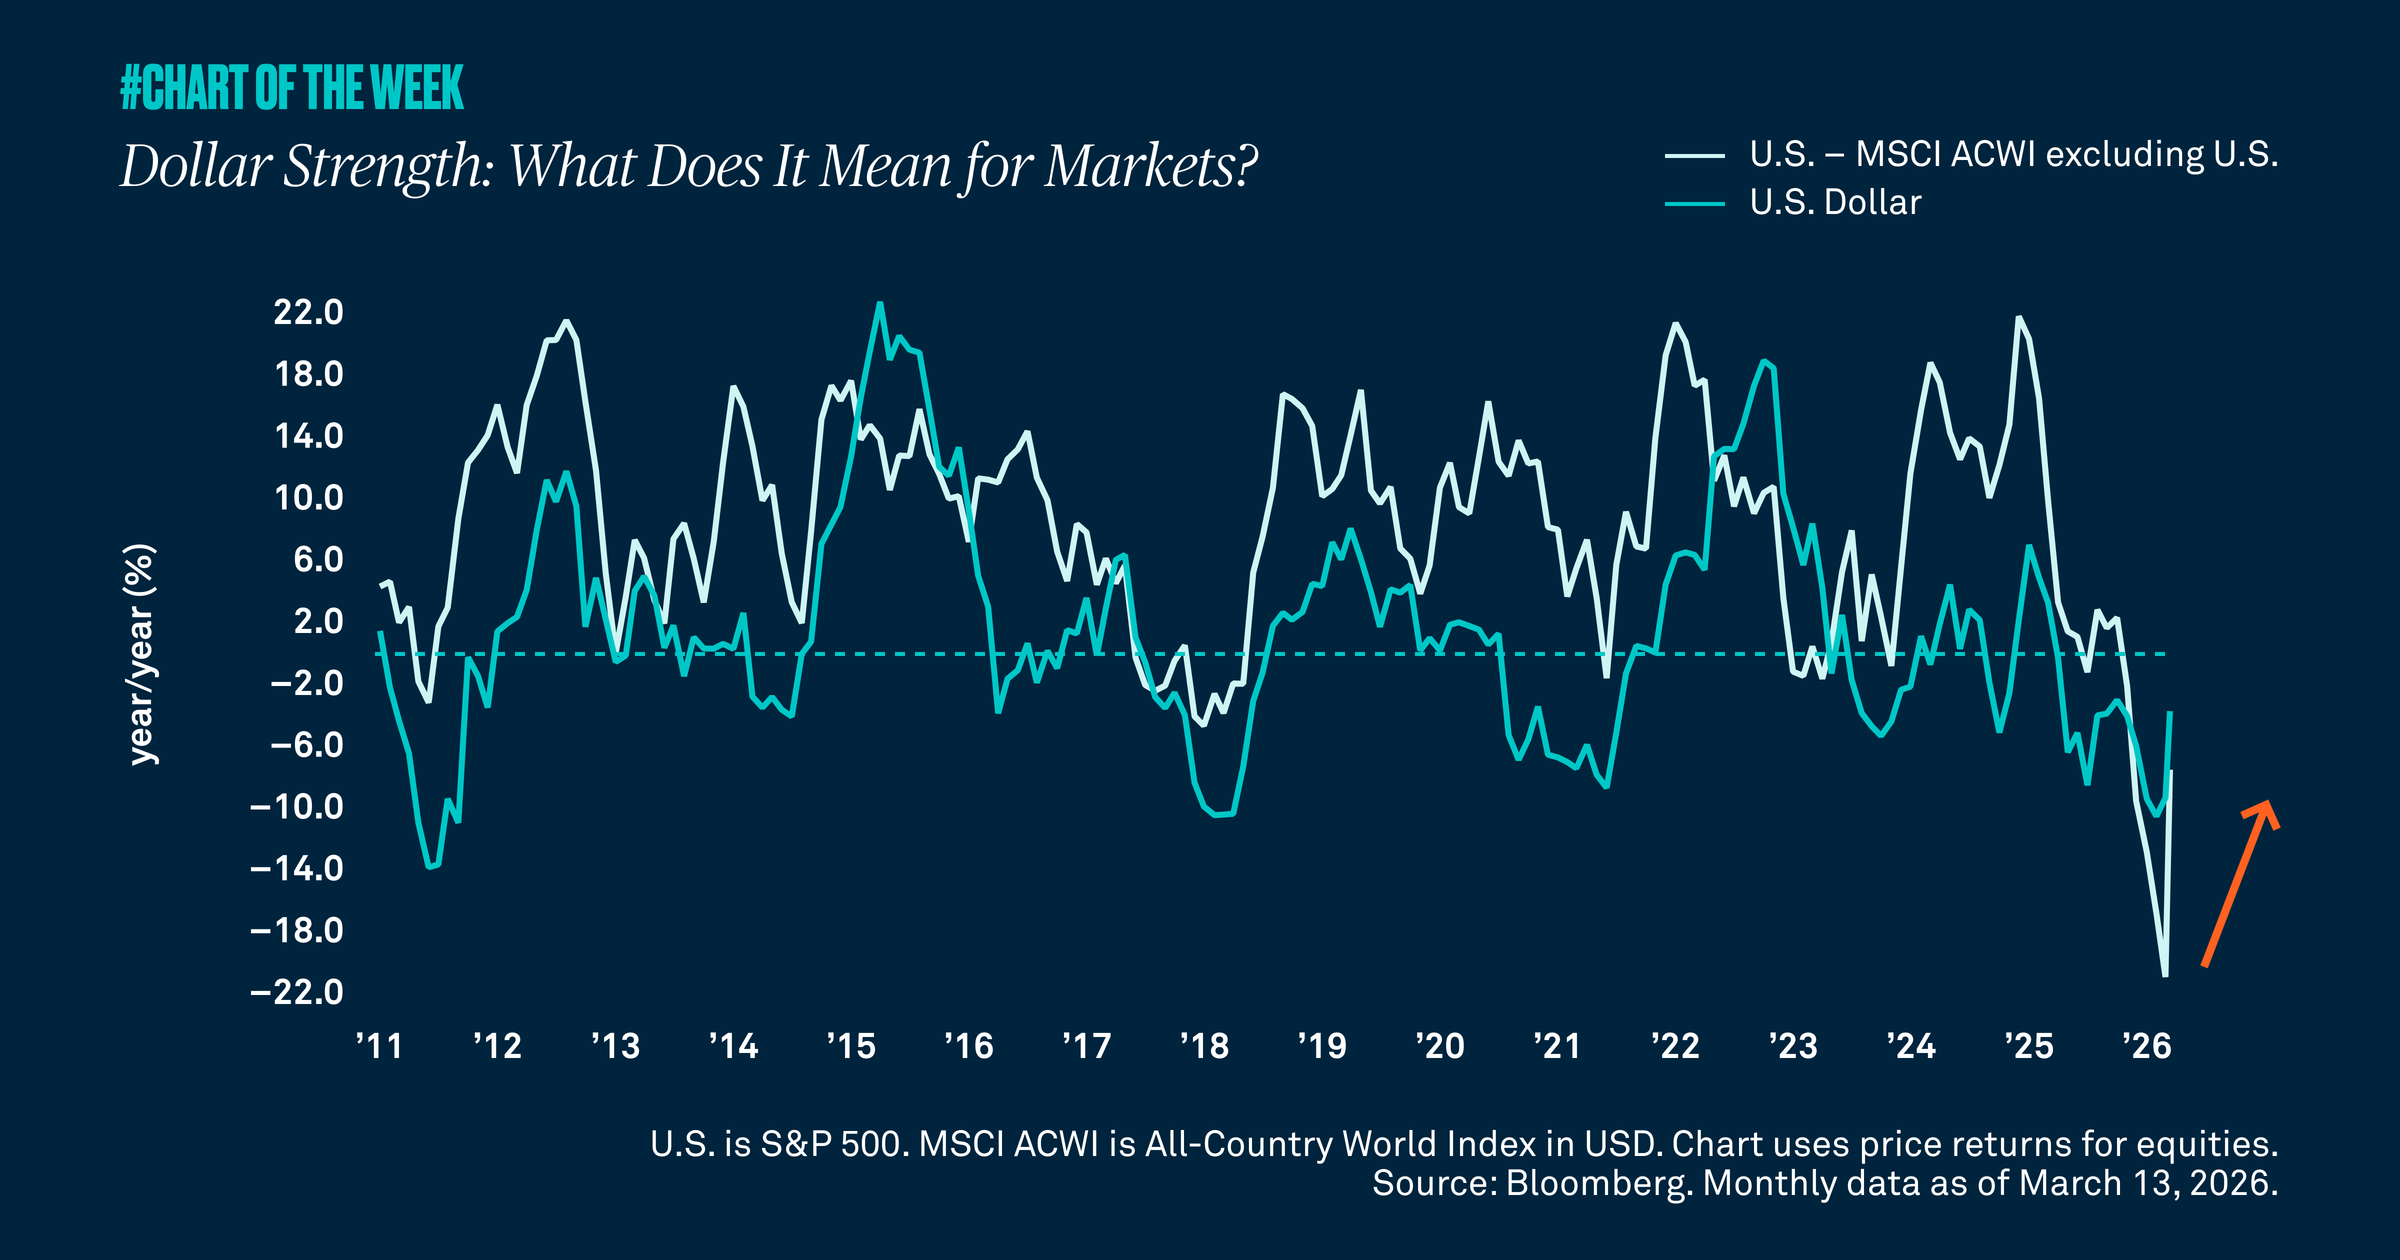
Historically, the performance gap between U.S. equities and the rest of the world has hinged on the relative strength of the USD. While a weaker USD makes U.S. exports more competitive, this has often coincided with the outperformance of major non-U.S. indices on a relative basis. That pattern has been evident over the last year, with international equity benchmarks outperforming the S&P 500.

In our view, signs of USD stabilization suggest the tailwind from dollar weakness to non‑U.S. outperformance has likely peaked. The USD is near its highest level since May 2025, and the combination of sticky inflation, U.S. energy independence and resilient growth could limit further dollar softness and challenge the recent leadership of international markets. Diversifying across geographies and asset classes remains prudent to capture potential upside amid today’s varied global conditions.

RELATED CONTENT
 Time to buy tech?
Chart of the week | Macroeconomic

Technology valuations have meaningfully declined over the past year, but the sector continues to stand out for its strong earnings growth and relative resilience. While near-term uncertainty remains, tech still appears well positioned as a key driver of broader market growth.

Job market hanging in there
Chart of the week | Macroeconomic

Recent jobless claims data point to a resilient U.S. labor market, with both initial and continuing claims remaining low and signaling that unemployment is still contained. Although job growth has softened and remains subdued, March’s job growth of 178,000, the highest since 2024, is encouraging. Our constructive outlook still holds despite continued uncertainty related to the war in the Middle East.

cotw-30-03-2026-thumbnail-580x326px
Chart of the week | Macroeconomic

Markets are reacting to the Middle East conflict with sharp moves across asset classes, signaling broad risk repricing and shifting safe haven behavior. While volatility is elevated, fundamentals like earnings growth continue to support our constructive outlook.

Signals from spreads
Chart of the week | Macroeconomic

Credit spreads have risen yet remain historically low, reinforcing our view that the oil shock is likely temporary — not a driver of long-term growth concerns.

Gathering data
Disclaimer Not Available

This is a marketing communication