Please ensure Javascript is enabled for purposes of website accessibility Global Momentum in Manufacturing
be
en
institutional
institutional
false
true
Gathering data
Disclaimer Not Available

Global momentum in manufacturing

Global momentum in manufacturing

April PMIs (Purchasing Managers’ Indices) point to a meaningful improvement in global manufacturing momentum, with the U.S., Eurozone and Japan all posting stronger-than-expected and firmly expansionary results. The breadth of the rebound suggests improving global demand, supporting a constructive outlook for growth despite ongoing geopolitical tensions.
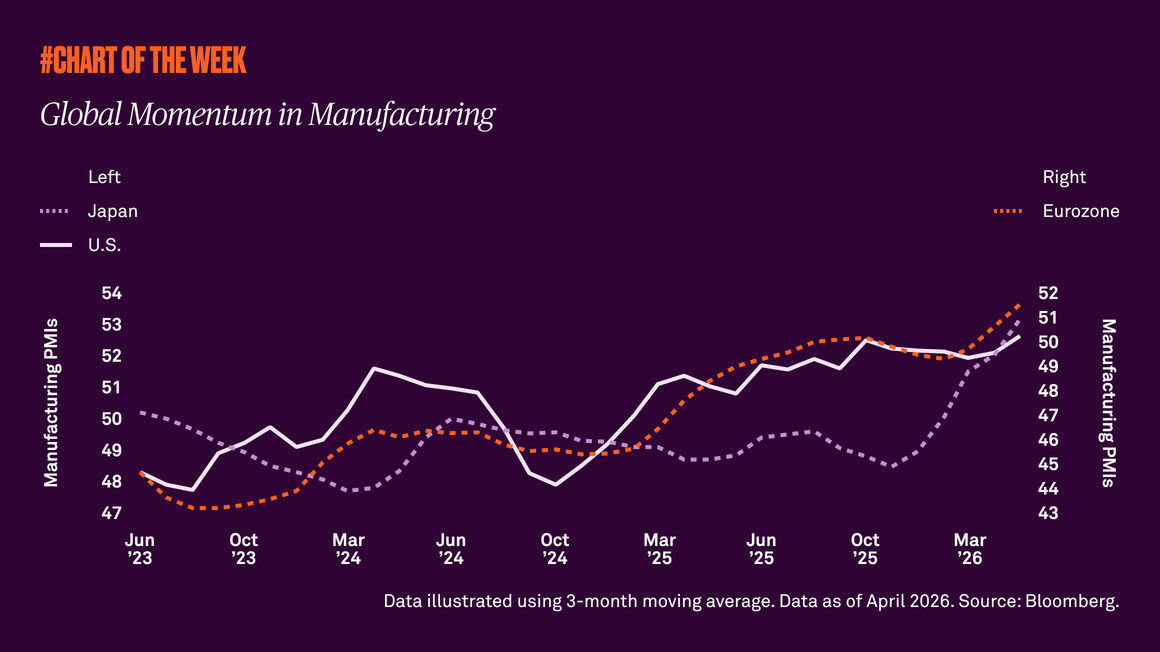

In April, the U.S. manufacturing PMI rose more than expected to 54.0, its highest level in four years and a firmly expansionary reading. The PMI tracks changes in business conditions across the manufacturing sector, making it a useful gauge of the sector’s overall health and direction. Because purchasing managers tend to see shifts in supply, demand and production plans early, the index is considered a leading indicator of economic activity.

However, the improvement was not confined to the U.S. In the Eurozone, the manufacturing PMI also rose more than expected to 52.2, its strongest reading since May 2022. Japan’s manufacturing PMI likewise advanced to 54.9, the highest level since January 2022. Taken together, these readings suggest that manufacturing activity is strengthening across several major economies at the same time.

That breadth matters. Manufacturing recoveries that occur simultaneously across regions tend to be more durable because they reflect not just local factors, but improving global demand. We view the latest PMI data as constructive. These readings suggest that, despite the ongoing war in the Middle East, momentum in the goods-producing side of these economies is building rather than fading.

RELATED CONTENT
Sizing up small caps
Chart of the Week | Macroeconomic

Small caps have outperformed this year despite the threat of higher interest rates, suggesting the rally is being driven by more than just diversification away from large cap tech stocks. Improving earnings expectations and a resilient U.S. economy support our view that small caps have further upside from here.

cotw_27_07_2026_580x326
Chart of the Week | Macroeconomic

The war in Iran has increased volatility across fixed income markets, pushing municipal bond yields higher as investors reassess inflation risk, energy costs and the path of Federal Reserve policy. Even so, historically elevated municipal bond yields present a compelling opportunity for tax-sensitive investors.

Signs from Sales
Chart of the Week | Macroeconomic

Year-to-date stock market returns have been driven by robust earnings growth. But when assessing the equity outlook, it’s important to ask what’s supporting the strong earnings trend.

Resilience is a historical trend
Chart of the Week | Macroeconomic

The S&P 500’s history shows that despite recessions, wars, inflation, and corrections, the market’s long-term trajectory has remained upward. As the U.S. marks 250 years of resilience, the lesson for investors is clear: wealth is built through patience, discipline and staying invested.

Gathering data
Disclaimer Not Available

This is a marketing communication