Chart of the Week
We focus on macro and technical data driving markets, so you can focus on the trends that matter the most.
We focus on macro and technical data driving markets, so you can focus on the trends that matter the most.

MOST RECENT
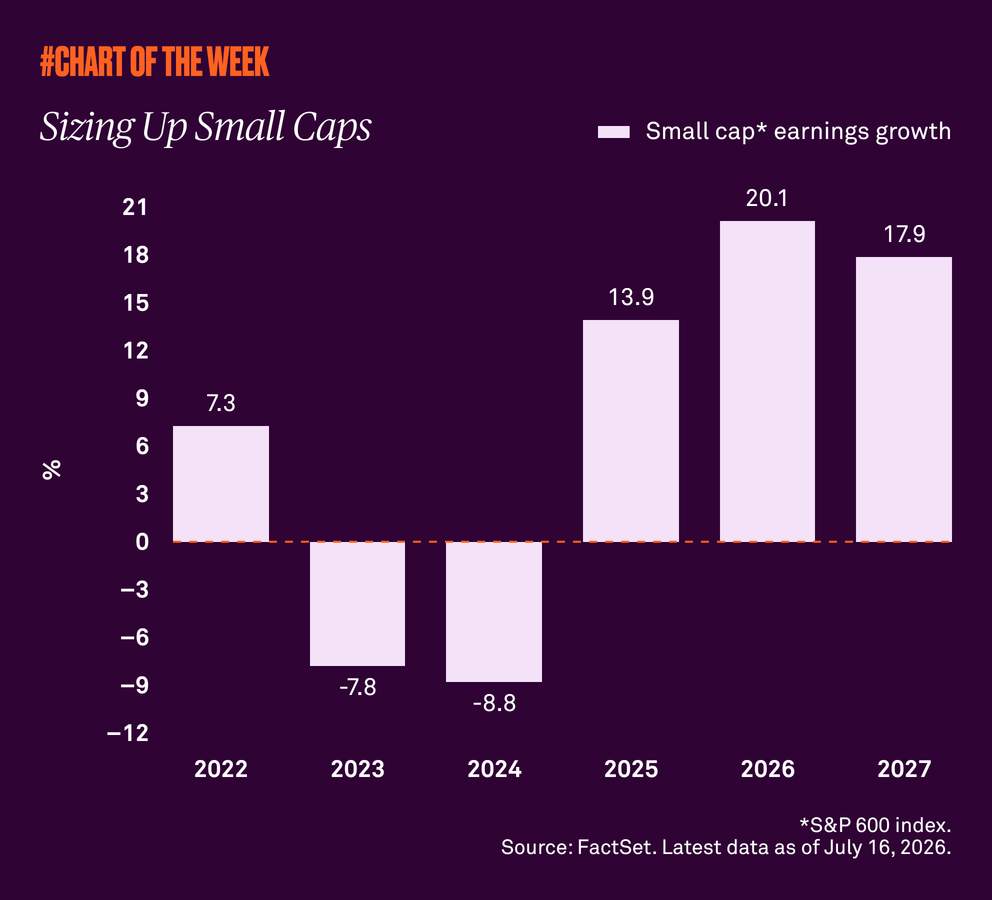
Small caps have outperformed this year despite the threat of higher interest rates, suggesting the rally is being driven by more than just diversification away from large cap tech stocks. Improving earnings expectations and a resilient U.S. economy support our view that small caps have further upside from here.
This is a marketing communication