Please ensure Javascript is enabled for purposes of website accessibility Is big tech overvalued?
uk
en
intermediary
intermediary
false
true
Gathering data
Disclaimer Not Available

Is big tech overvalued?

Is big tech overvalued?

It’s true that the S&P 500 currently exhibits high valuations, with the technology sector alone comprising over 40% of its market capitalization and driving concerns about valuations. Are those high multiples justified?  
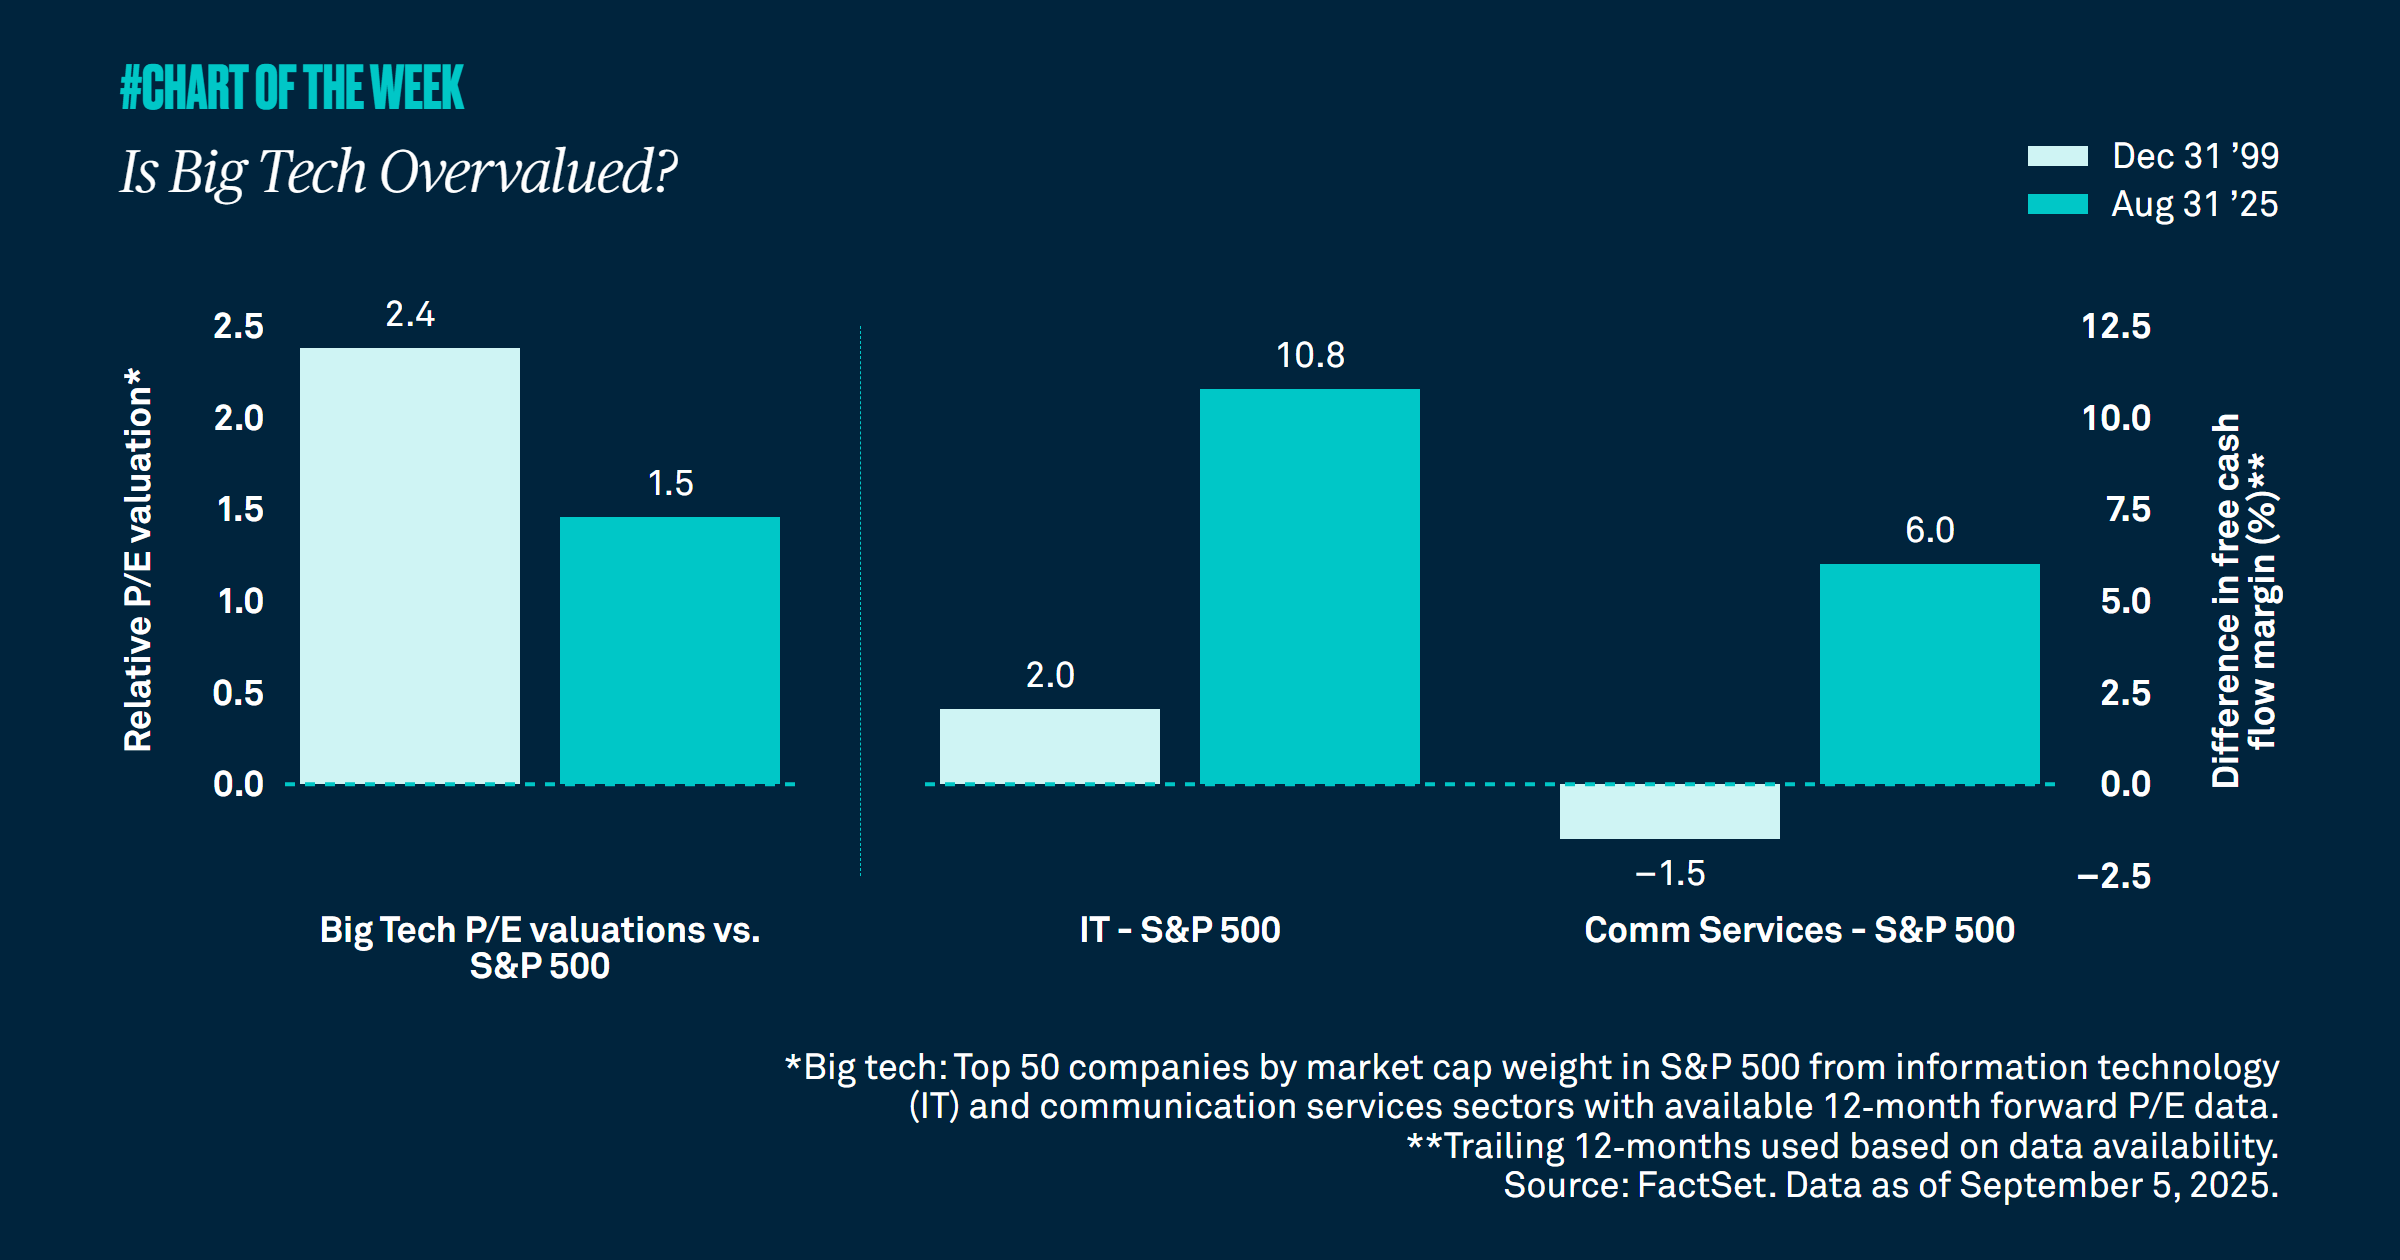

There are concerns among some investors that technology stocks, which account for over 40% of the S&P 500’s market capitalization, are trading at valuations that call to mind the boom and bust of the dot.com era. However, during the dot.com bubble, big tech was 2.4X more expensive than the S&P 500 compared to only 1.5X today.

Another factor to consider is the profitability of the market as measured by free cash flow margins. In 1999, the Information Technology sector’s free cash flow margins were 2% higher than that of the S&P 500. Today that number is as high as 11%. Additionally, margins in Communication Services are 6% greater than that of the broader index compared to -1.5% in 1999.

Lower relative valuations and greater profitability suggest to us that big tech is not overvalued, and these companies justify their price tags. In our view, the late 90s and early 2000s do not, bear a convincing resemblance to today. We remain constructive on equities and U.S. large cap stocks in particular as we continue to anticipate the many ways artificial intelligence, a huge driver of growth in the tech space, can improve profitability for all the S&P 500 sectors.
RELATED CONTENT
Not in a bubble
Chart of the Week | Macroeconomic

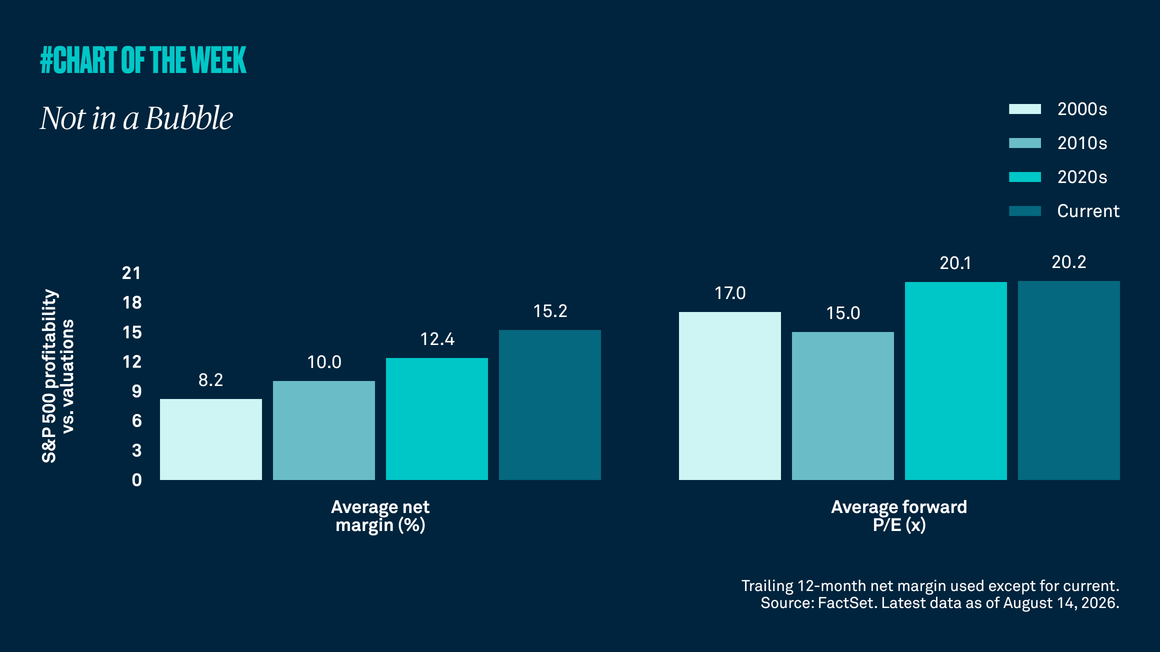
As the S&P 500 approaches all-time highs, there are renewed concerns among investors about elevated valuations. However, historically strong profitability and expected earnings growth appear to support current pricing. In addition, the current S&P 500 price-to-earnings (P/E) ratio is roughly equal to the average since Covid. As a result, we do not view U.S. equities as being in bubble territory and we remain constructive on the asset class.

Is the market rally broadening?
Chart of the Week | Macroeconomic

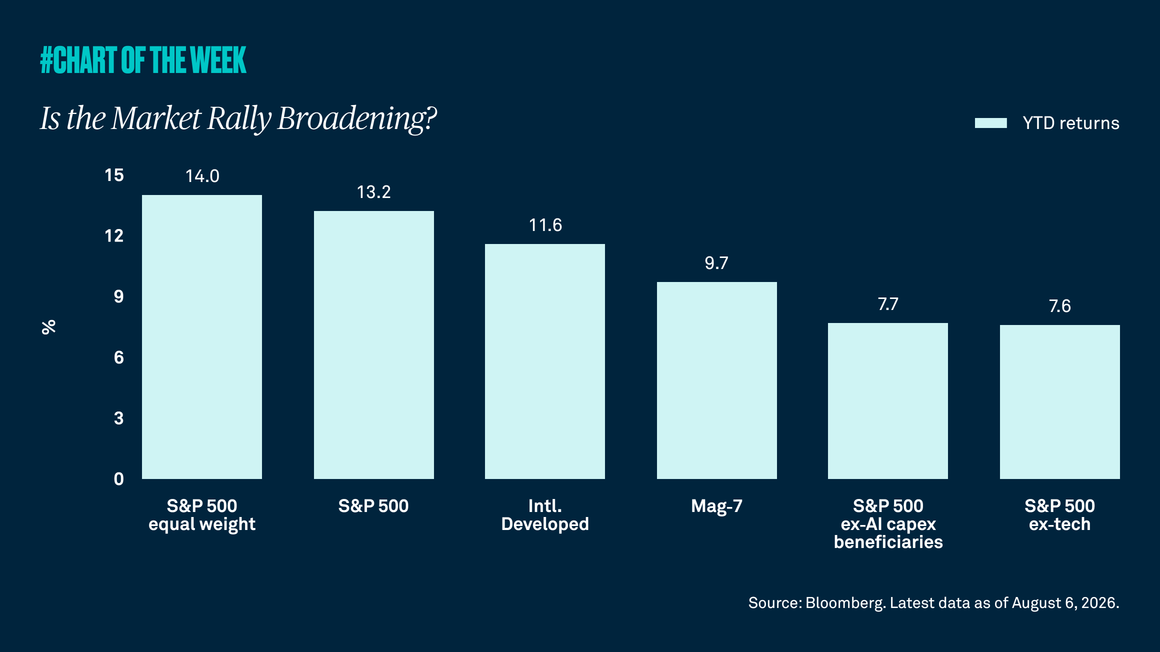
Stocks, as measured by the S&P 500, are up over 13% through early August. The solid gains have been fueled by a resilient economy, steady consumer spending, optimism around artificial intelligence and better-than-expected earnings growth. Still, some investors worry the advance may be too concentrated in technology and that AI-capex monetization may fall short of expectations. A closer look suggests that it is not just tech moving the market higher.

Fed friction?
Chart of the Week | Macroeconomic

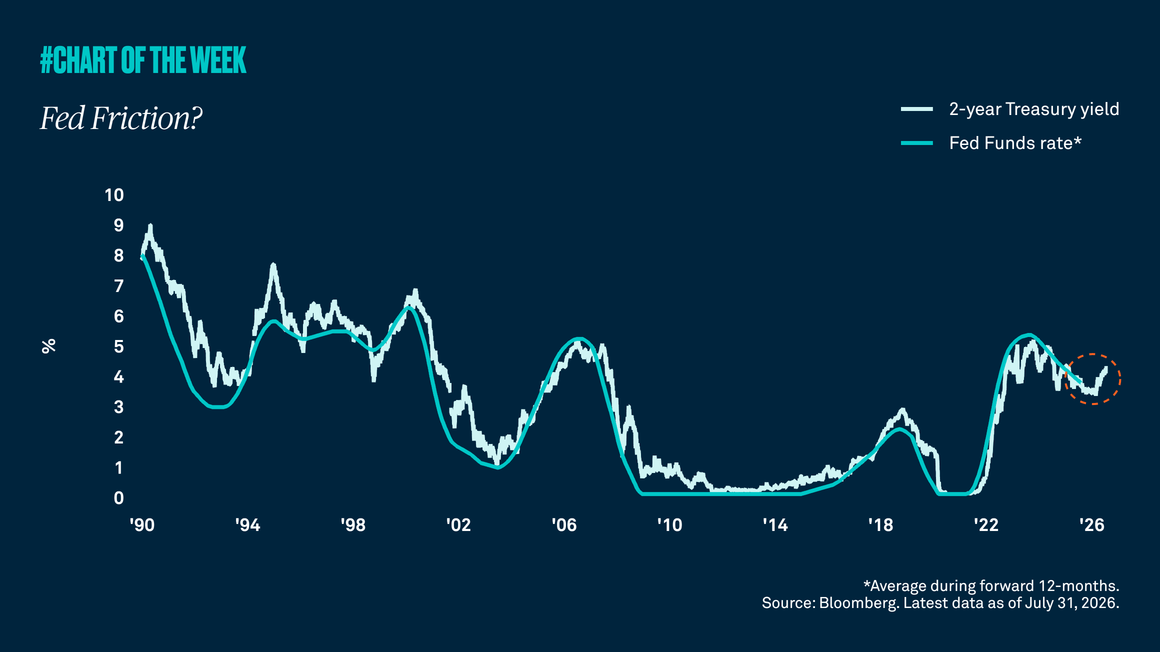
Markets are navigating tensions between a Fed that offers less guidance and an inflation backdrop that remains sticky. Added uncertainty from Middle East tensions and energy-price swings is further shaping sentiment, with recent moves in Treasury yields suggesting the market wants the Fed to hike. However, with yield volatility expected to linger in the near term, we see today’s elevated Treasury yields as an especially compelling opportunity in fixed income.

Sizing up small caps
Chart of the Week | Macroeconomic

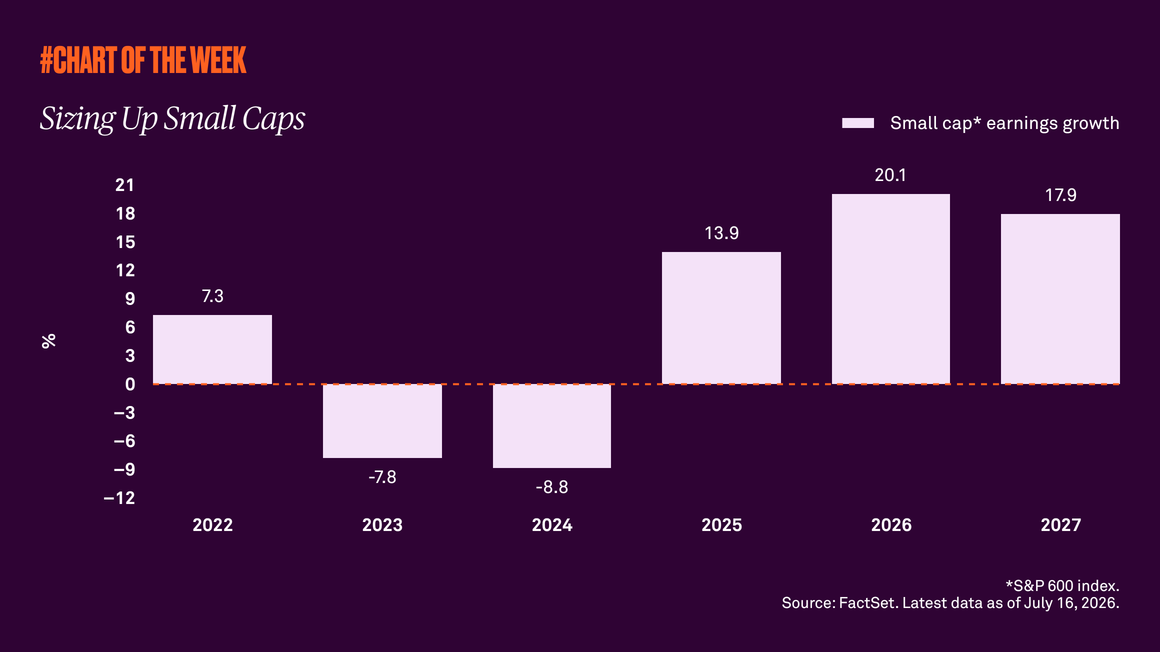
Small caps have outperformed this year despite the threat of higher interest rates, suggesting the rally is being driven by more than just diversification away from large cap tech stocks. Improving earnings expectations and a resilient U.S. economy support our view that small caps have further upside from here.

Gathering data
Disclaimer Not Available

This is a marketing communication