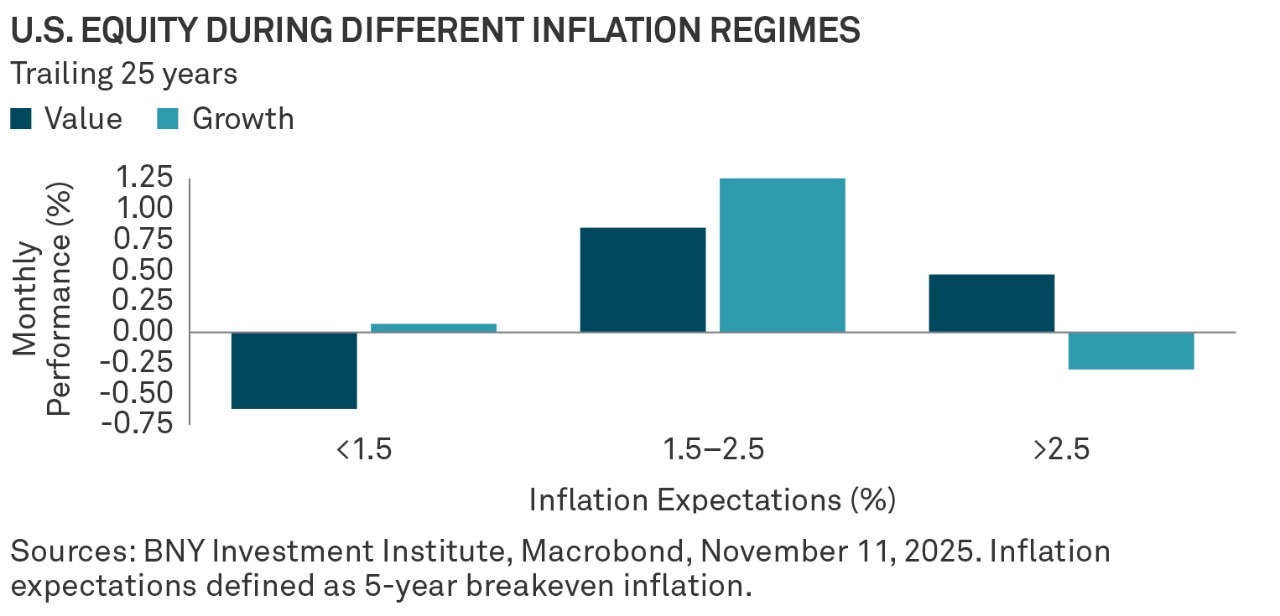
Value equities have historically shown resiliency during higher inflationary periods versus their growth counterparts. Given that the current period of higher core inflation may last longer than expected, value opportunities continue to be an option to consider for portfolio diversification and potential stability.
“Sticky” core services persist
Inflation currently remains more elevated than it was over a year ago, although it has receded through October. Our view is that inflation will remain above target with 2% likely being the floor. We think price pressures continue in the pipeline, particularly in core goods. Core services remain sticky but with less labor demand, lower wage growth should contain further upward pressure.
Value beyond tech
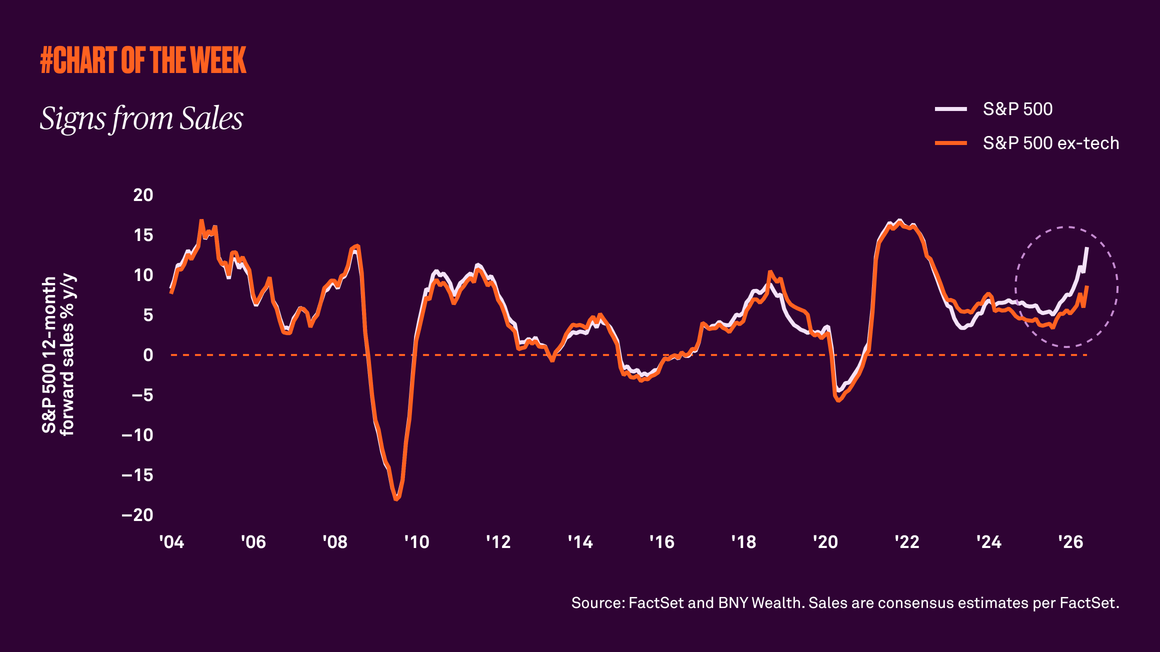
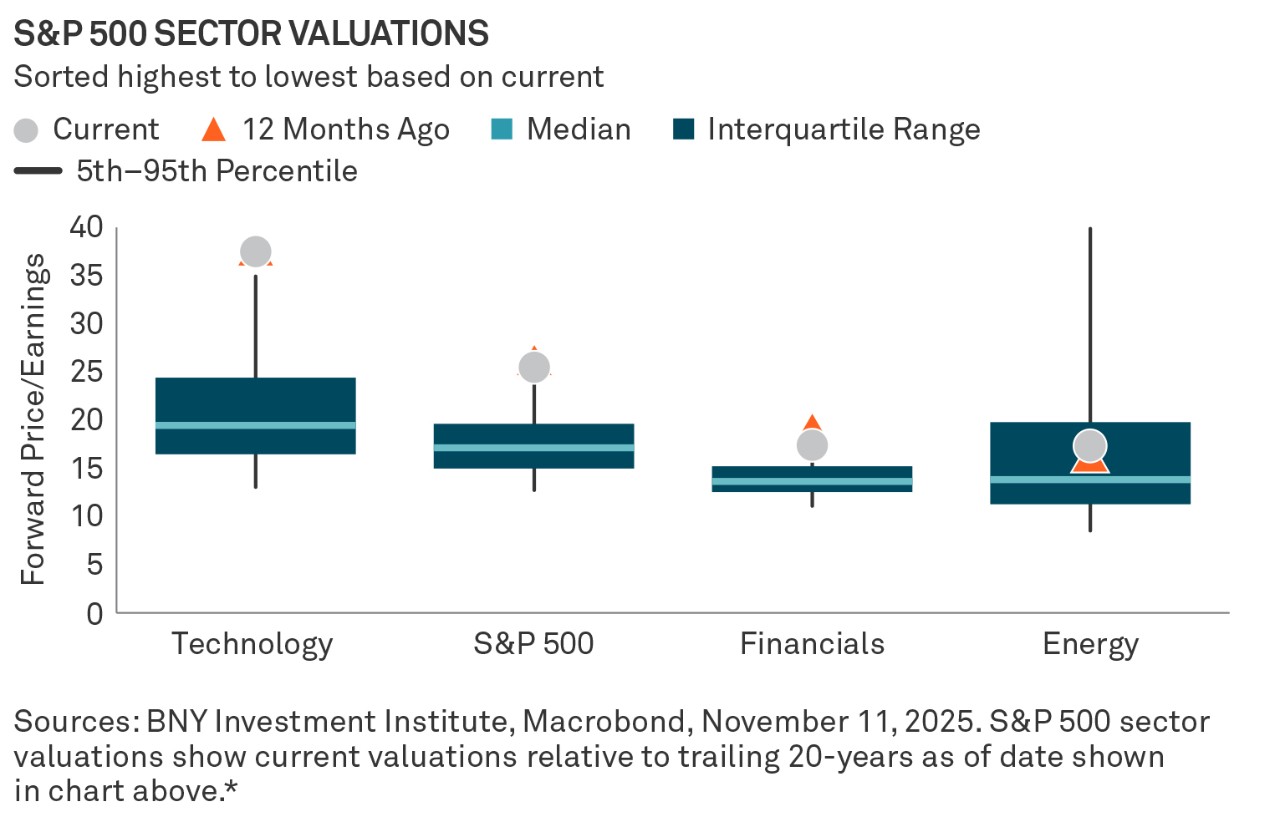
While equity markets continue to be highly concentrated in more growth oriented companies, with tech leading much of that momentum, we believe attractive valuations can be found in other sectors like energy and financials.
In financials, we believe large banks like Bank of America and JP Morgan can offer opportunities through diversified lines of business where deregulation and buybacks or dividends are tailwinds for the sector. In energy, we see attractive supply-demand dynamics in oil, gas and refineries, such as Exxon, Phillips 66 and Marathon Petroleum.
For a deeper dive into various sectors and investment strategies, see the latest Monthly Checkpoints.
This is an extract from Checkpoints, a comprehensive monthly chartbook that provides insights into major themes affecting financial markets. For additional analysis, read the full report.

* Chart illustrates a sample of sectors; for the full display, see the latest Monthly Checkpoints. Charts are provided for illustrative purposes and are not indicative of future results. Performance quoted represents past performance which is no guarantee of future results.
The price-to-earnings (P/E) ratio measures a company’s share price relative to its earnings per share (EPS).
The S&P 500 Index is designed to track the performance of the largest 500 U.S. companies. An investor cannot invest directly in an index.
This material has been provided for informational purposes only and should not be construed as investment advice or a recommendation of any particular investment product, strategy, investment manager or account arrangement, and should not serve as a primary basis for investment decisions. Prospective investors should consult a legal, tax or financial professional in order to determine whether any investment product, strategy or service is appropriate for their particular circumstances. Views expressed are those of the author stated and do not reflect views of other managers or the firm overall. Views are current as of the date of this publication and subject to change. The information is based on current market conditions, which will fluctuate and may be superseded by subsequent market events or for other reasons. References to specific securities, asset classes and financial markets are for illustrative purposes only and are not intended to be and should not be interpreted as recommendations. Information contained herein has been obtained from sources believed to be reliable, but not guaranteed. No part of this material may be reproduced in any form, or referred to in any other publication, without express written permission.
Important Information
For sole and exclusive use by Institutional Investors, Accredited Investors and Professional Investors only. Not for further distribution. This is a financial promotion and is not investment advice. Any views and opinions are those of the investment manager, unless otherwise noted. The value of investment can fall. Investors may not get back the amount invested. BNY, BNY Mellon and Bank of New York Mellon are the corporate brands of The Bank of New York Mellon Corporation and may also be used to reference the corporation as a whole and/or its various subsidiaries generally. BNY Investments encompass BNY Mellon’s affiliated investment management firms and global distribution companies. Any BNY entities mentioned are ultimately owned by The Bank of New York Mellon Corporation. In Hong Kong, the issuer of this document is BNY Mellon Investment Management Hong Kong Limited, which is registered with the Securities and Futures Commission (Central Entity Number: AQI762). In Singapore, this document is issued by BNY Mellon Investment Management Singapore Pte. Limited, Co. Reg. 201230427E. Regulated by the Monetary Authority of Singapore (MAS). This advertisement has not been reviewed by the Monetary Authority of Singapore.
GU-751 – 2 November 2026