Please ensure Javascript is enabled for purposes of website accessibility Are Earnings Broadening Beyond the Magnificent 7?
sg
en
institutional
institutional
false
true
Gathering data
Disclaimer Not Available

Are earnings broadening beyond the magnificent 7?

Are earnings broadening beyond the magnificent 7?

Tech stocks have outperformed the rest of the S&P 500 for several years, and while we expect earnings growth among these companies to continue in 2026, we see another encouraging trend emerging. Earnings across the rest of the market are on an upward path too — and are set to contribute more to earnings growth for the S&P 500 Index in 2026 than the Magnificent 7.


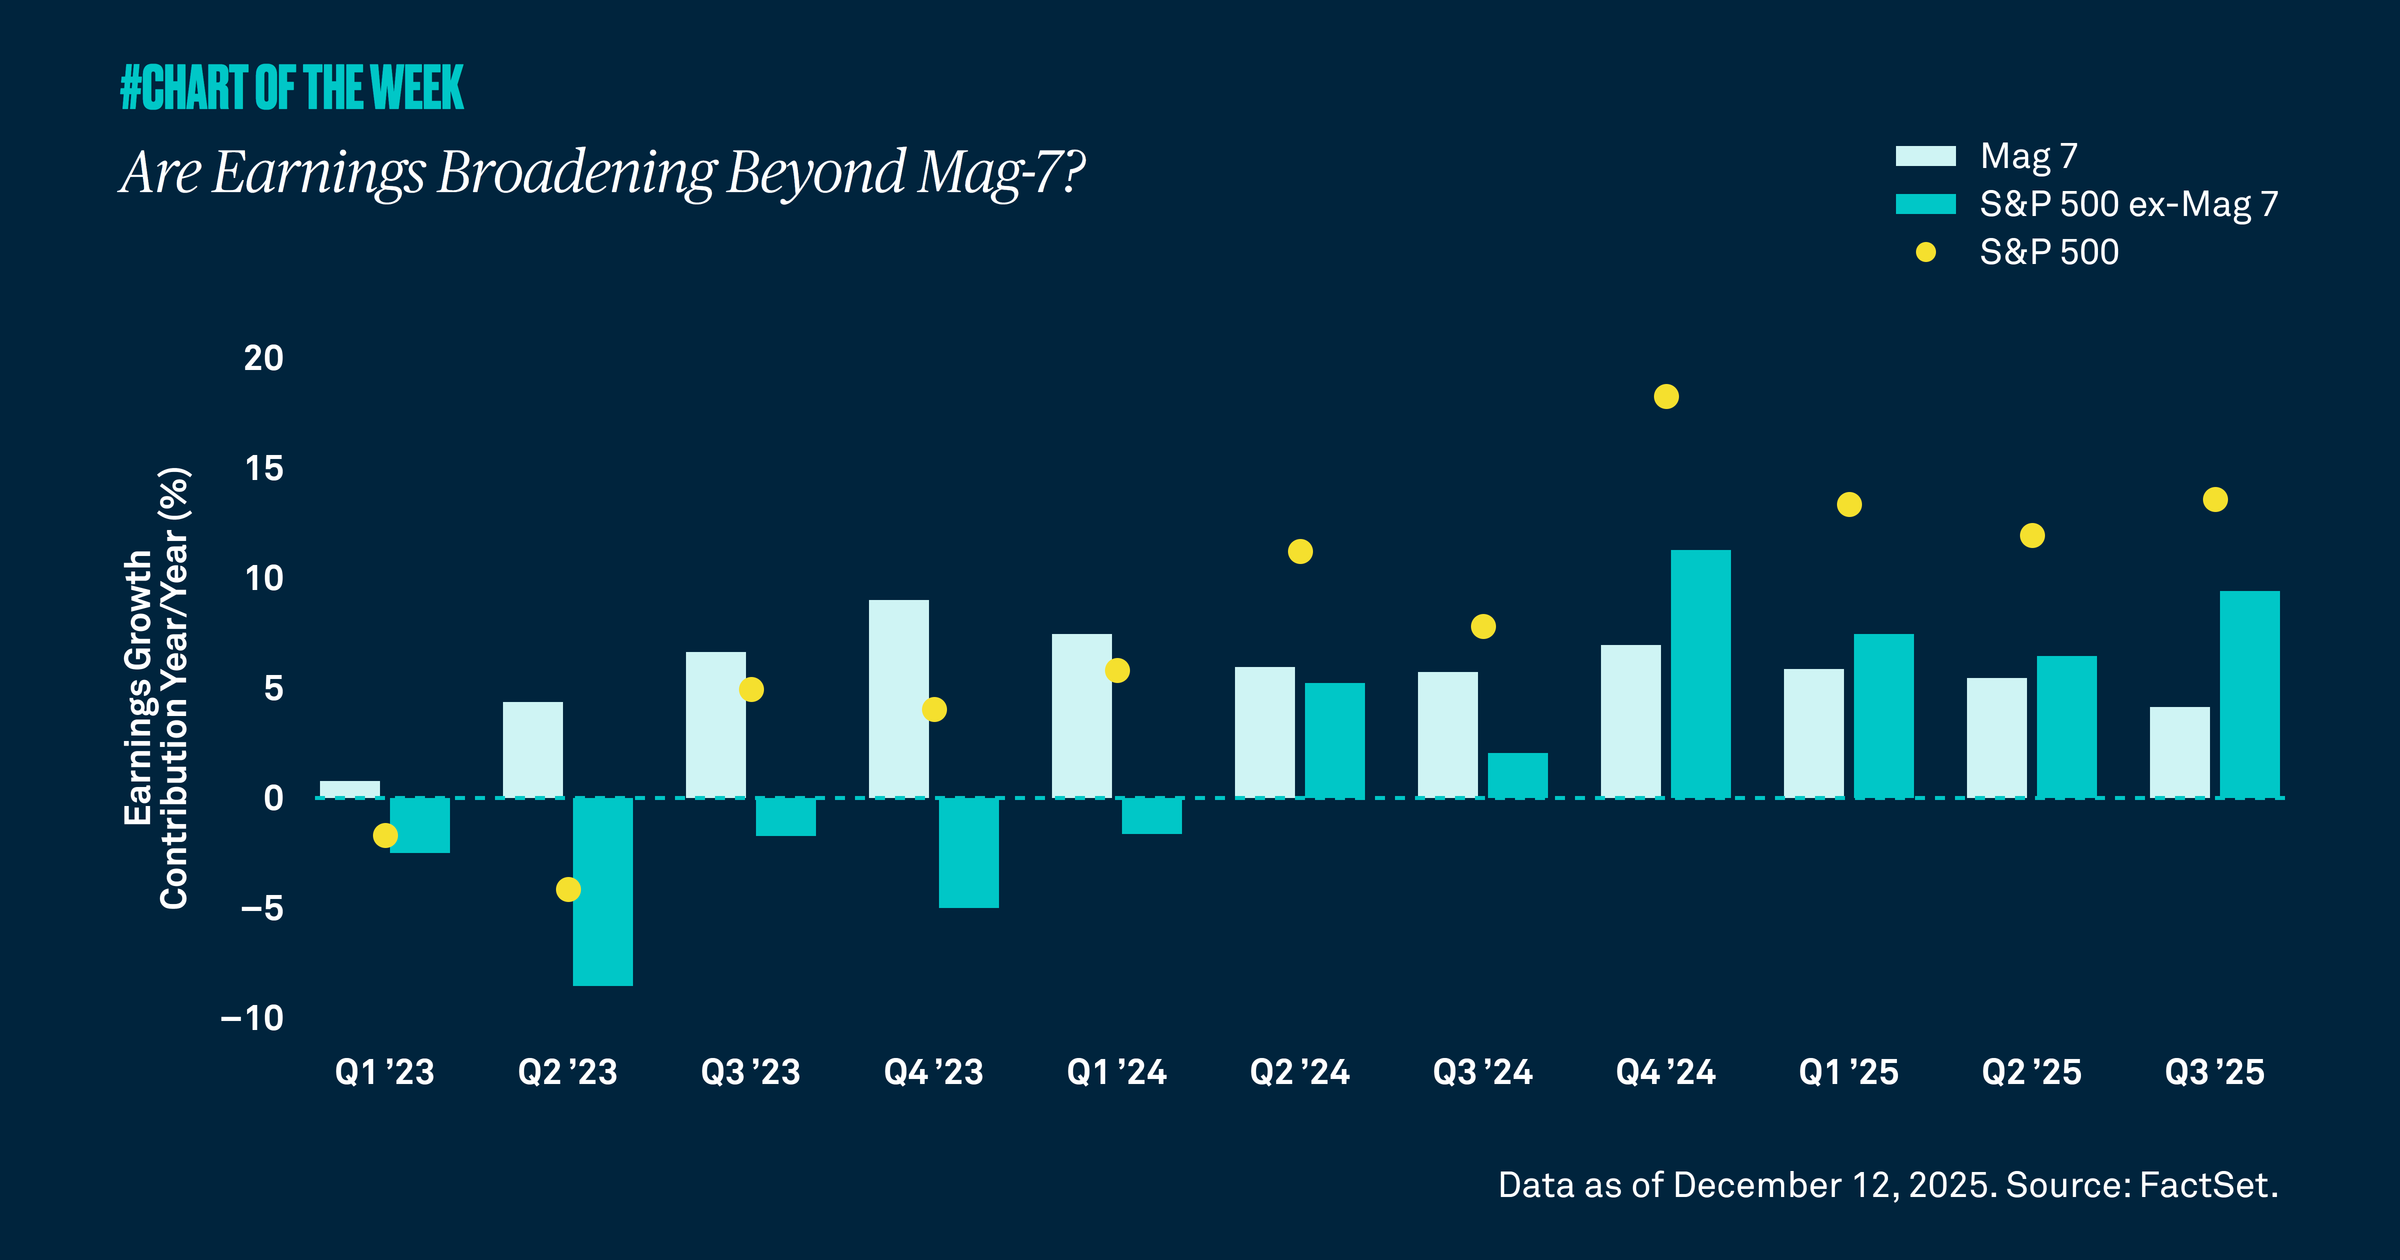
In the third quarter, the Magnificent 7 stocks contributed 4.1% to the S&P 500’s year-over-year earnings growth compared to more than double that, or 9.4%, from the rest of the index. Beyond the third quarter, the Magnificent 7 stocks are expected to trail the earnings growth contribution from the rest of the market for all of 2025. Earnings are broadening beyond tech, and they are on track to continue this path in 2026 — a positive sign in our view.

What’s behind this shift? Productivity and profitability among all sectors have been improving on the heels of AI technology advancements, lower borrowing costs and business-friendly regulatory and policy provisions set by this year’s tax and spending bill. These factors should support upward earnings momentum in 2026 across the S&P 500.

In fact, consensus expectations are for the index’s earnings to grow 14% next year with 5.4% of that growth coming from the Magnificent 7 and 8.9% from the rest of the market. This is in line with our 10-15% earnings target for 2026 as well as our view that the broadening trend will strengthen further in the upcoming months.  

RELATED CONTENT
Impact of geopolitics over time?
Chart of the week | Macroeconomic

Tensions between the U.S./Israel and Iran have recently boiled over into a military conflict, which has given many investors the jitters. However, our research shows that equity market pullbacks resulting from geopolitical events are often short lived with the S&P 500 typically higher in the months following these events.

Behind the numbers: Q4 GDP
Chart of the week | Macroeconomic

Gross domestic product undershot expectations last quarter, but the shortfall appears driven more by the temporary government shutdown than broad-based weakness. Consumer demand remains resilient, and with supportive fiscal policy, easing financial conditions and a steady labor market, the outlook points to a modest acceleration in economic activity this year.

Narrow drawdown?
Chart of the week | Macroeconomic

Equity volatility is rising, but all is not what it seems. The technology sector is weighing on the S&P 500 while value and cyclical stocks lead. A market rotation is underway as many investors begin to favor companies beyond tech.

Capex as a catalyst
Chart of the week | Macroeconomic

Improved business confidence and recent tax legislation are compelling corporations to reinvest their cash flows in their businesses. We believe this is a positive signal for economic growth.

Gathering data
Disclaimer Not Available

CONTACT US  |  +65 6432 0222