Key Takeaways:
- Yields have moved sharply higher in the U.S., driven mainly by real rates and stronger growth expectations.
- Past Fed tightening cycles show that long-term yields often continued to rise in the months following the first hike, particularly when inflation was elevated.
- Equity markets have remained relatively resilient, but rate-sensitive sectors are beginning to feel the pressure.
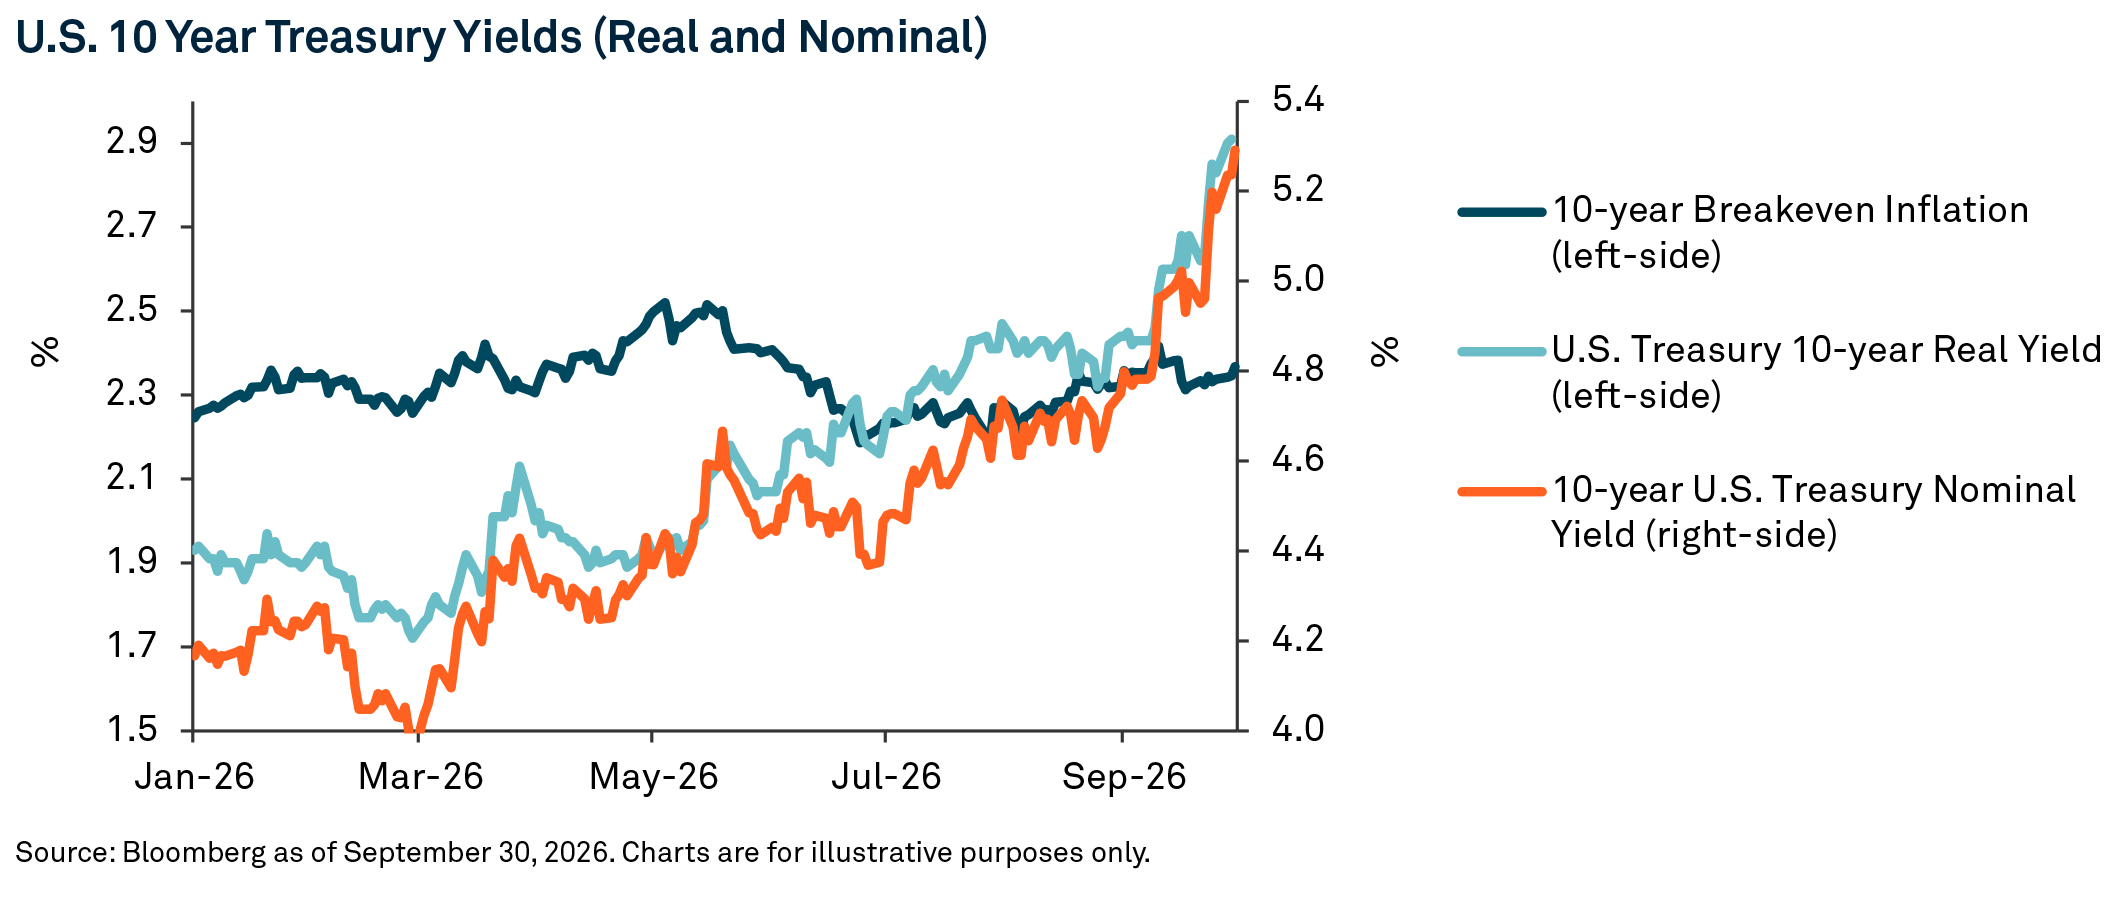
A sharp repricing has pushed 10-year U.S. Treasury yields to around 5.30% following the Federal Reserve's (Fed) 25 basis point (bp) hike in September, with real yields doing the heavy lifting. Yields are up roughly 55bps in the last month and 125bps from February, before the Iran conflict began to roil energy markets. While yields have risen globally, the increase has been more pronounced in the U.S. as expectations for future Fed rate hikes have shifted.
The recent increase has been driven mainly by real yields. Markets are now pricing in around four additional Fed hikes through the end of 2027, pushing 10-year real yields to 2.90%, their highest level since 2008. Inflation breakevens have remained stable throughout the recent selloff, with the 10-year breakeven holding around 2.35%. This suggests the rise in yields reflects a stronger nominal growth backdrop rather than a repricing of materially higher inflation risks.
History Points to More Upside
Given the pace and scale of the move in bond yields, we believe that current levels are beginning to look increasingly attractive. Yet history suggests that yields may still have further room to rise before stabilizing. In the last seven Fed tightening cycles, yields generally moved higher and curves flattened in the months after the first hike, before stabilizing three to six months later. On average, the 10-year Treasury yield rose 43bps within six months. While it is still early, the current cycle has broadly followed this pattern.
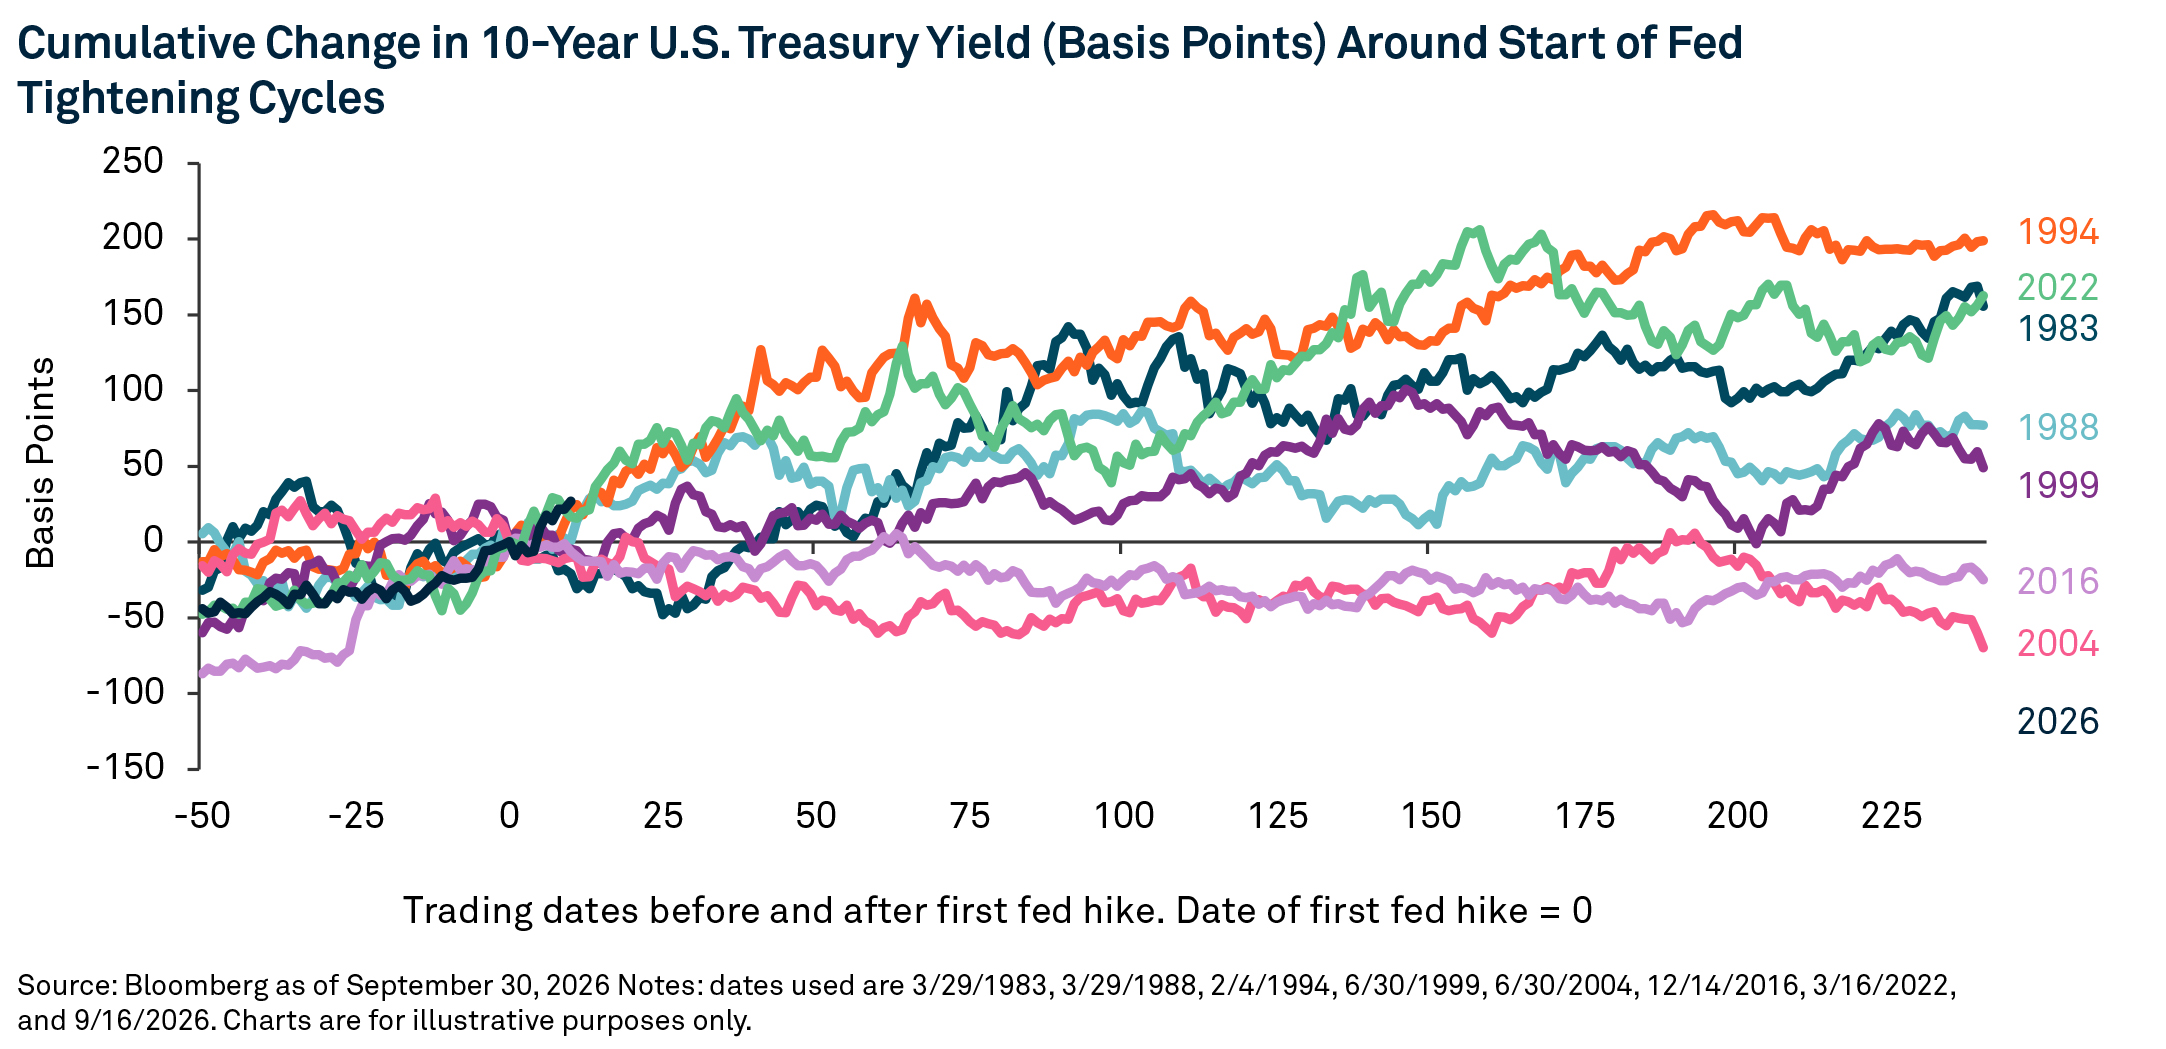
The data indicates that the risks remain skewed toward higher, rather than lower, long-term yields. The 10-year yield fell following the first Fed hike in two of the last seven tightening cycles, in 2004 and 2016, when inflation was more benign. By contrast, during the supply-driven inflationary environments of the 1980s and 2022, the 10-year yield rose between 150 and 200bps in the six months after the first hike as markets underestimated the amount of tightening needed to bring inflation under control. While the 2022 hiking cycle began from a very different starting point, with rates at the zero lower bound, financial conditions are easier today, supported by equity valuations.
Equities Hold Up for Now
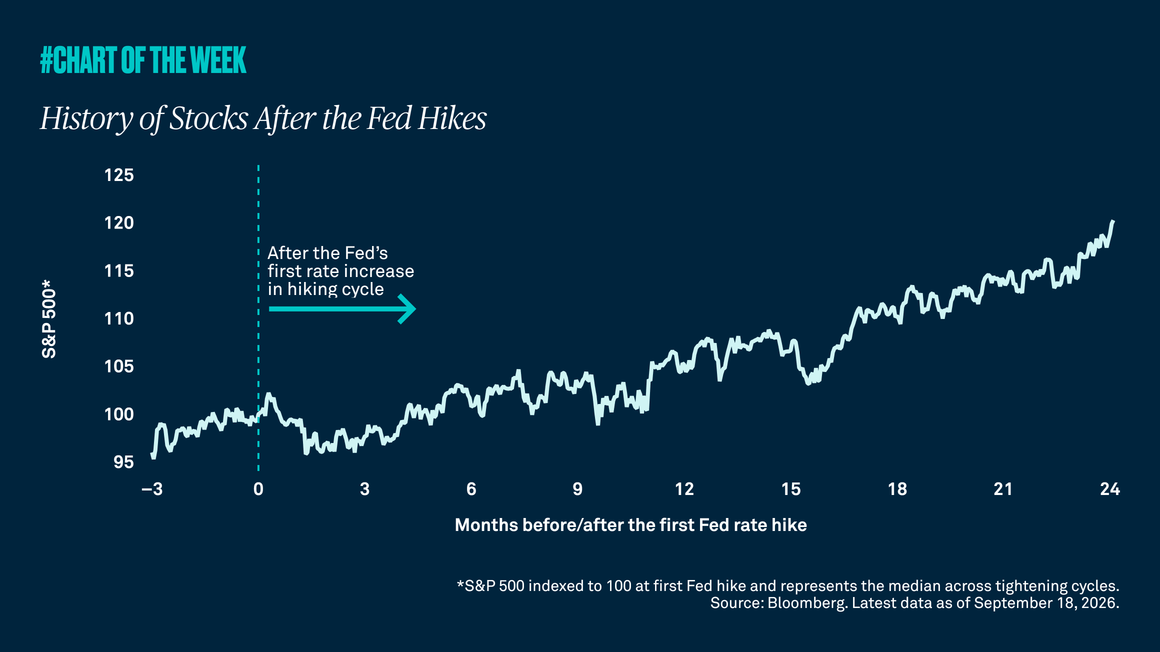
Despite the sharp rise in yields and increased bond market volatility, the impact on equities has been relatively modest. Equity volatility, as measured by the VIX Index, remains subdued compared with bond market volatility, as measured by the MOVE Index. Strong AI-related capital investment and faster nominal growth are fueling corporate earnings, helping equity markets absorb higher rates so far. But the effects of higher rates are visible beneath the surface, with long-duration sectors such as real estate, utilities, and consumer discretionary under pressure.
Treasury yields have moved sharply higher, and history suggests there may be more room to run. Higher yields are beginning to weigh on rate-sensitive areas of the equity market, but stronger nominal growth and AI-driven investment continue to support broader risk assets.
Artificial intelligence (AI) refers to computer systems that can perform tasks typically requiring human intelligence, such as visual perception, speech recognition, decision-making, and language translation.
MOVE Index is a measure of implied volatility in U.S. Treasury bond markets, often called the “VIX for bonds,” reflecting market expectations for future interest rate fluctuations.
VIX Index (Chicago Board Options Exchange Volatility Index) is a real-time market index that measures the market’s expectations of S&P 500 volatility over the next 30 days, often called the “fear gauge” because higher values indicate greater uncertainty.
Investors cannot invest directly into any index.
Important Information
BNY Investments is the brand name for the investment management business of BNY and its investment firm affiliates worldwide. BNY is the corporate brand of The Bank of New York Mellon Corporation and may be used to reference the corporation as a whole or its various subsidiaries generally.
The information contained herein reflects general views and is provided for informational purposes only. This material is not intended as investment advice nor is it a recommendation to adopt any investment strategy.
Opinions and views expressed are subject to change without notice.
Past performance is no guarantee of future results.
Issuing entities
This material is only for distribution in those countries and to those recipients listed, subject to the noted conditions and limitations: • United States: by BNY Mellon Securities Corporation (BNYSC), 240 Greenwich Street, New York, NY 10286. BNYSC, a registered broker-dealer and FINRA member, has entered into agreements to offer securities in the U.S. on behalf of certain BNY Investments firms. • Europe (excluding Switzerland): BNY Mellon Fund Management (Luxembourg) S.A., 2-4 Rue EugèneRuppertL-2453 Luxembourg. • UK, Africa and Latin America (ex-Brazil): BNY Mellon Investment Management EMEA Limited, BNY Mellon Centre, 160 Queen Victoria Street, London EC4V 4LA. Registered in England No. 1118580. Authorised and regulated by the Financial Conduct Authority. • South Africa: BNY Mellon Investment Management EMEA Limited is an authorised financial services provider. • Switzerland: BNY Mellon Investments Switzerland GmbH, Bärengasse 29, CH-8001 Zürich, Switzerland. • Middle East: DIFC branch of The Bank of New York Mellon. Regulated by the Dubai Financial Services Authority. • South East Asia and South Asia: BNY Mellon Investment Management Singapore Pte. Limited Co. Reg. 201230427E. Regulated by the Monetary Authority of Singapore. • Hong Kong: BNY Mellon Investment Management Hong Kong Limited. Regulated by the Hong Kong Securities and Futures Commission. • Japan: BNY Mellon Investment Management Japan Limited. BNY Mellon Investment Management Japan Limited is a Financial Instruments Business Operator with license no 406 (Kinsho) at the Commissioner of Kanto Local Finance Bureau and is a Member of the Investment Trusts Association, Japan and Japan Investment Advisers Association and Type II Financial Instruments Firms Association. • Brazil: ARX Investimentos Ltda., Av. Borges de Medeiros, 633, 4th floor, Rio de Janeiro, RJ, Brazil, CEP 22430-041. Authorized and regulated by the Brazilian Securities and Exchange Commission (CVM). • Canada: BNY Mellon Asset Management Canada Ltd. is registered in all provinces and territories of Canada as a Portfolio Manager and Exempt Market Dealer, and as a Commodity Trading Manager in Ontario. All issuing entities are subsidiaries of The Bank of New York Mellon Corporation.
No part of this material may be reproduced in any form, or referred to in any other publication, without express written permission. All information contained herein is proprietary and is protected under copyright law.
NOT FDIC INSURED | NO BANK GUARANTEE | MAY LOSE VALUE
© 2026 THE BANK OF NEW YORK MELLON CORPORATION
MARK-1009943-2026-10-01
IM-TRSRYYLDHIHO-1026
GU-952 - 1 October 2027