Please ensure Javascript is enabled for purposes of website accessibility Narrow Drawdown?
lu
en
institutional
institutional
false
true
Gathering data
Disclaimer Not Available

Equity volatility is rising, but all is not what it seems. The technology sector is weighing on the S&P 500 while value and cyclical stocks lead. A market rotation is underway as many investors begin to favor companies beyond tech.
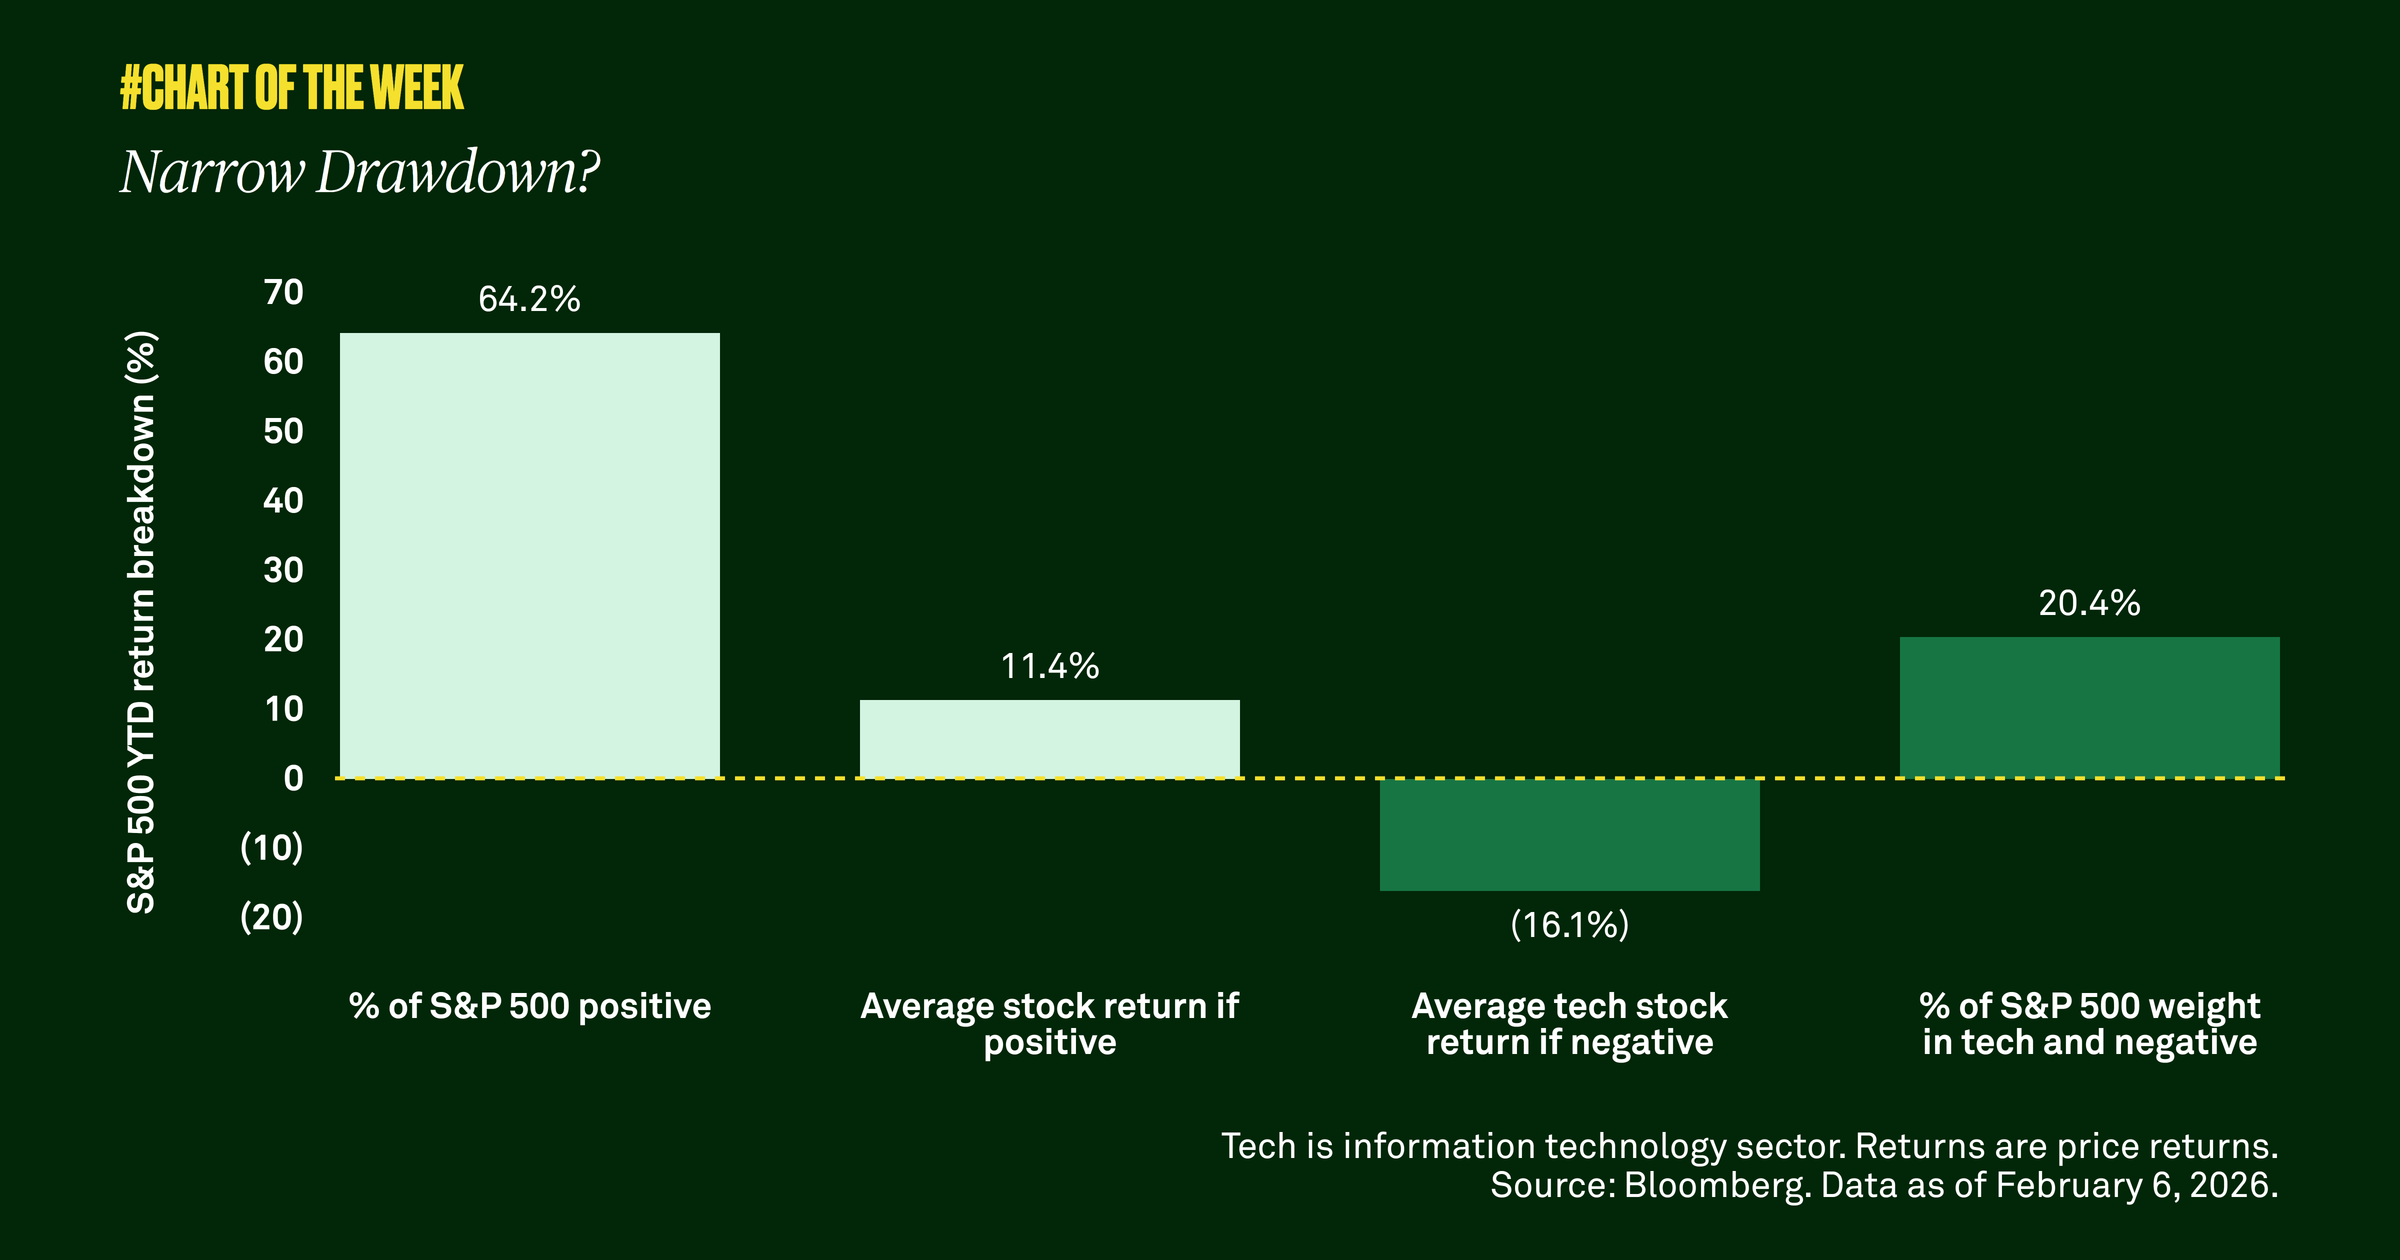

Equity market volatility has heated up since late January, causing some to fear a more pronounced sell-off may be underway. However, we examined recent performance and found that mega cap technology stocks, which once held market leadership, are driving the decline. As an example, last week software stocks were hit hard because artificial intelligence improvements caused investors to reconsider the sector's competitive positioning and long-term value. Among all the negative performers in tech, the average stock is down 16%—and the entire tech sector accounts for more than 20% of the S&P 500’s weight.

It's not all bad news. Outside of tech, S&P 500 stocks are climbing. Sixty-four percent of those stocks are positive year to date, yielding an average return of 11.4% through February 6. The reason is a market rotation is underway— out of big technology stocks and into cyclical areas such as value stocks. In our view, this trend has legs.

Cyclical stocks tend to be more sensitive to fluctuations in the economy, and right now the U.S. economy is resilient. With market participation and earnings growth broadening beyond big tech, we remind clients of the importance of diversification—across market capitalizations, sectors and even geographies.
RELATED CONTENT
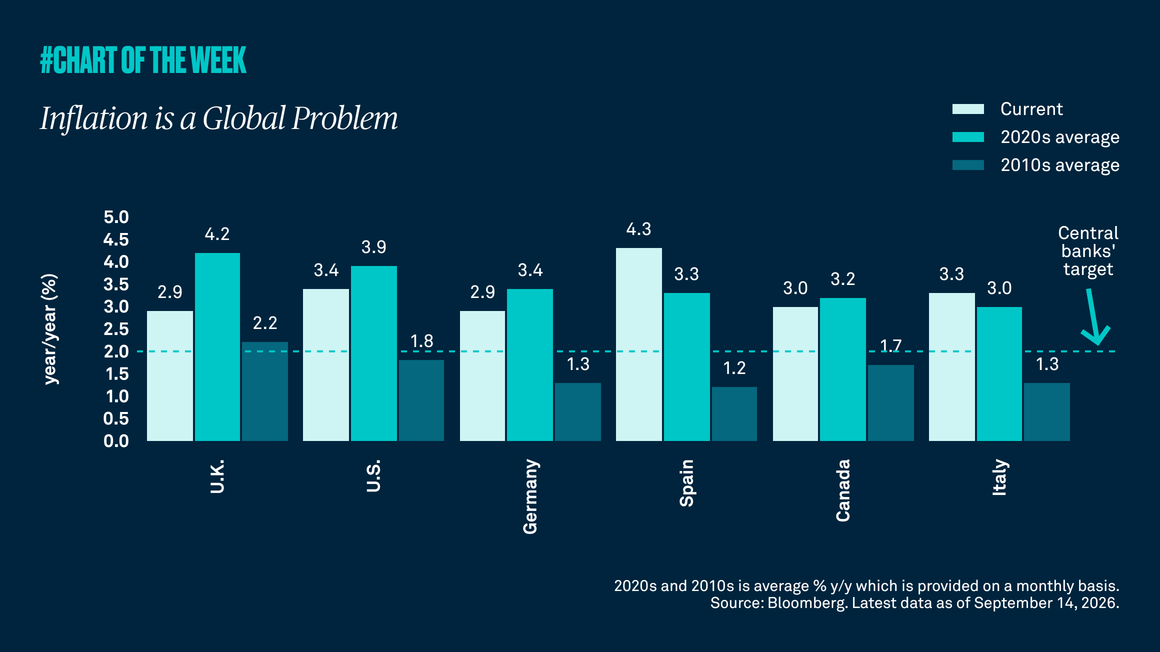
Inflation is a global problem
Chart of the Week | Macroeconomic

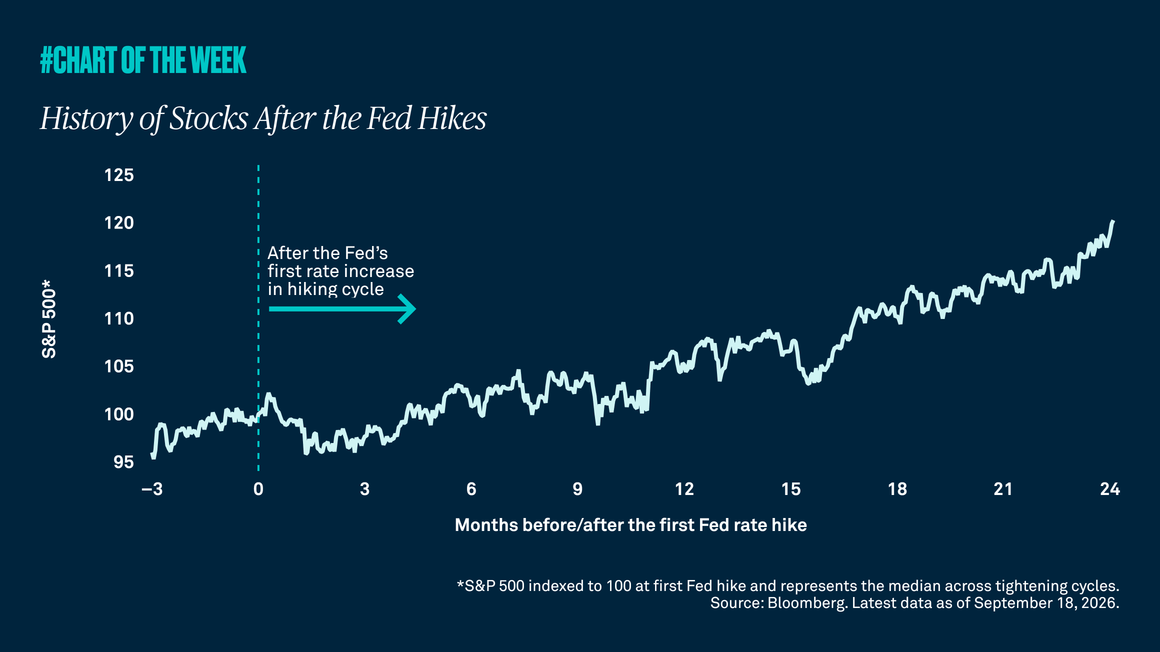
Resilient economic growth, sticky inflation driven by higher energy prices and continued geopolitical uncertainty are complicating the path back to central-bank price targets. We believe policymakers are likely to adopt a tightening bias but remain data dependent.

A good outlook for global earnings
Chart of the Week | Macroeconomic

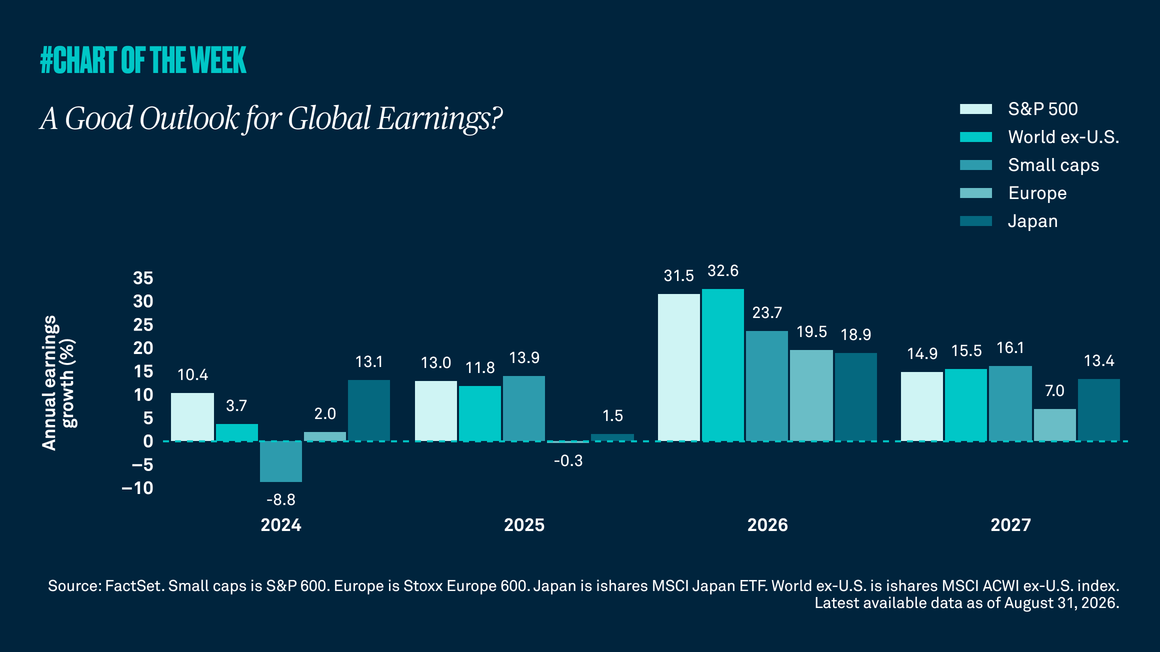
Global earnings growth has been strong this year, led by the U.S. and reinforced by improving profit growth across Europe, Japan and other major markets. While volatility may rise in the near term, above-average earnings and broader global participation remain supportive of global equities.

In a real regime shift?
Chart of the Week | Macroeconomic

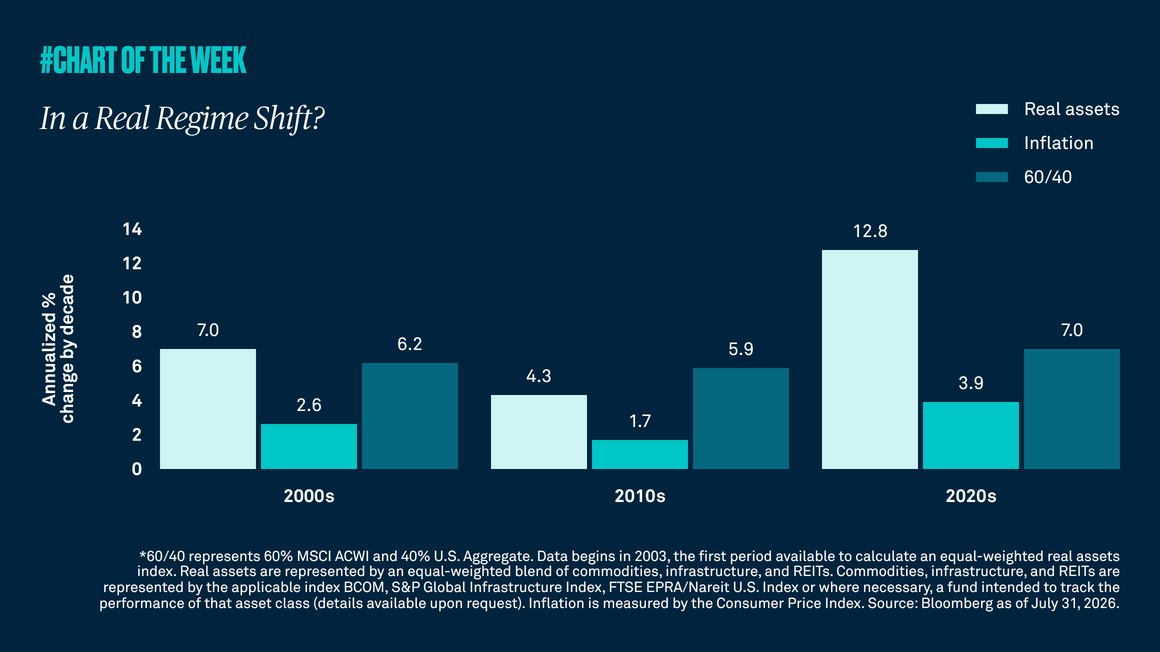
Higher inflation has been a dominant theme of the current decade. In addition to price shocks, it is being shaped by secular investment trends in infrastructure, defense spending, onshoring and the ongoing AI buildout. These structural changes reinforce the case for looking beyond traditional 60/40 portfolios to include real assets as a source of diversification and return potential in portfolios.

Getting real with real assets
Chart of the Week | Macroeconomic

Inflation appears to have transitioned from its pre-Covid average of 2% to a stickier point closer to 3%, and we do not expect a near-term return to prior levels. In this environment, we believe real assets, such as commodities, infrastructure and REITs, can provide inflation protection, diversification and return potential.

Gathering data
Disclaimer Not Available

This is a marketing communication