Please ensure Javascript is enabled for purposes of website accessibility Narrow Drawdown?
it
it
institutional
institutional
false
true
Gathering data
Disclaimer Not Available

Equity volatility is rising, but all is not what it seems. The technology sector is weighing on the S&P 500 while value and cyclical stocks lead. A market rotation is underway as many investors begin to favor companies beyond tech.


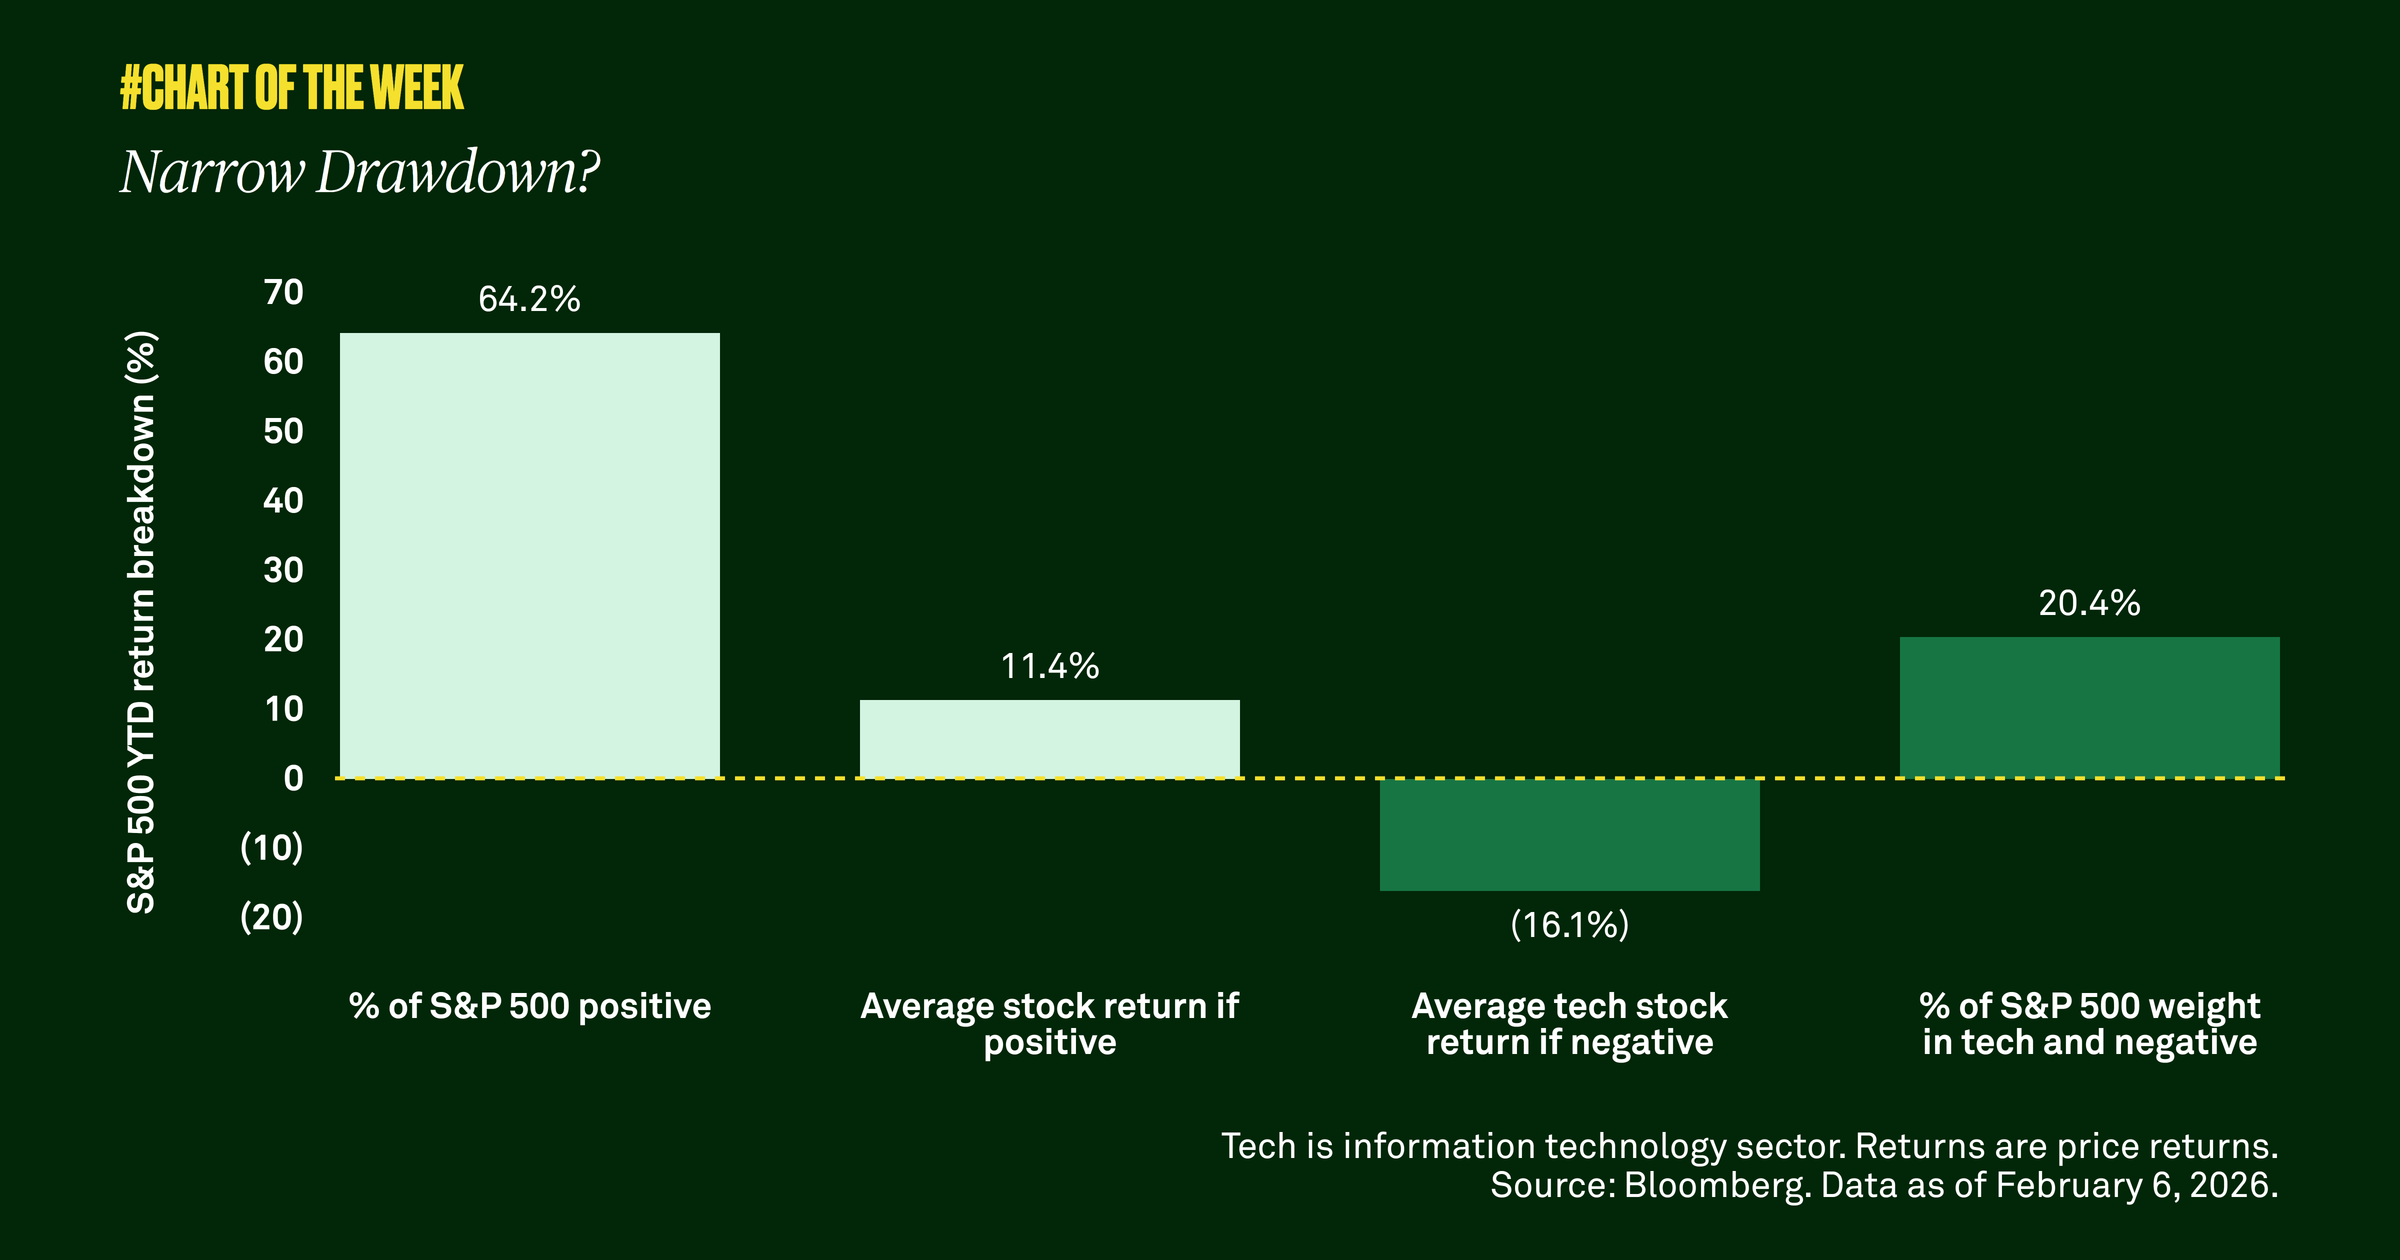
Equity market volatility has heated up since late January, causing some to fear a more pronounced sell-off may be underway. However, we examined recent performance and found that mega cap technology stocks, which once held market leadership, are driving the decline. As an example, last week software stocks were hit hard because artificial intelligence improvements caused investors to reconsider the sector's competitive positioning and long-term value. Among all the negative performers in tech, the average stock is down 16%—and the entire tech sector accounts for more than 20% of the S&P 500’s weight.

It's not all bad news. Outside of tech, S&P 500 stocks are climbing. Sixty-four percent of those stocks are positive year to date, yielding an average return of 11.4% through February 6. The reason is a market rotation is underway— out of big technology stocks and into cyclical areas such as value stocks. In our view, this trend has legs.

Cyclical stocks tend to be more sensitive to fluctuations in the economy, and right now the U.S. economy is resilient. With market participation and earnings growth broadening beyond big tech, we remind clients of the importance of diversification—across market capitalizations, sectors and even geographies.

Articoli correlati
Impact of geopolitics over time?
Chart of the week | Macroeconomico

Tensions between the U.S./Israel and Iran have recently boiled over into a military conflict, which has given many investors the jitters. However, our research shows that equity market pullbacks resulting from geopolitical events are often short lived with the S&P 500 typically higher in the months following these events.

Behind the numbers: Q4 GDP
Chart of the week | Macroeconomico

Gross domestic product undershot expectations last quarter, but the shortfall appears driven more by the temporary government shutdown than broad-based weakness. Consumer demand remains resilient, and with supportive fiscal policy, easing financial conditions and a steady labor market, the outlook points to a modest acceleration in economic activity this year.

Capex as a catalyst
Chart of the week | Macroeconomico

Improved business confidence and recent tax legislation are compelling corporations to reinvest their cash flows in their businesses. We believe this is a positive signal for economic growth.

Global leading indicator turning higher
Chart of the week | Macroeconomico

Headline volatility persists and yet the global growth outlook continues to improve. We examined a leading indicator, and why there is good cause to diversify equity holdings if you haven’t already.

Gathering data
Disclaimer Not Available

Questa è una comunicazione di marketing