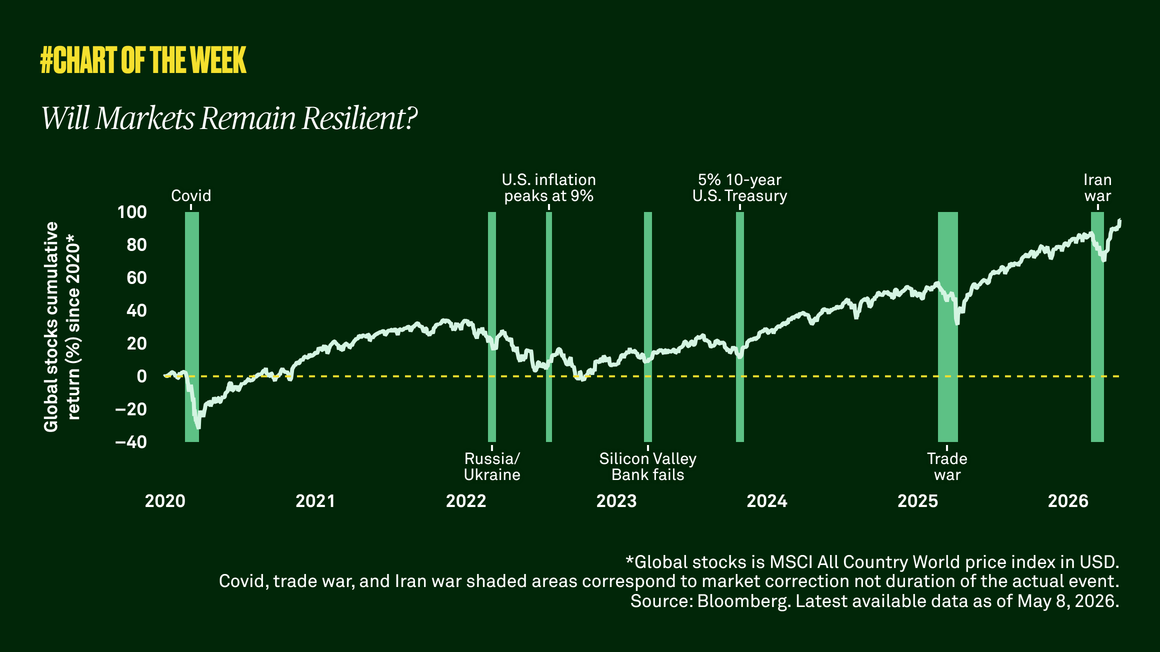
With the S&P 500® hitting new highs, investors question if fundamentals or hype is fueling the rally. Despite uncertainty, the S&P 500 has delivered strong performance year to date. Its price-to-earnings (PE) ratio now sits at 22x above the nearly 17x long-term average1. To some, that screams “overvalued,” but context matters.
While historically elevated, we see today’s valuations as part of a higher-multiple environment supported by stronger profitability and a larger index weight to tech. Economic and earnings growth remain resilient, with global earnings revisions trending higher and profitability broadening beyond big tech. Rising productivity and ongoing AI adoption should further reinforce record-level margins and long-term earnings growth. In our view, higher valuations reflect stronger fundamentals.
Strength in Numbers
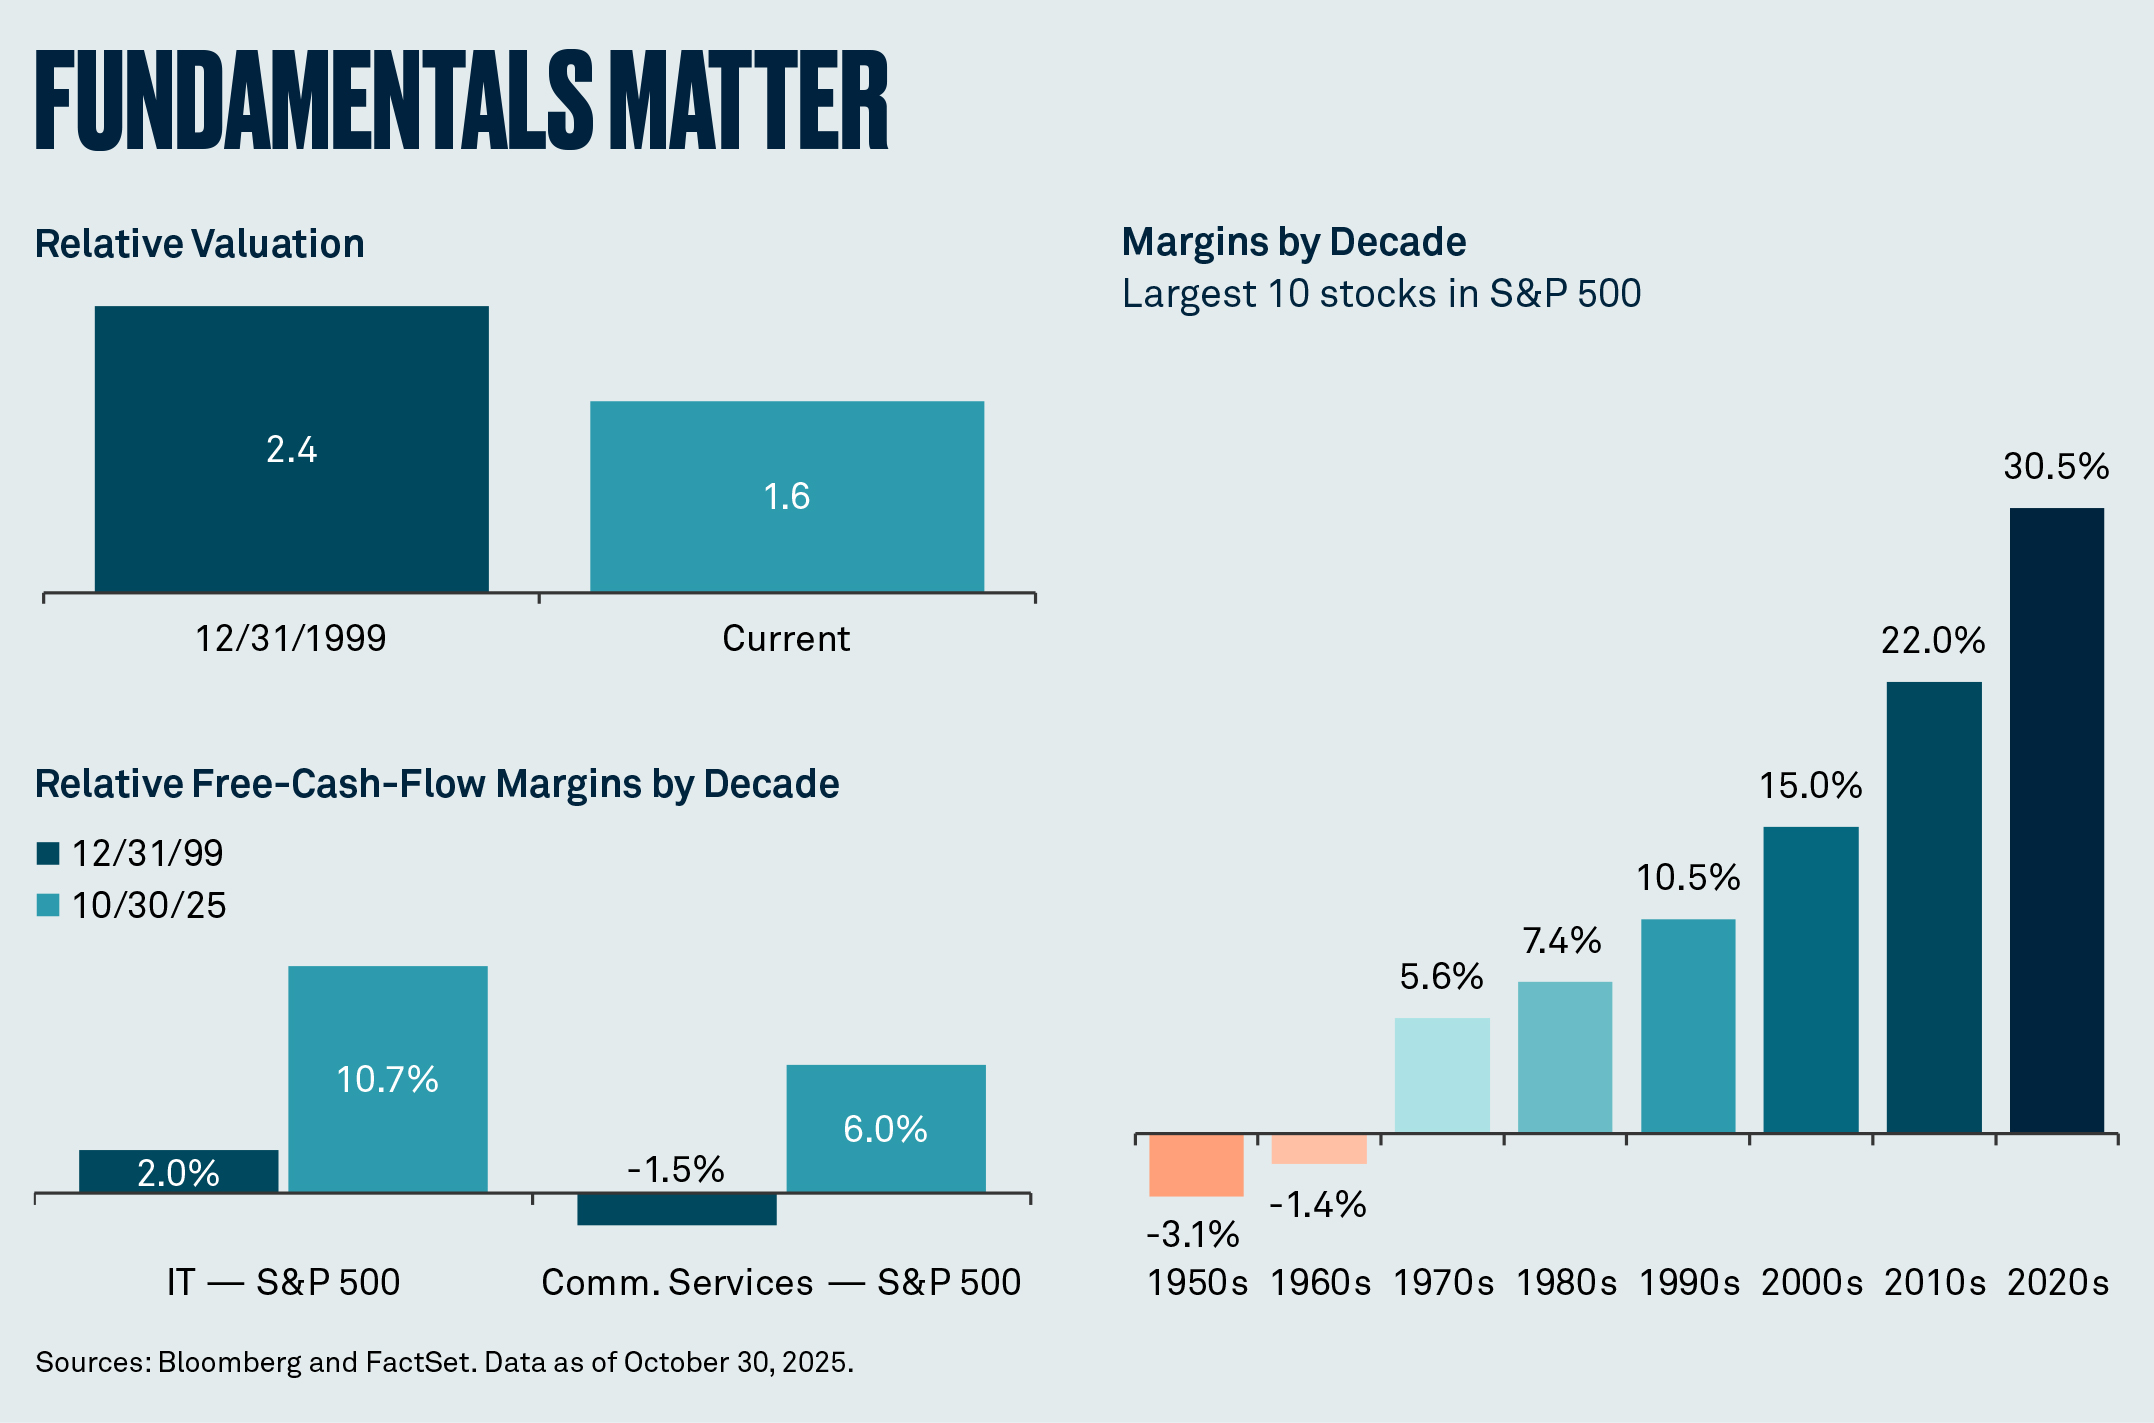
Profitability across U.S. companies is strong with the S&P 500’s operating margin2 hovering near a record high of 19%. Nowhere is that strength more visible than in tech, with sector margins nearly twice those of the broader index. In fact, technology’s weight in the S&P 500 has nearly doubled since 2010 to 36%. Tech also carries a higher PE ratio when compared to the overall index, naturally lifting the index’s multiple. We believe this reflects a structural shift toward more efficient, high-margin business models driven by innovation, scale and automation. Investors are rewarding companies not just for growth but for durable profitability.
We believe tech valuations are reasonable on a relative and fundamental basis. During the dot-com era, tech traded at a premium of 2.4x the S&P 500’s PE ratio; today the premium is about 1.6x — a much narrower gap. Profitability also tells a similar story. Information technology’s free-cash-flow margins are about 11% above the S&P 500, versus only 2% in 1999, while communication services margins are now 6% higher versus -1.5%.
A Multi-Dimensional Story
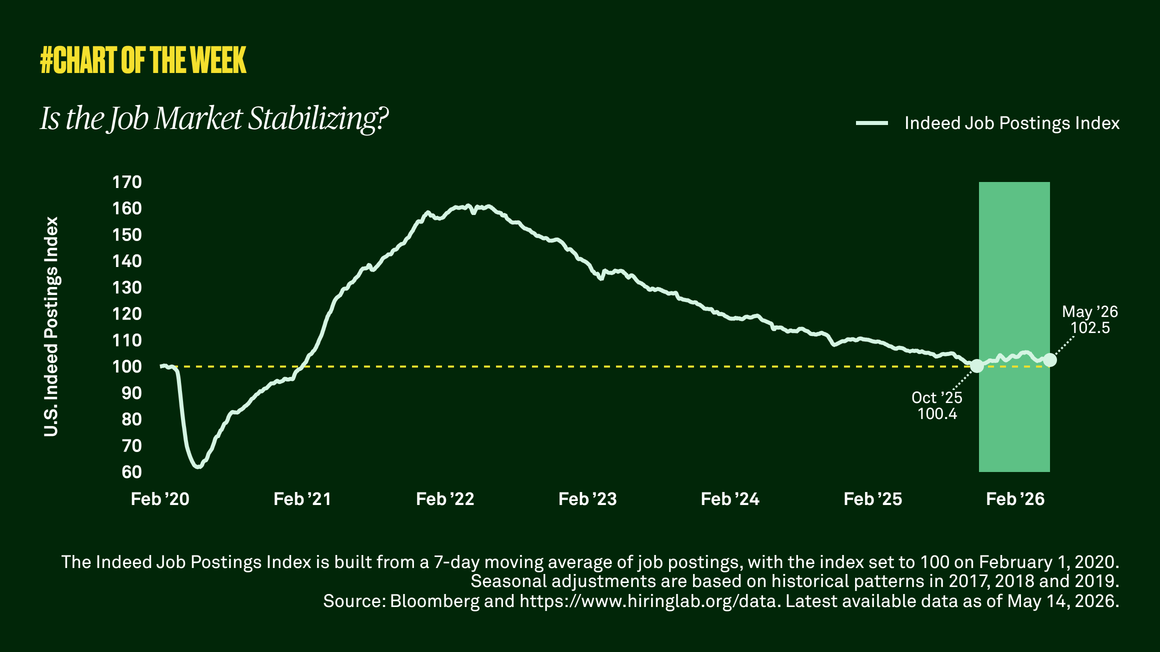
While tech is a big part of the equation, we are now seeing earnings growth broadening across sectors and regions. Overall S&P 500 earnings are forecast to rise more than 10% by the end of 2025 and more than 13% in 2026. Operating margin estimates for the average S&P 500 stock have increased to 13.7%, the highest in a year. Given current levels, multiples are unlikely to expand much further and gains will be coming from earnings growth, which we expect to continue after a better-than-expected 2025.
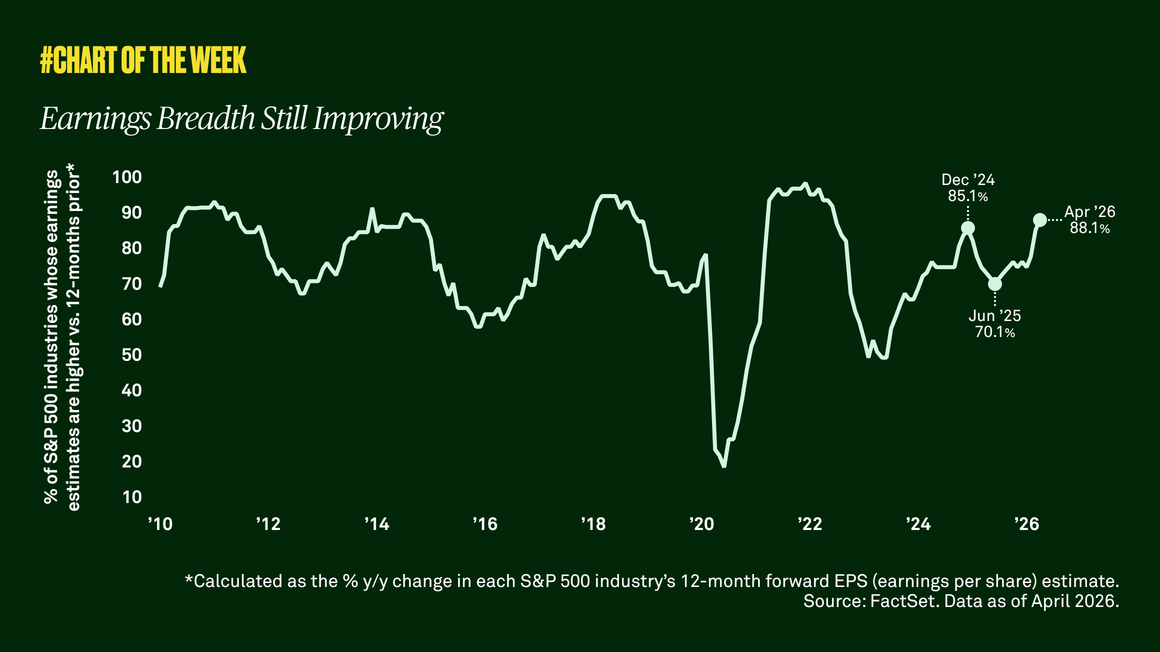
Globally, the share of firms with upward earnings revisions has reached year-to-date highs across the S&P 500, MSCI EAFE, and MSCI EM indices. From a global perspective, rising defense and infrastructure spending in Europe, reform in Japan, and the impact of Fed easing across emerging markets present opportunities as global growth broadens.
With the tailwind of Fed easing, small caps are also starting to re-emerge, trading at their lowest relative valuations since 2001. With earnings expected to outpace large cap earnings in 2026, market foundations are becoming more balanced, with more inclusive growth.
Moving forward, investors should pay attention to monetary and fiscal policy as their interaction could impact debt sustainability and financial conditions for most developed economies. A slower-than-anticipated cyclical rebound may weigh on near-term earnings, and any moderation in U.S. earnings growth, economic expansion, or productivity could undermine the case for structurally higher valuations. Overall, while risks remain, there is opportunity in staying invested and diversified.
Definitions:
MSCI EAFE Index is an equity index which captures large and mid cap representation across Developed Markets countries around the world, excluding the US and Canada.
MSCI EM (Emerging Markets) Index captures large and mid cap representation across Emerging Markets countries.
Operating margin is a key profitability metric that measures the percentage of revenue remaining after covering operating expenses, indicating how efficiently a company generates profit from its core business operations.
Price-to-earnings (P/E) ratio compares a company’s share price with its earnings per share (EPS).
S&P 500® Index is a widely accepted, unmanaged index of U.S. stock market performance. An investor cannot invest directly in any index.
1Average since 1996.
2Operating margin based on 12-month forward earnings before interest and taxes (EBIT) margin estimate per FactSet.
Important Information
For sole and exclusive use by Institutional Investors, Accredited Investors and Professional Investors only. Not for further distribution. This is a financial promotion and is not investment advice. Any views and opinions are those of the investment manager, unless otherwise noted. The value of investment can fall. Investors may not get back the amount invested. BNY, BNY Mellon and Bank of New York Mellon are the corporate brands of The Bank of New York Mellon Corporation and may also be used to reference the corporation as a whole and/or its various subsidiaries generally. BNY Investments encompass BNY Mellon’s affiliated investment management firms and global distribution companies. Any BNY entities mentioned are ultimately owned by The Bank of New York Mellon Corporation. In Hong Kong, the issuer of this document is BNY Mellon Investment Management Hong Kong Limited, which is registered with the Securities and Futures Commission (Central Entity Number: AQI762). In Singapore, this document is issued by BNY Mellon Investment Management Singapore Pte. Limited, Co. Reg. 201230427E. Regulated by the Monetary Authority of Singapore (MAS). This advertisement has not been reviewed by the Monetary Authority of Singapore.
MC672-15-12-2025 (6M)