Please ensure Javascript is enabled for purposes of website accessibility What happens on bad days?
be
en
institutional
institutional
false
true
Gathering data
Disclaimer Not Available

What happens on bad days?

What happens on bad days?

The recent one-day equity selloff reflected weaker sentiment amid election uncertainty and concerns that slower artificial intelligence spending could weigh on growth and earnings. Still, pullbacks of this magnitude have often been followed by solid returns, and we remain constructive given the economy’s resilience and AI’s long-term potential.
 

During a volatile week, the S&P 500 closed down more than 4% in a single day, marking a material decline in equities, especially AI stocks. Sentiment weakened after the election results due to concerns that AI capital spending and the pace of the data center buildout could slow. If so, economic growth and earnings momentum could also weaken.

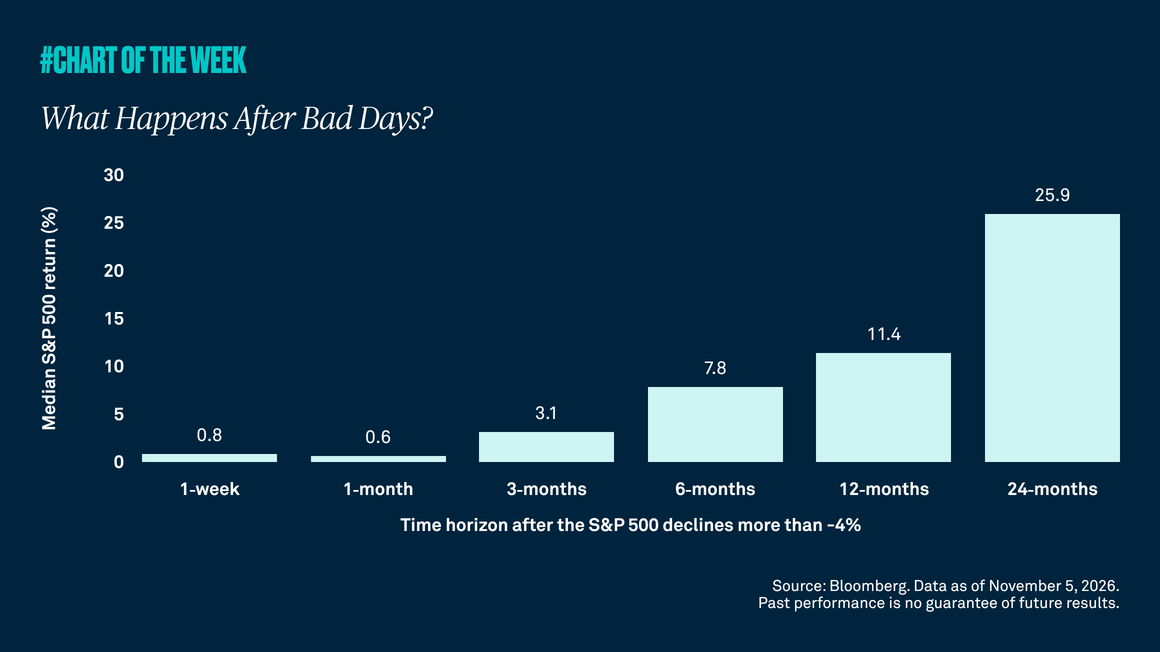
While we expect near-term volatility to persist, history suggests stocks will gradually recover, particularly if there is no recession — and we do not expect one. Since 1928, the S&P 500 has posted a one-day decline of 4% or more 159 times, or 0.6% of all trading days. Twelve months later, the index has posted a median return of 11.4%.

Looking ahead, we expect growth to slow in 2027. However, we believe the economy will continue to expand, though at a more moderate pace than this year, and that earnings growth should remain positive and even above average. We also remain constructive on the long-term AI investment case, given the technology’s potential for durable efficiency gains and productivity improvements as adoption spreads.

Our advice remains the same: stay diversified, stay fully invested and use market pullbacks to add equity exposure. 
RELATED CONTENT
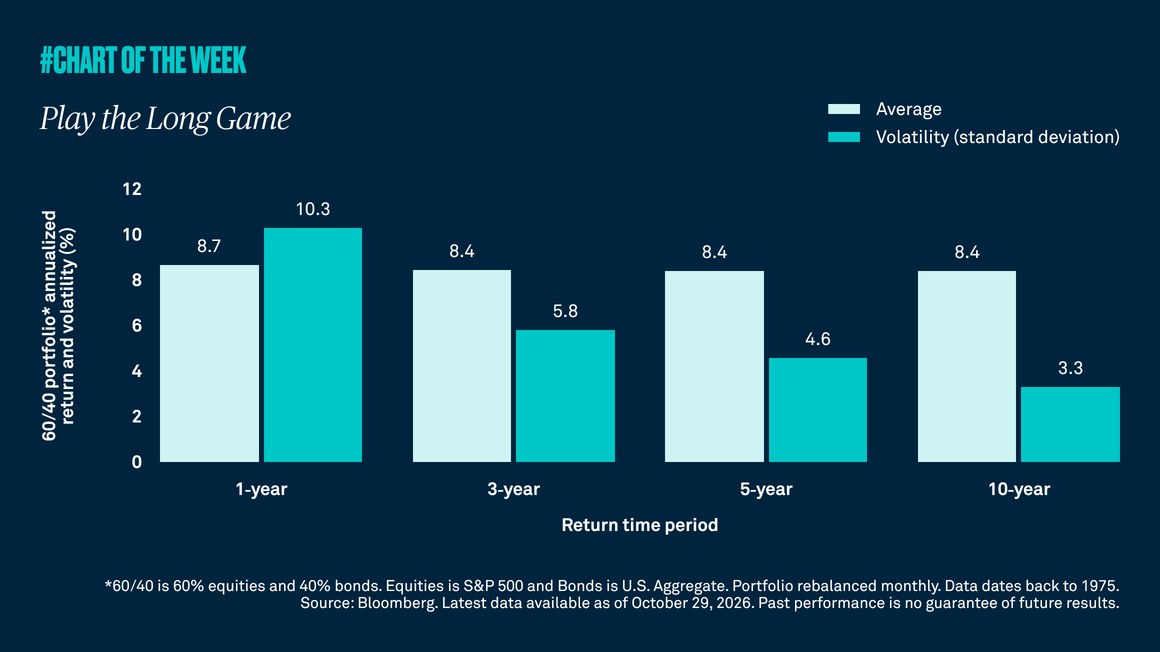
Play the long game
Chart of the Week | Macroeconomic

When it comes to investing, time matters. While headlines and short-term perspectives can lead investors to try and time the market, investors have historically been rewarded by playing the long game. Rather than overreacting to market noise, investing over longer time periods can help smooth the ride without sacrificing returns. The lesson: stay diversified and invested for the long term.

Contained contagion?
Chart of the Week | Macroeconomic

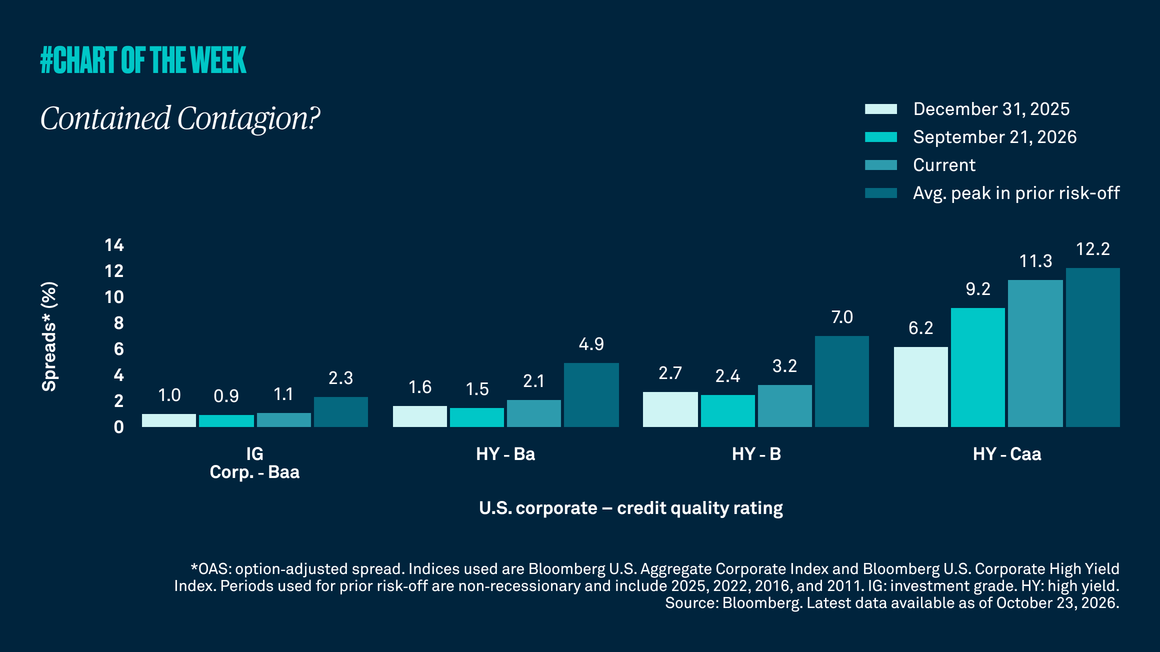
U.S. high yield credit spreads have widened year to date, reflecting greater investor caution about perceived default risk. The move also raises concerns about possible credit contagion. However, because spread widening has been concentrated in the lowest-quality issuers rather than higher-quality issuers, we don’t anticipate broader market stress.

Can the bull run in corporate margins continue?
Chart of the Week | Macroeconomic

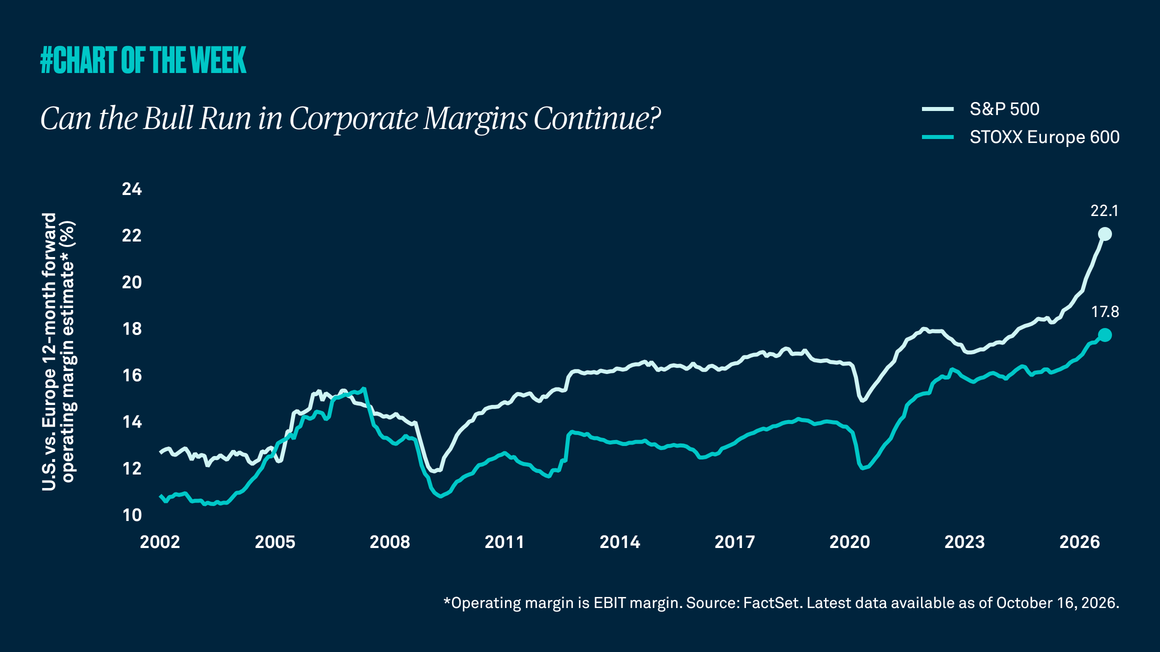
Higher inflation and elevated interest rates typically weigh on corporate profitability, yet corporate margins continue to climb to record highs. While that strength is evident both in the U.S. and abroad, U.S. outperformance versus Europe is now the widest on record. Stronger margins have helped contribute to better-than-expected earnings and reinforce U.S. equity leadership. The question now is whether that strength can persist?

Higher yields, but lower sensitivity
Chart of the Week | Macroeconomic

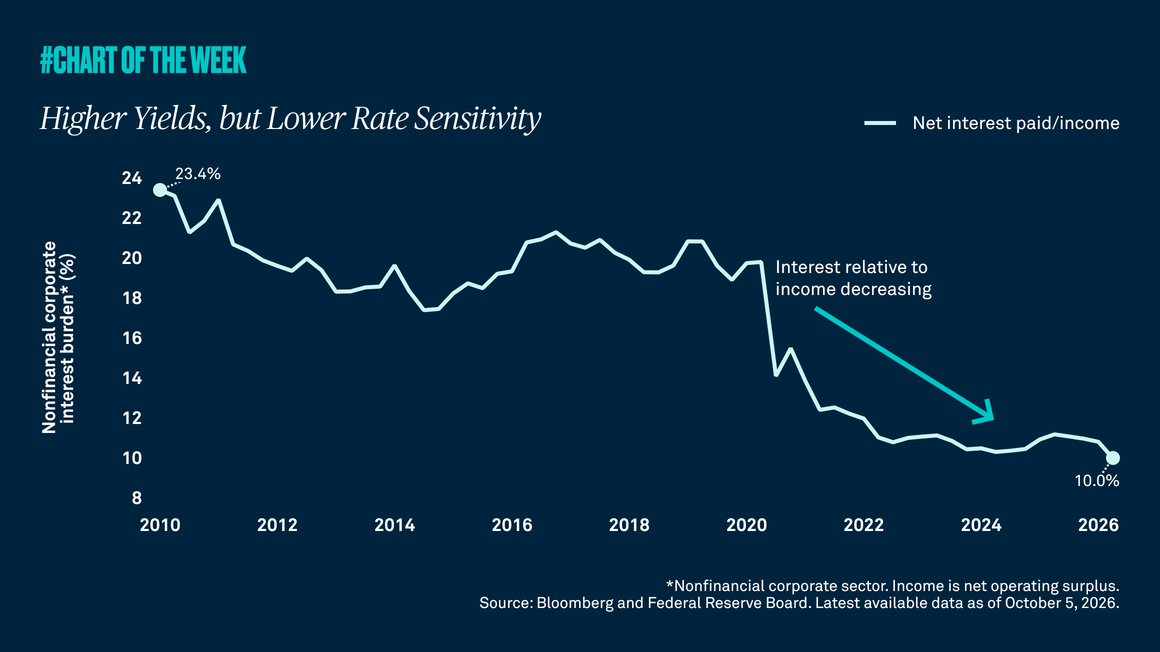
Higher interest rates have become a frequently cited risk to corporate earnings and the economy. The conventional thinking is straightforward: when borrowing costs rise, companies face higher interest expenses, profits come under pressure, and economic growth slows. While there is truth to that relationship, the current cycle may differ from investors’ expectations.

Gathering data
Disclaimer Not Available

This is a marketing communication