Please ensure Javascript is enabled for purposes of website accessibility Global Leading Indicator Turning Higher
uk
en
institutional
institutional
false
true
Gathering data
Disclaimer Not Available

Global leading indicator turning higher

Global leading indicator turning higher

Headline volatility persists and yet the global growth outlook continues to improve.  We examined a leading indicator, and why there is good cause to diversify equity holdings if you haven’t already.


Headline volatility has risen recently as geopolitics in different corners of the globe play out on the world stage. While these headlines have been a source of uncertainty, the global economic outlook for 2026 appears to be improving.

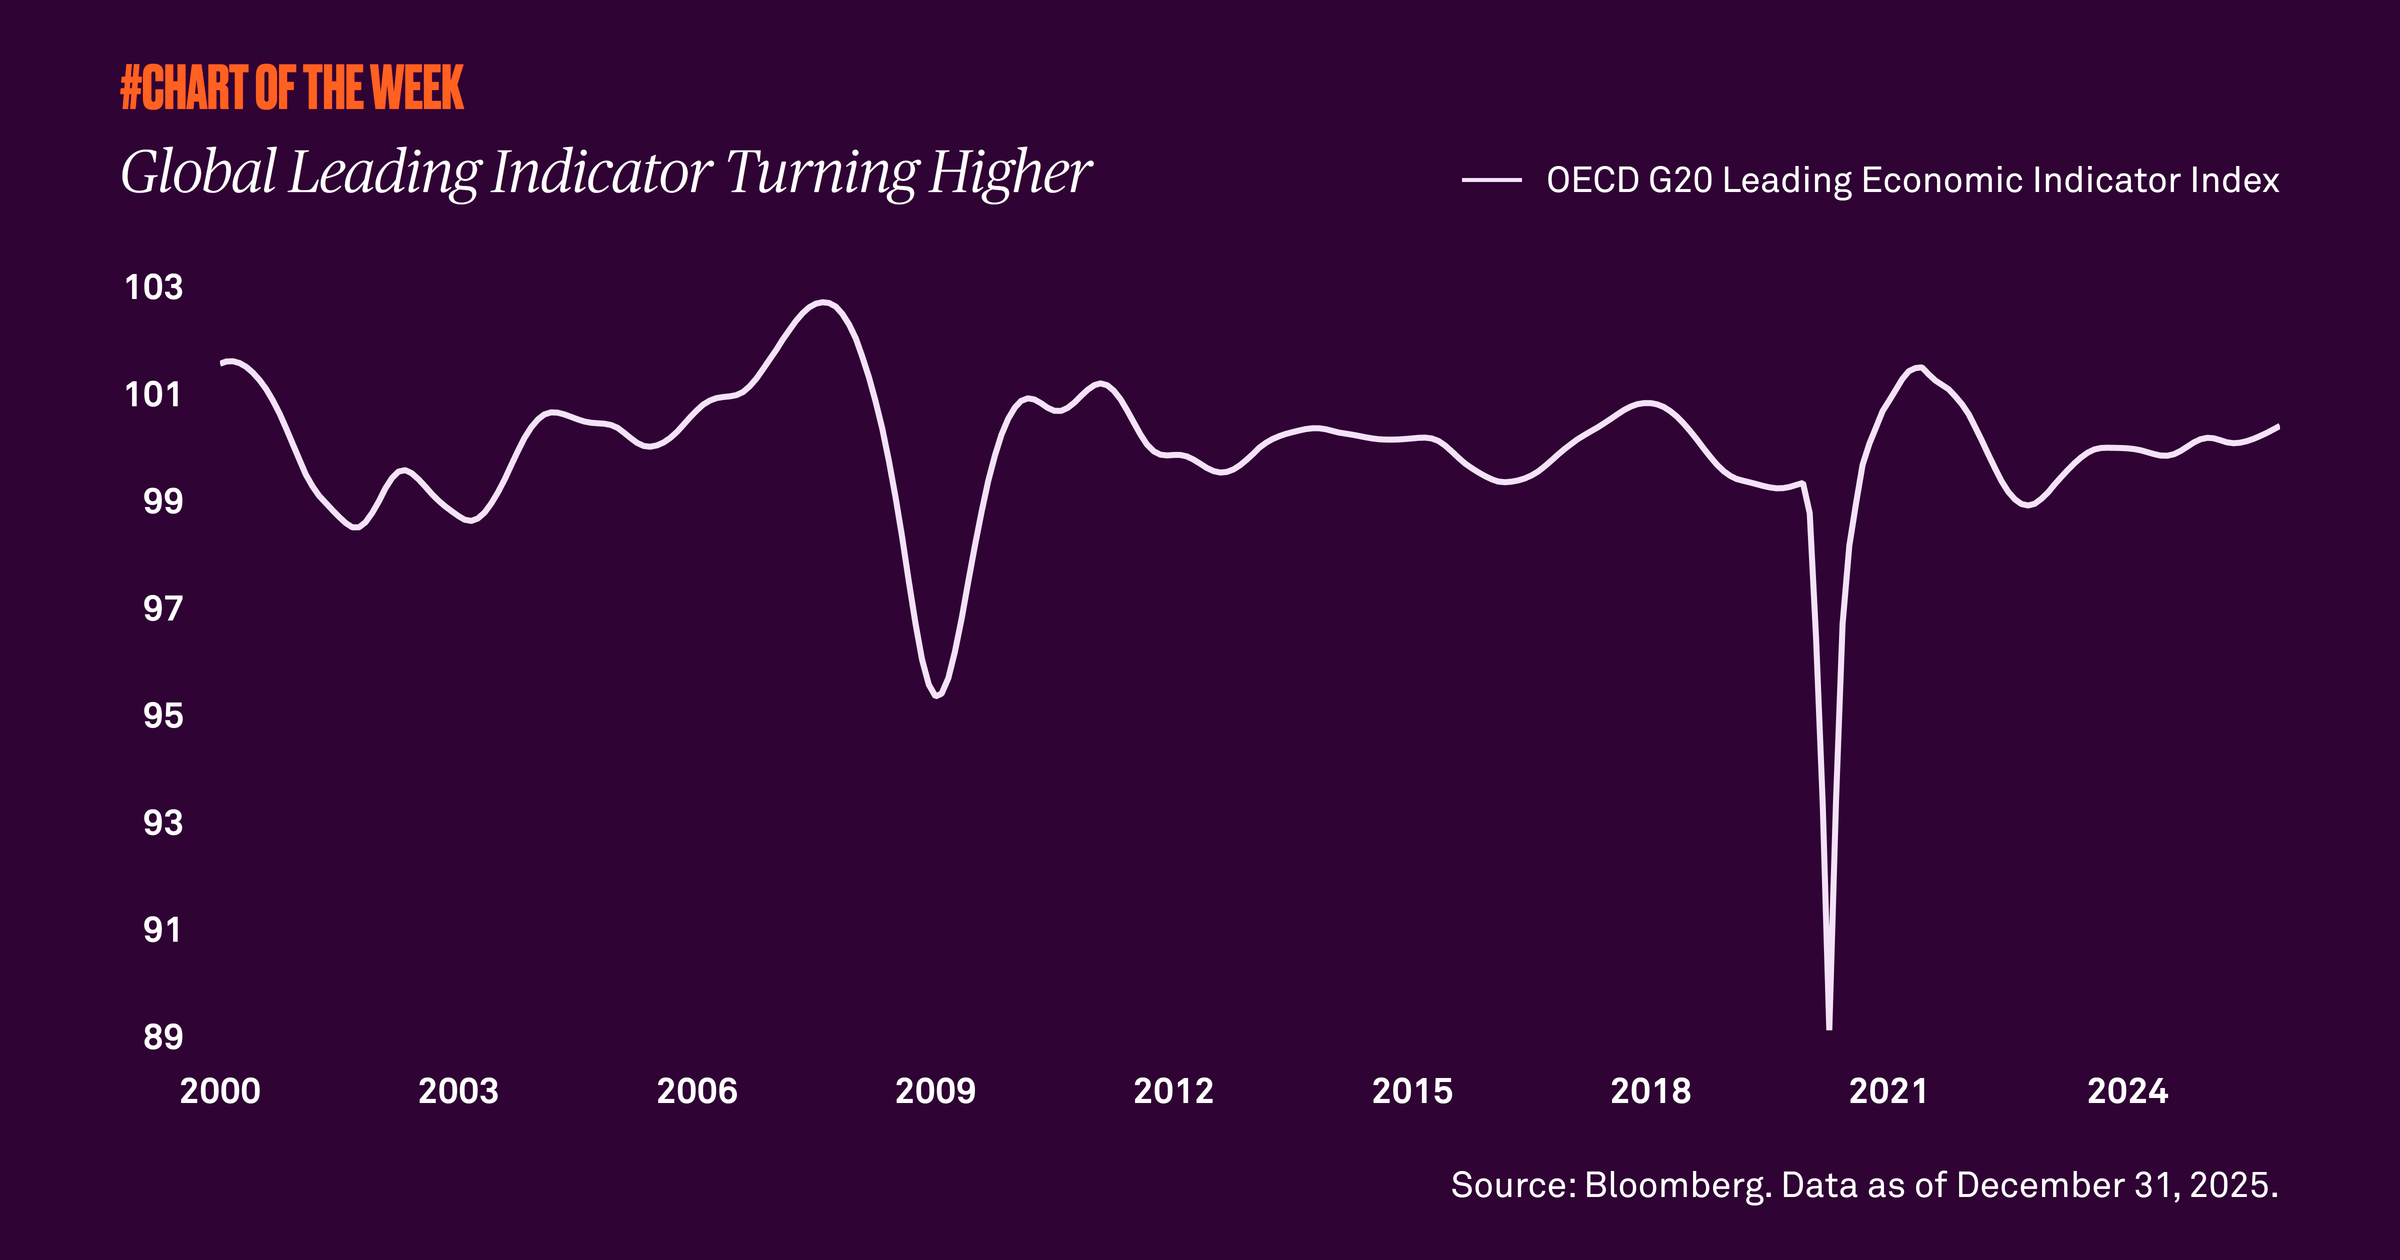
The Organisation for Economic Co-operation and Development operates as an international forum for democratic countries to promote economic growth. Its G20 Composite Leading Indicator Index, a proxy for global activity, has reached its highest level in three years. This means that some of the world’s largest economies are expected to experience growth near or above long-term trends. Historically, an improved outlook has led to positive equity returns across both developed and emerging markets.

What does this mean for investors? Despite these headlines, stocks have proven resilient with positive equity returns year to date across the major global equity indices. Given this improved outlook, we have recently recommended increasing exposure to international and emerging markets to capture potential upside. While we still favor U.S. equities, we believe global diversification will remain critical in the year ahead. 

RELATED CONTENT
Returns after oil spikes
Chart of the week | Macroeconomic

The Strait of Hormuz, which moves about 20% of global oil, has seen many ships that normally travel through it curtail their activity. Consequently, WTI oil was up over 36% in the five days after the oil supply shock began. Yet equities barely budged, signaling a temporary supply shock, not a larger crisis. Historically, after similar price spikes equities tend to move higher while oil prices decline — further evidence for avoiding emotion-driven investing.

Impact of geopolitics over time?
Chart of the week | Macroeconomic

Tensions between the U.S./Israel and Iran have recently boiled over into a military conflict, which has given many investors the jitters. However, our research shows that equity market pullbacks resulting from geopolitical events are often short lived with the S&P 500 typically higher in the months following these events.

Behind the numbers: Q4 GDP
Chart of the week | Macroeconomic

Gross domestic product undershot expectations last quarter, but the shortfall appears driven more by the temporary government shutdown than broad-based weakness. Consumer demand remains resilient, and with supportive fiscal policy, easing financial conditions and a steady labor market, the outlook points to a modest acceleration in economic activity this year.

Narrow drawdown?
Chart of the week | Macroeconomic

Equity volatility is rising, but all is not what it seems. The technology sector is weighing on the S&P 500 while value and cyclical stocks lead. A market rotation is underway as many investors begin to favor companies beyond tech.

Gathering data
Disclaimer Not Available

This is a marketing communication