Please ensure Javascript is enabled for purposes of website accessibility Global Leading Indicator Turning Higher
sg
en
institutional
institutional
false
true
Gathering data
Disclaimer Not Available

Global leading indicator turning higher

Global leading indicator turning higher

Headline volatility persists and yet the global growth outlook continues to improve.  We examined a leading indicator, and why there is good cause to diversify equity holdings if you haven’t already.
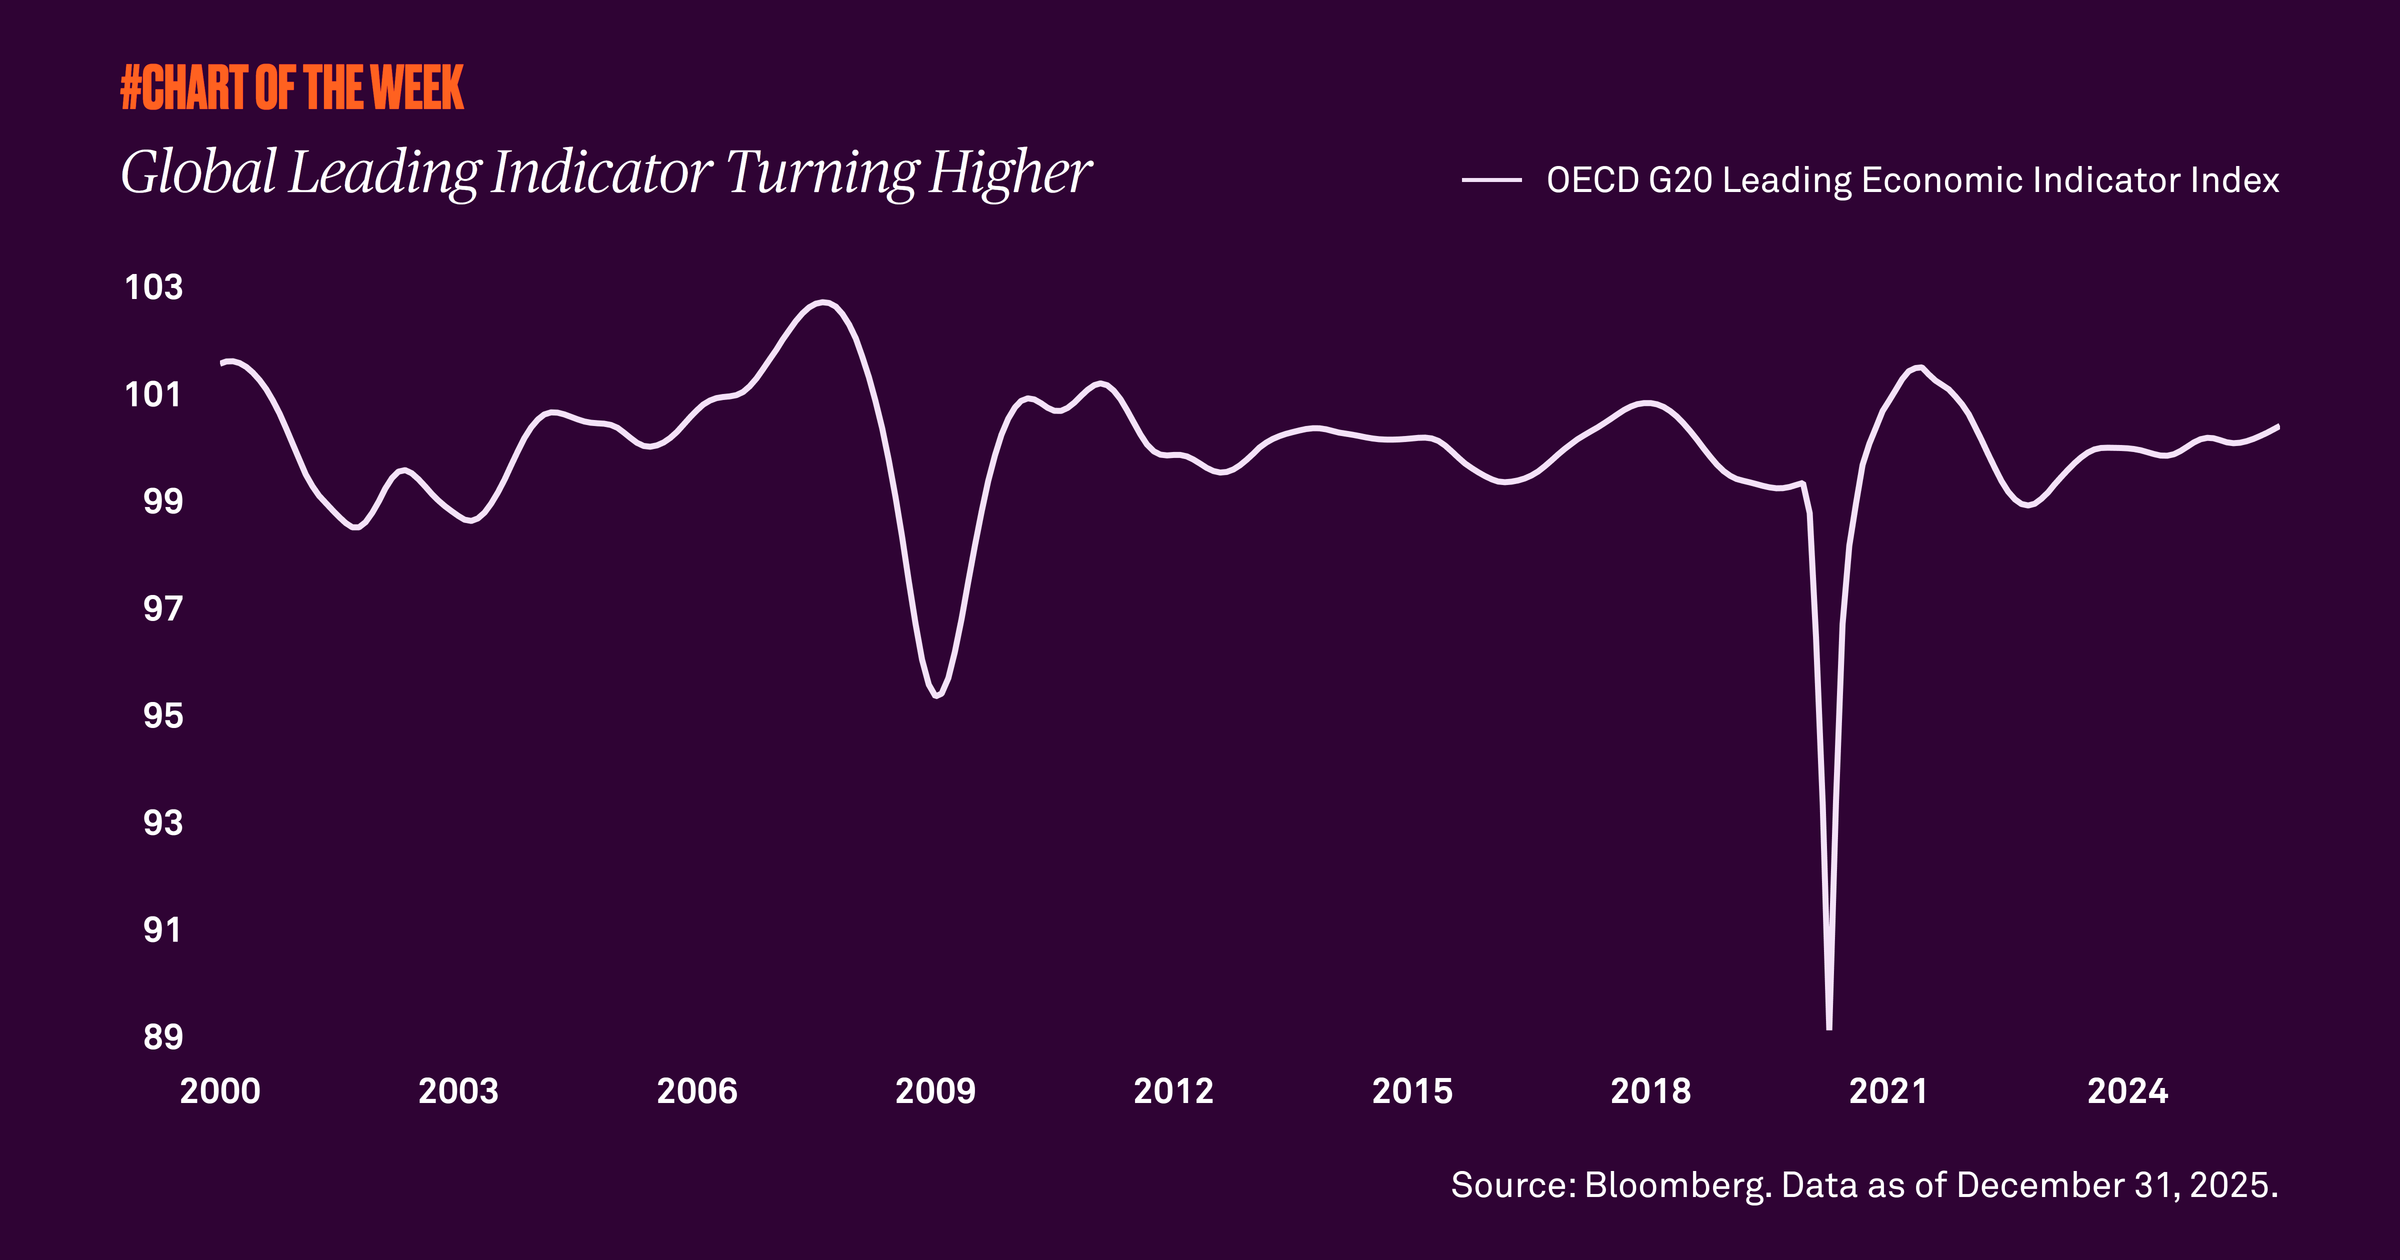

Headline volatility has risen recently as geopolitics in different corners of the globe play out on the world stage. While these headlines have been a source of uncertainty, the global economic outlook for 2026 appears to be improving.

The Organisation for Economic Co-operation and Development operates as an international forum for democratic countries to promote economic growth. Its G20 Composite Leading Indicator Index, a proxy for global activity, has reached its highest level in three years. This means that some of the world’s largest economies are expected to experience growth near or above long-term trends. Historically, an improved outlook has led to positive equity returns across both developed and emerging markets.

What does this mean for investors? Despite these headlines, stocks have proven resilient with positive equity returns year to date across the major global equity indices. Given this improved outlook, we have recently recommended increasing exposure to international and emerging markets to capture potential upside. While we still favor U.S. equities, we believe global diversification will remain critical in the year ahead. 
RELATED CONTENT
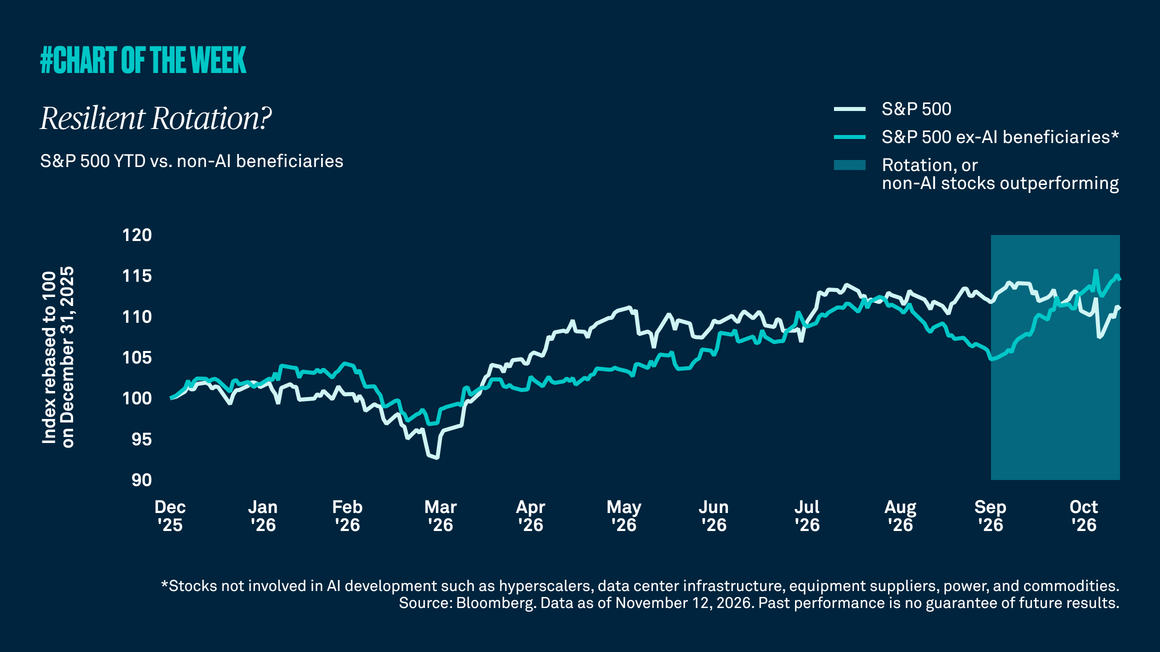
Resilient rotation
Chart of the Week | Macroeconomic

Market leadership has shifted as investors are rotating away from AI and technology shares, with non-AI beneficiaries outperforming the broader index year to date. While recent volatility has weighed on AI-related stocks, healthier breadth and resilient earnings expectations support a constructive outlook on equities overall.

What happens on bad days?
Chart of the Week | Macroeconomic

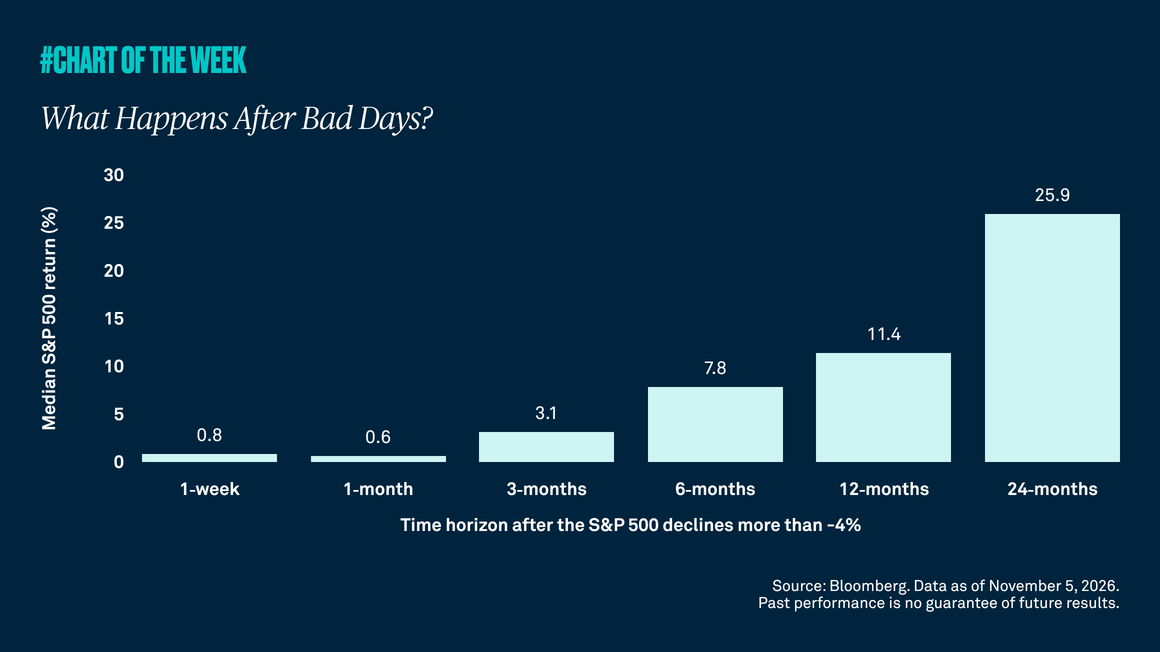
The recent one-day equity selloff reflected weaker sentiment amid election uncertainty and concerns that slower artificial intelligence spending could weigh on growth and earnings. Still, pullbacks of this magnitude have often been followed by solid returns, and we remain constructive given the economy’s resilience and AI’s long-term potential.

Play the long game
Chart of the Week | Macroeconomic

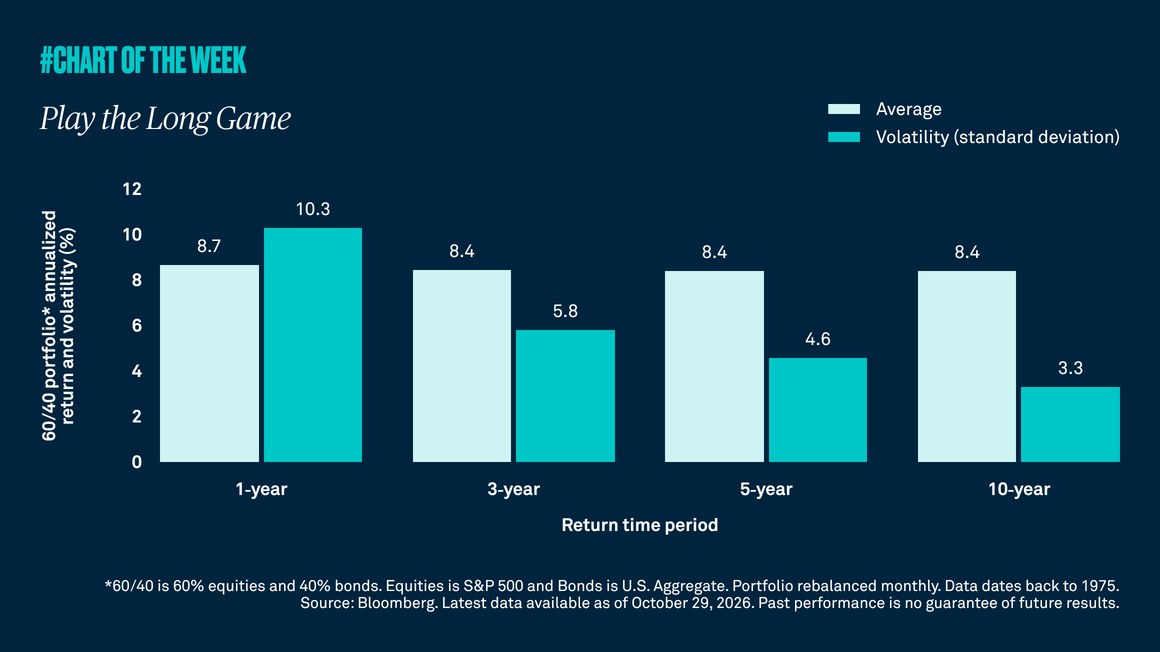
When it comes to investing, time matters. While headlines and short-term perspectives can lead investors to try and time the market, investors have historically been rewarded by playing the long game. Rather than overreacting to market noise, investing over longer time periods can help smooth the ride without sacrificing returns. The lesson: stay diversified and invested for the long term.

Contained contagion?
Chart of the Week | Macroeconomic

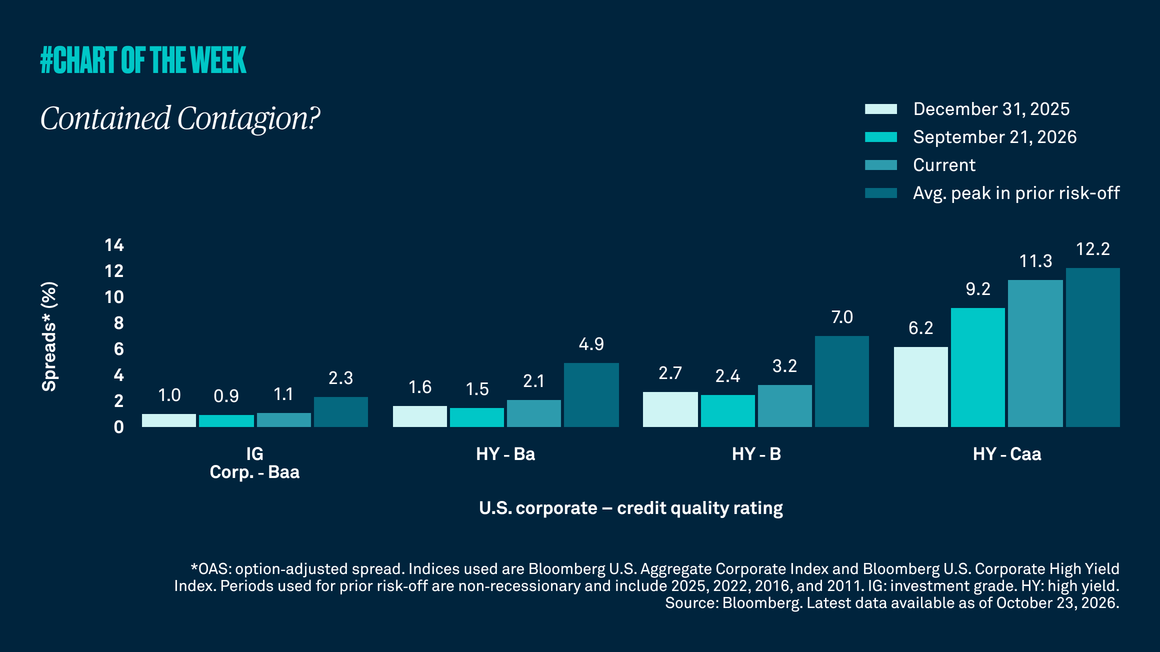
U.S. high yield credit spreads have widened year to date, reflecting greater investor caution about perceived default risk. The move also raises concerns about possible credit contagion. However, because spread widening has been concentrated in the lowest-quality issuers rather than higher-quality issuers, we don’t anticipate broader market stress.

Gathering data
Disclaimer Not Available

CONTACT US  |  +65 6432 0222