Although companies benefiting most directly from AI-related capital spending are the main drivers of higher earnings, strength is no longer confined to that group. Earnings across the broader market remain solid and are expected to grow more than 10% this year and next, suggesting the risk of concentrated market leadership may not be founded.
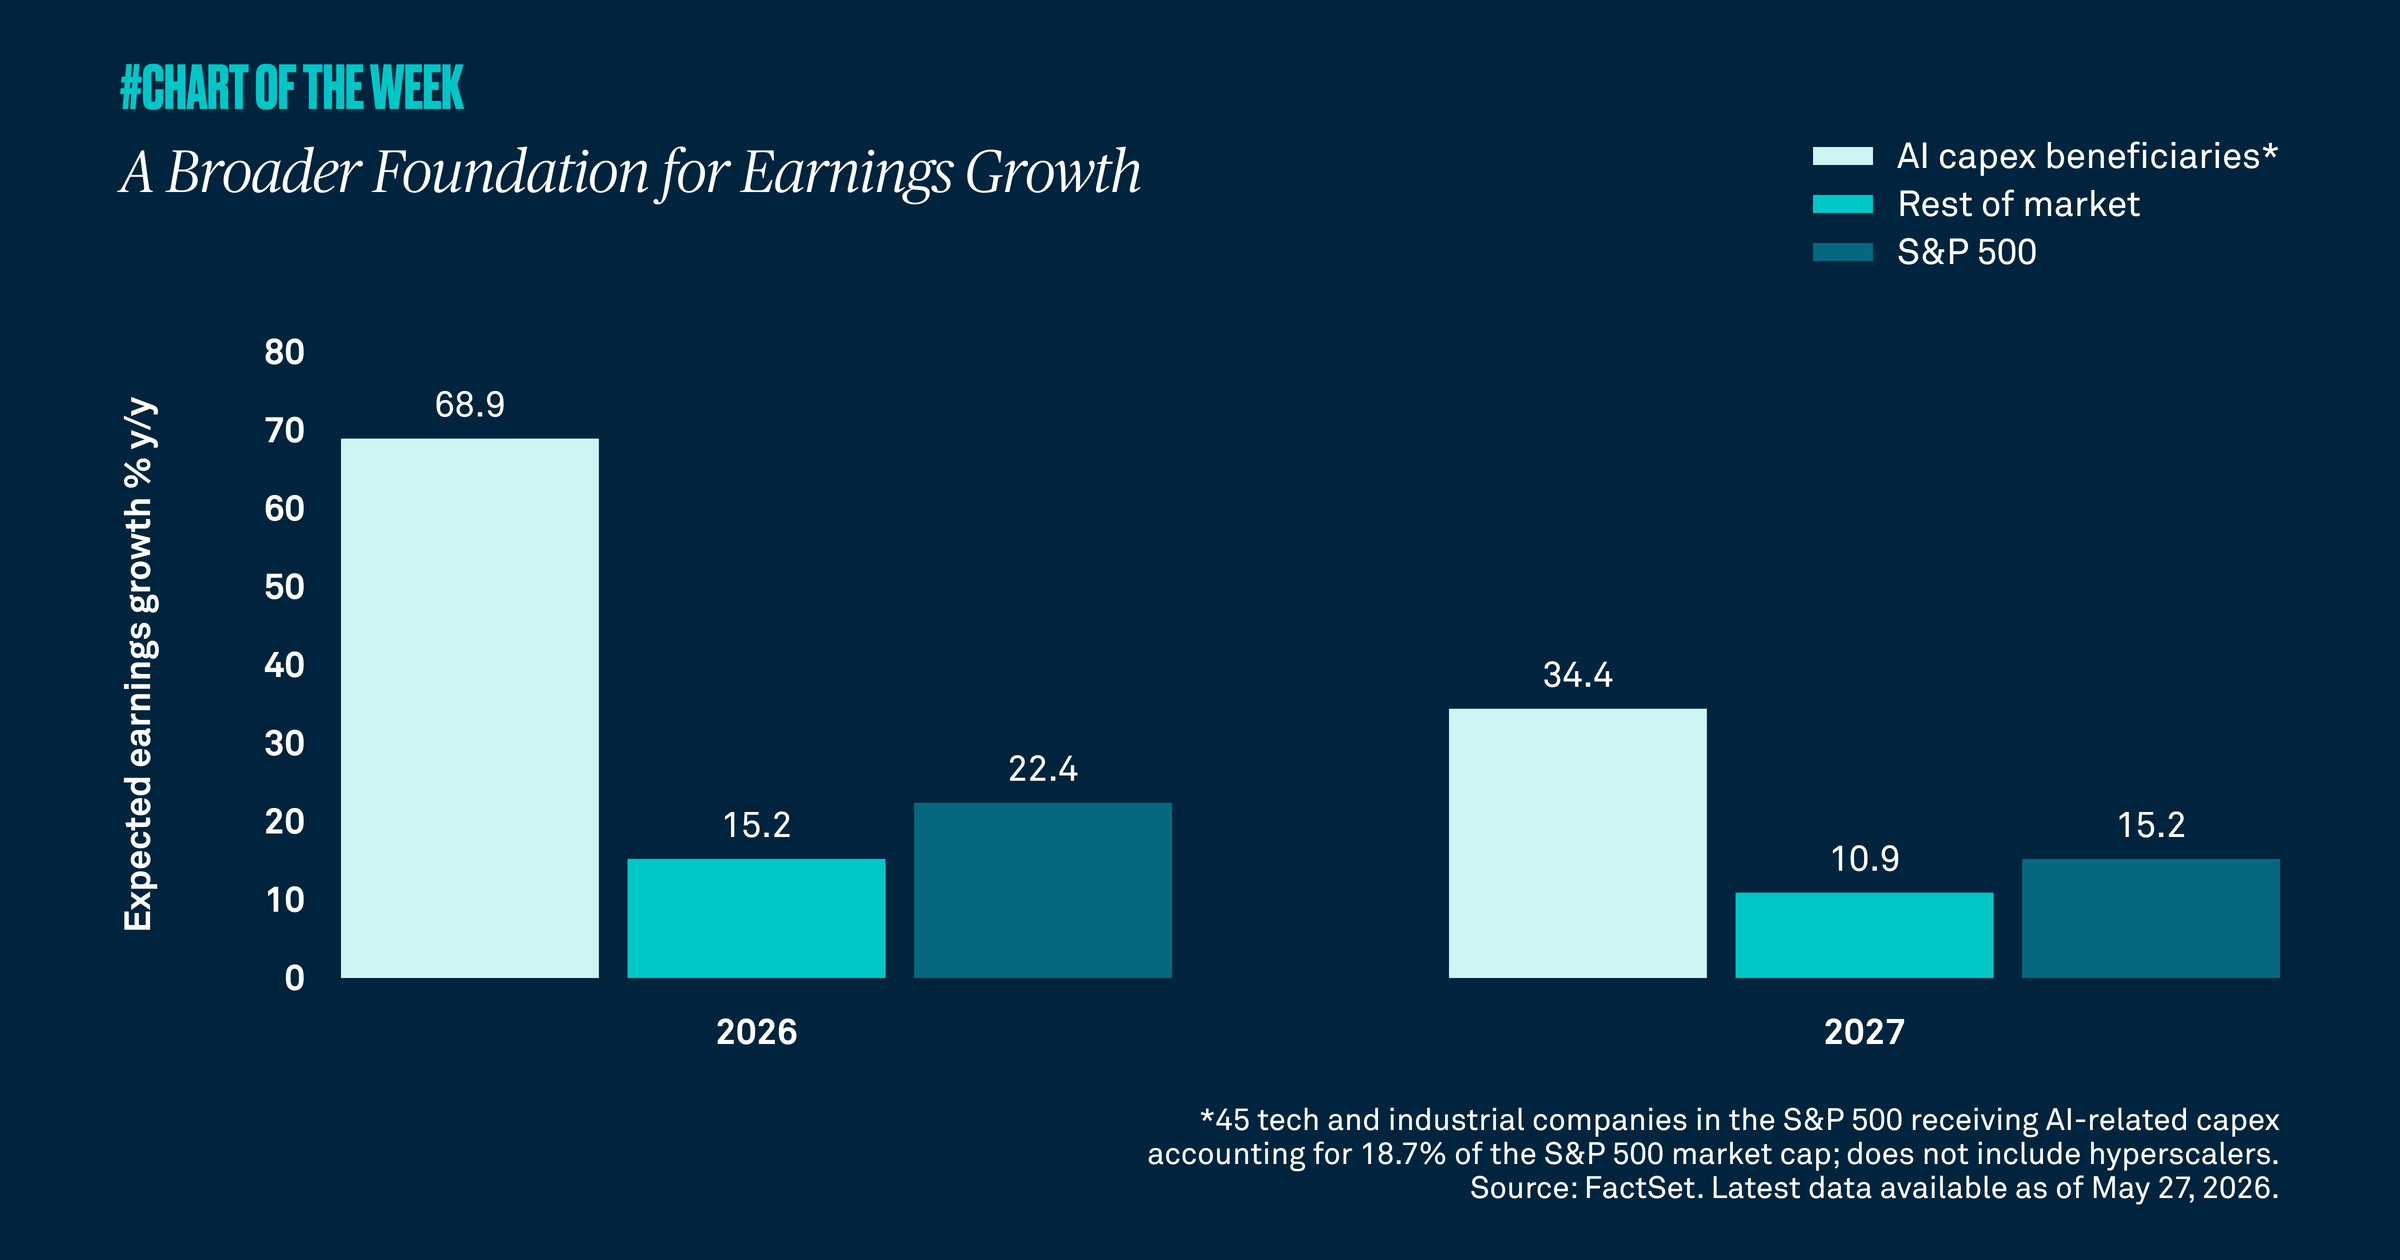
First-quarter earnings were better than expected, with attention now shifting to full-year expectations. Consensus forecasts now call for S&P 500 earnings growth of 22% in 2026 and 15% in 2027. That optimism is partially rooted in companies most directly benefiting from AI-related capital spending. This group is expected to deliver earnings growth of about 70% this year and 34% next year, which raises the issue of whether a narrow set of stocks is responsible for the acceleration in earnings growth and much of the S&P 500’s year-to-date advance.
There is some truth there; however, that question does not capture the full picture. First-quarter results have come in stronger than expected, with S&P 500 earnings growth at about 29% and 85% of companies beating estimates. More importantly, earnings growth outside the top AI capital expenditure beneficiaries remains solid. That broader segment of the market is still expected to grow earnings by 15% this year and 11% next year — both above the roughly 10% average annualized growth rate for overall S&P 500 earnings since 2010.
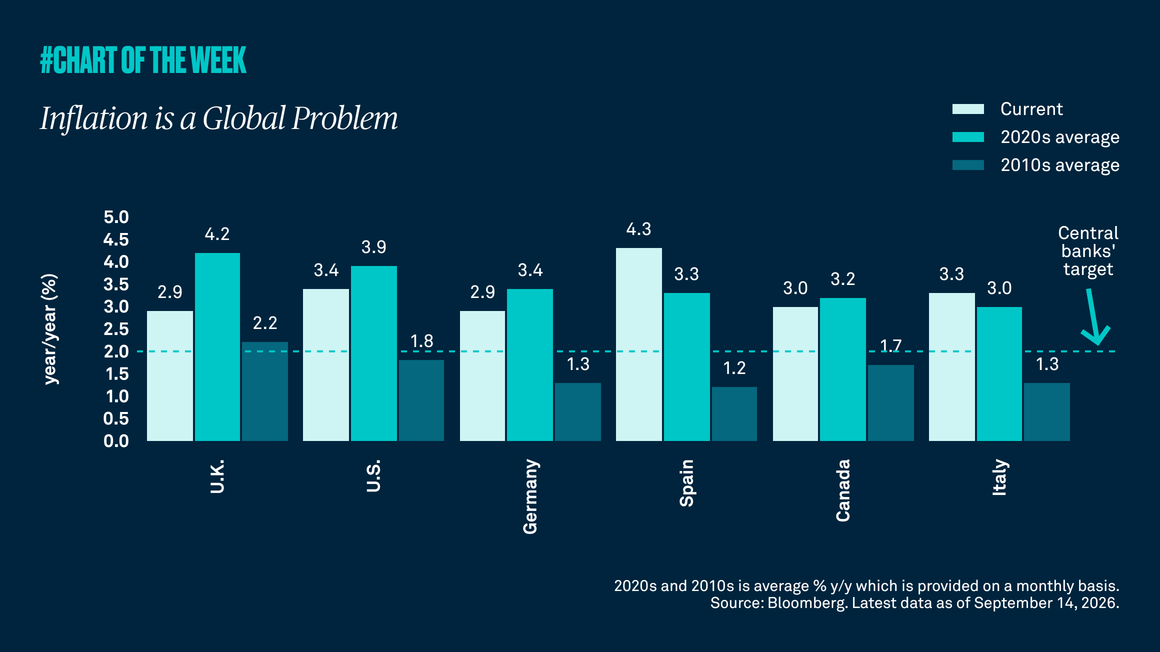
While continued AI capex is likely in the near term, we view a market driven by broader earnings as more sustainable. Volatility could pick up near term given higher inflation and yields along with uncertainty surrounding the new Federal Reserve chair. Still, improving earnings with breadth keep us constructive on the future outlook.