Please ensure Javascript is enabled for purposes of website accessibility Signals from spreads
no
en
intermediary
intermediary
false
true
Gathering data
Disclaimer Not Available

Signals from spreads

Signals from spreads

Credit spreads have risen yet remain historically low, reinforcing our view that the oil shock is likely temporary — not a driver of long-term growth concerns.
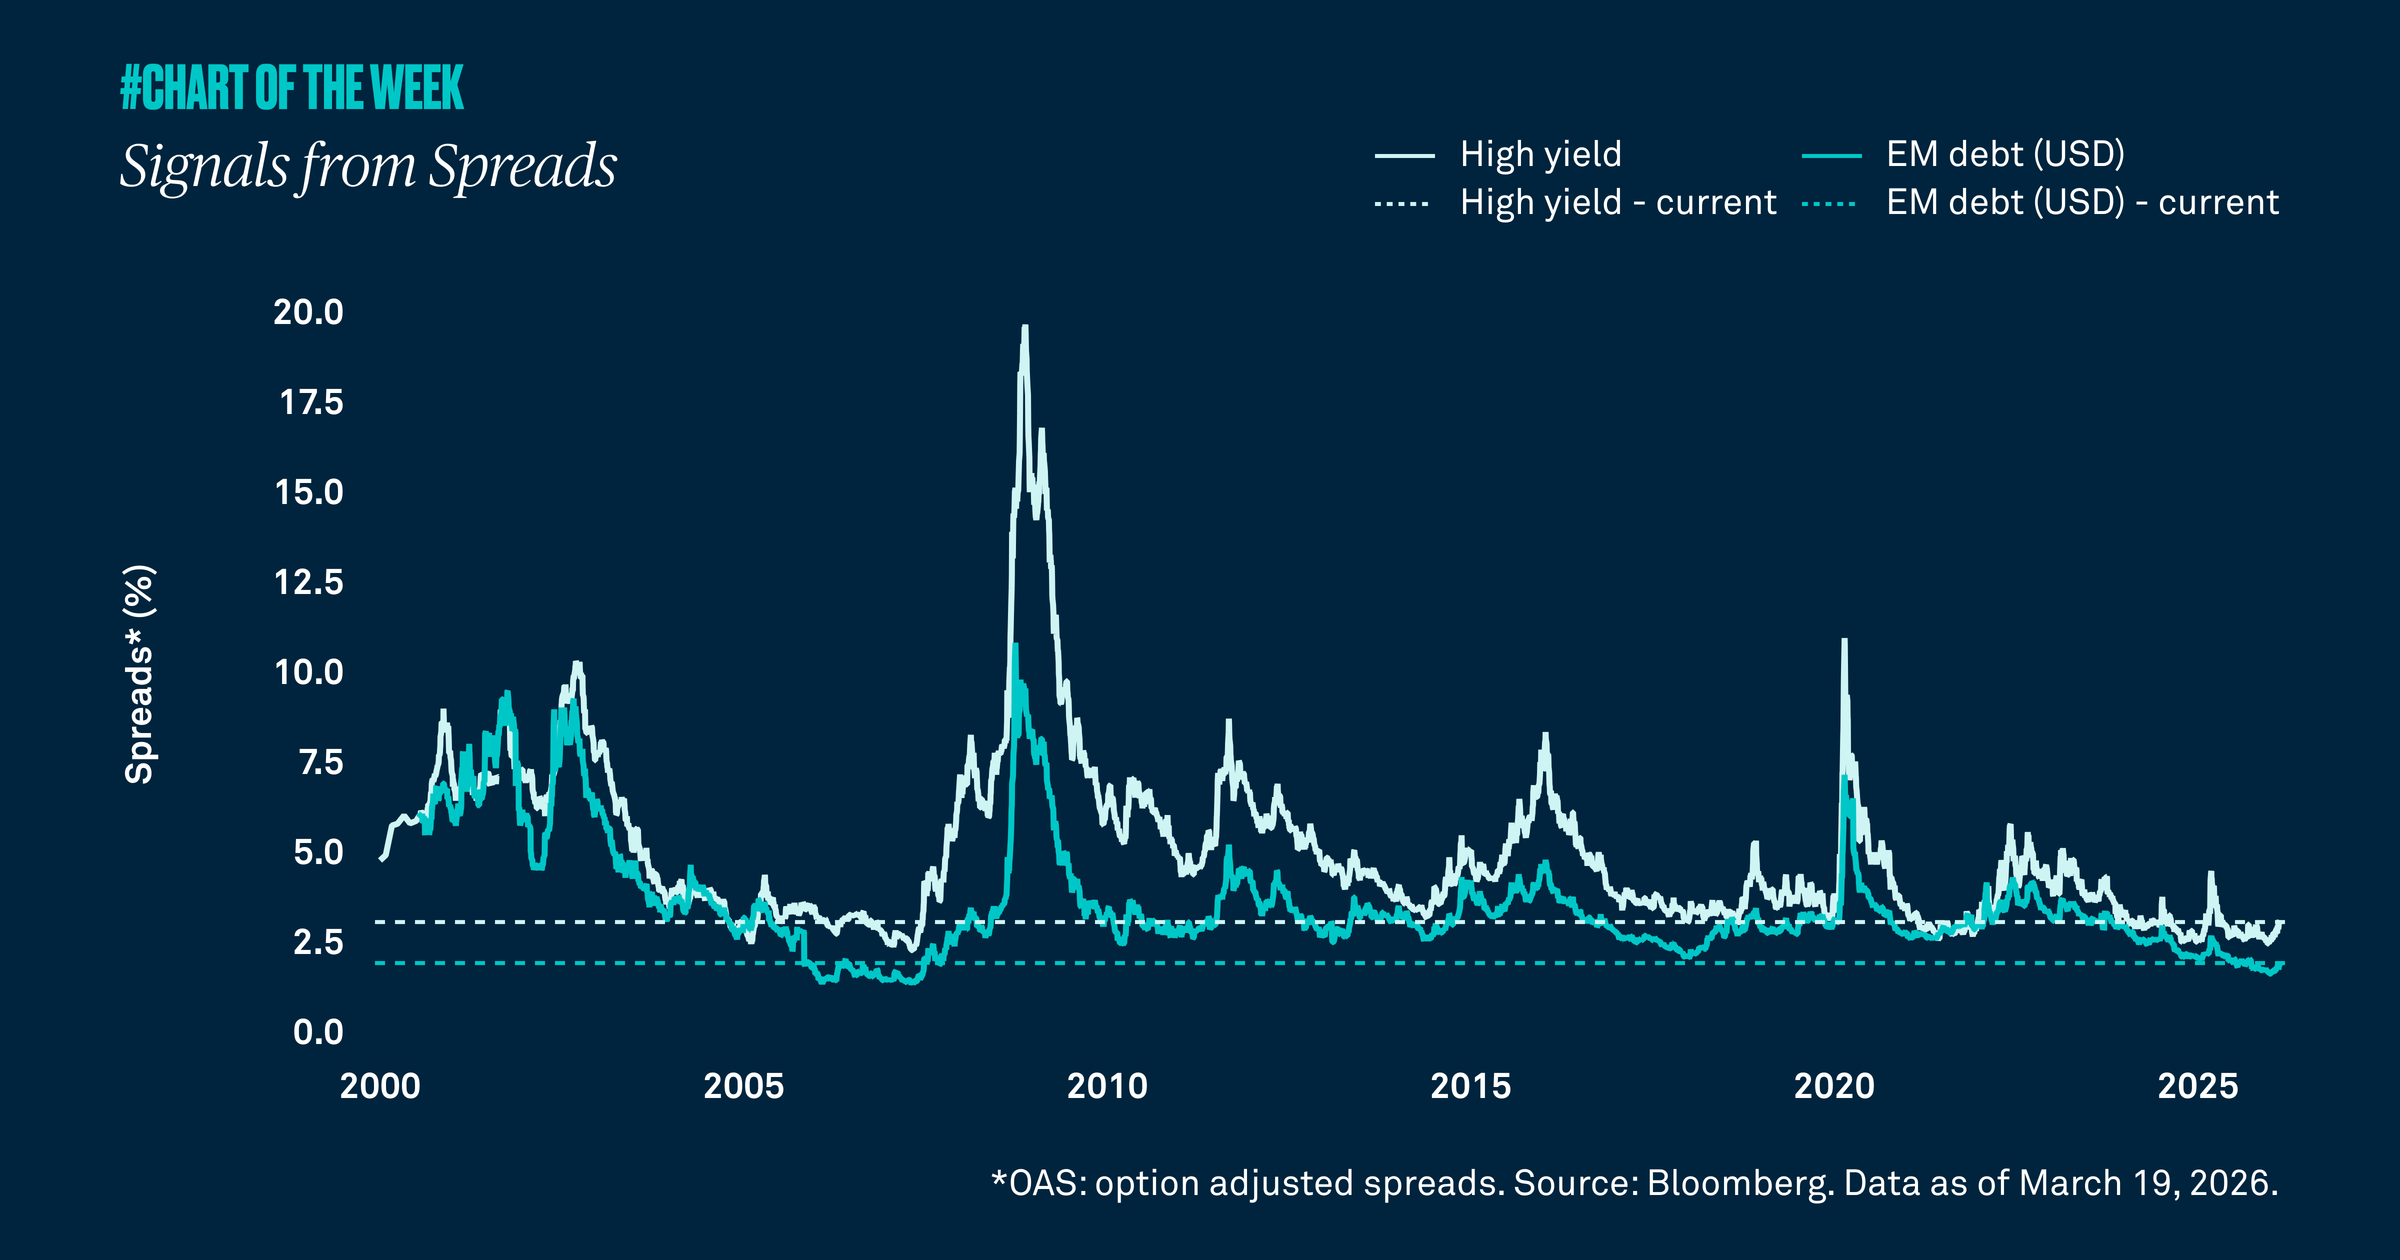

The Middle East conflict continues but key credit spreads remain relatively subdued. Historically, rising credit spreads signal greater risk aversion and concerns about slowing growth. A sustained widening would indicate more persistent growth concerns.

Similar to the equity market, credit spreads suggest the conflict will likely be short-lived. Though U.S. high yield spreads rose 55 basis points (bps) and emerging market debt spreads increased 30 bps in the last two months, these levels are historically low. We agree with the market and believe the oil shock will be temporary. While recent developments from President Trump on potential negotiations could be positive, the situation remains dynamic, and we’ll continue to watch whether credit spreads widen further.
RELATED CONTENT
Fed friction?
Chart of the Week | Macroeconomic

Markets are navigating tensions between a Fed that offers less guidance and an inflation backdrop that remains sticky. Added uncertainty from Middle East tensions and energy-price swings is further shaping sentiment, with recent moves in Treasury yields suggesting the market wants the Fed to hike. However, with yield volatility expected to linger in the near term, we see today’s elevated Treasury yields as an especially compelling opportunity in fixed income.

Sizing up small caps
Chart of the Week | Macroeconomic

Small caps have outperformed this year despite the threat of higher interest rates, suggesting the rally is being driven by more than just diversification away from large cap tech stocks. Improving earnings expectations and a resilient U.S. economy support our view that small caps have further upside from here.

cotw_27_07_2026_580x326
Chart of the Week | Macroeconomic

The war in Iran has increased volatility across fixed income markets, pushing municipal bond yields higher as investors reassess inflation risk, energy costs and the path of Federal Reserve policy. Even so, historically elevated municipal bond yields present a compelling opportunity for tax-sensitive investors.

Signs from Sales
Chart of the Week | Macroeconomic

Year-to-date stock market returns have been driven by robust earnings growth. But when assessing the equity outlook, it’s important to ask what’s supporting the strong earnings trend.

Gathering data
Disclaimer Not Available

This is a marketing communication