Please ensure Javascript is enabled for purposes of website accessibility Is big tech overvalued?
no
en
intermediary
intermediary
false
true
Gathering data
Disclaimer Not Available

Is big tech overvalued?

Is big tech overvalued?

It’s true that the S&P 500 currently exhibits high valuations, with the technology sector alone comprising over 40% of its market capitalization and driving concerns about valuations. Are those high multiples justified?  
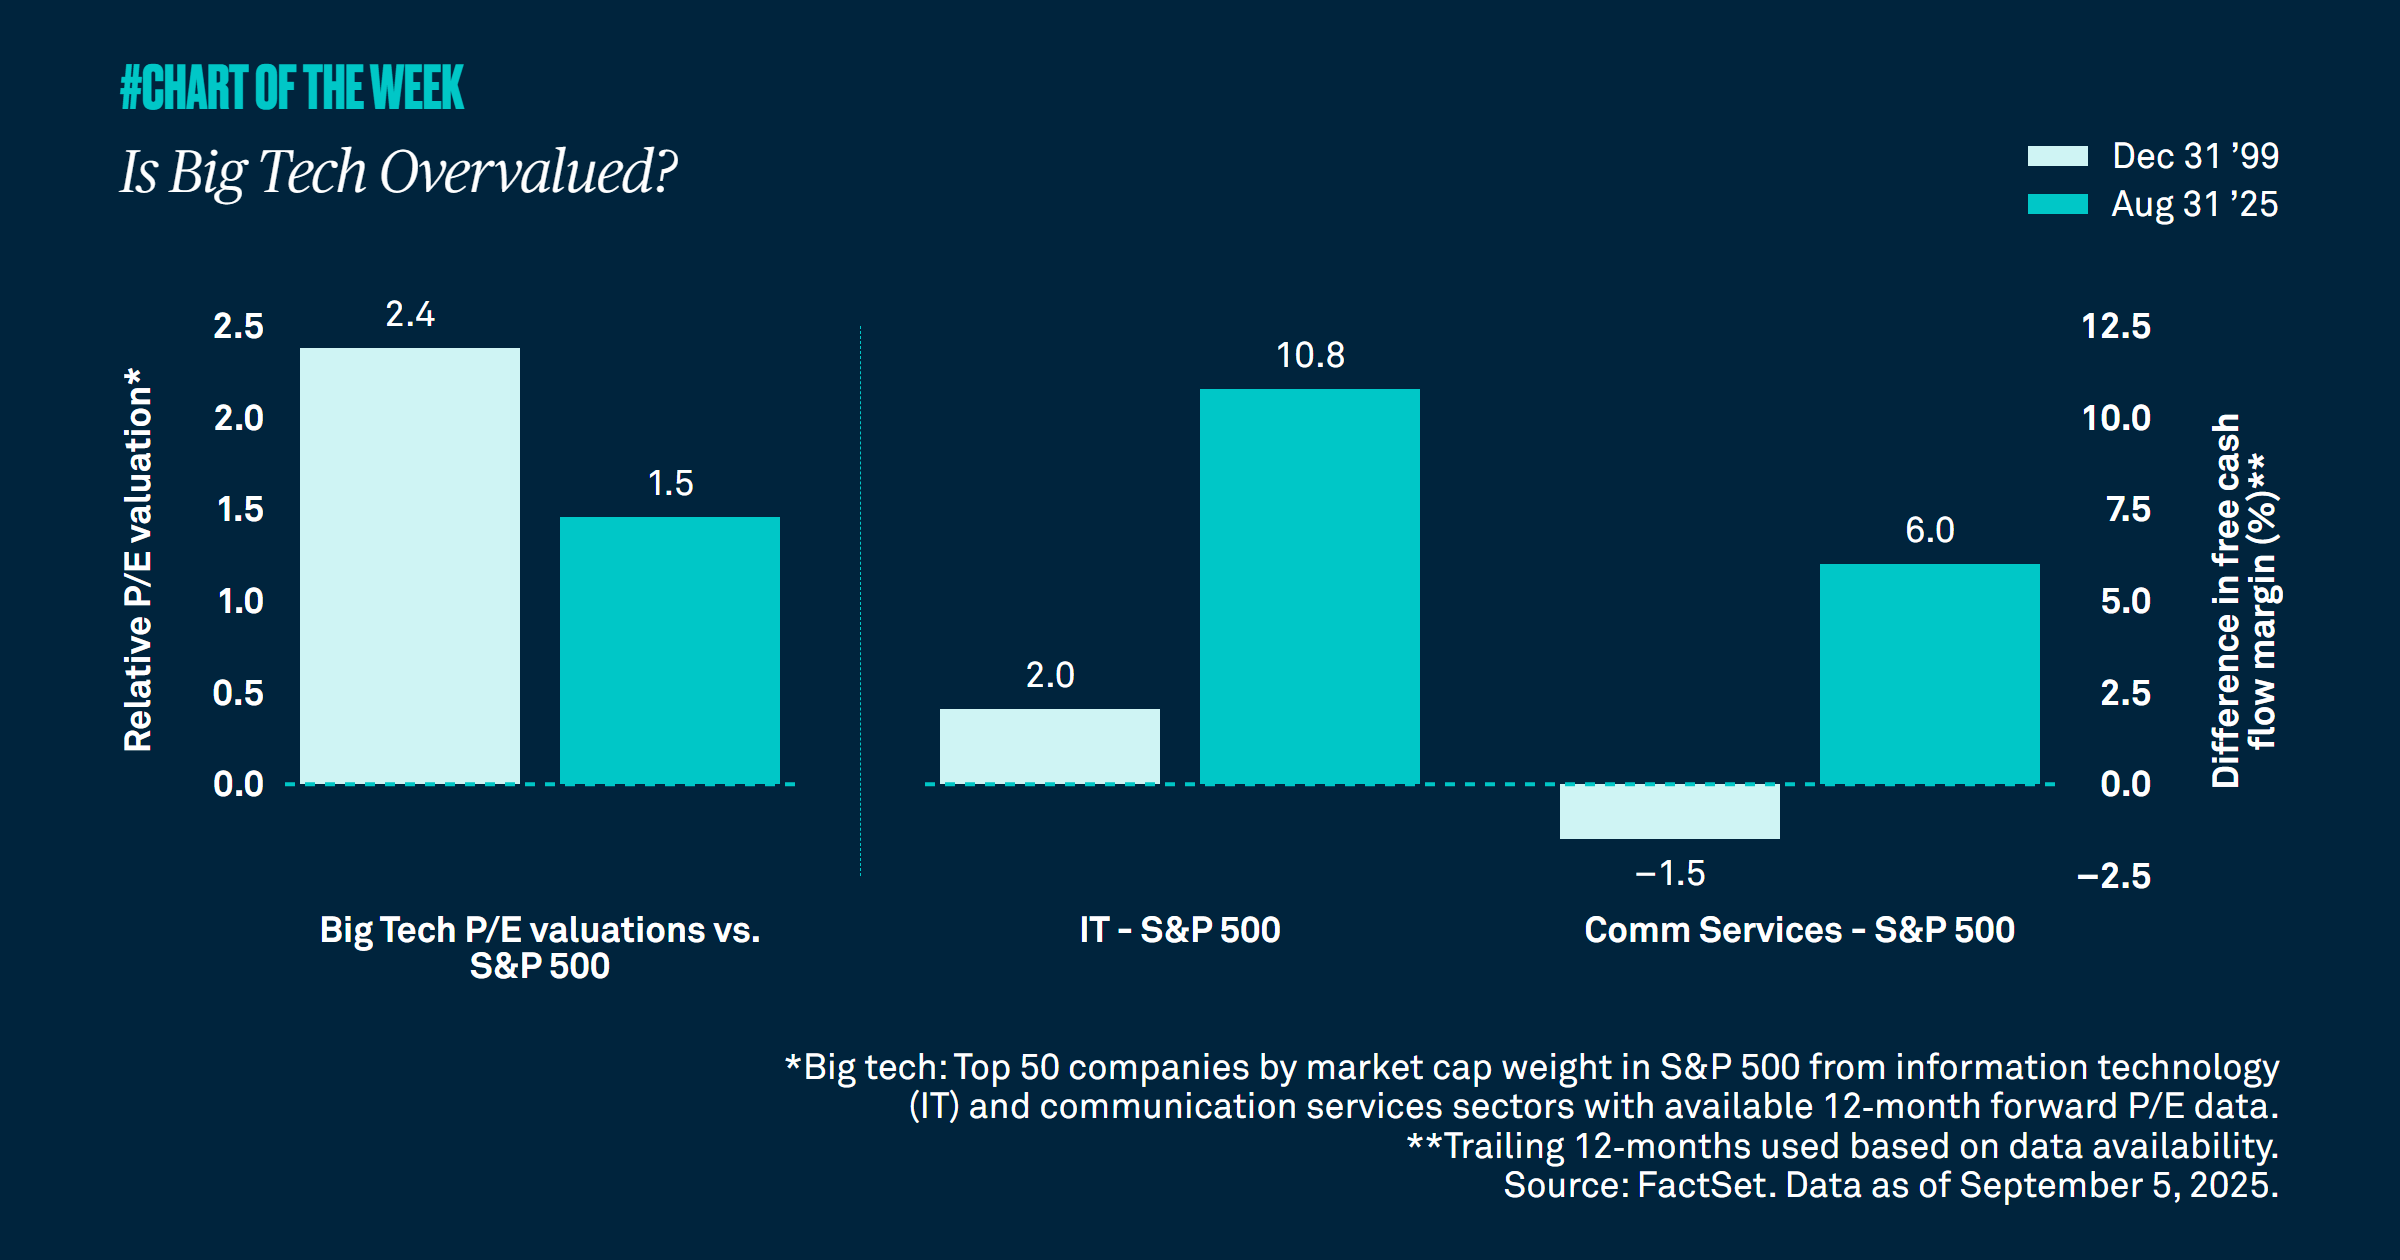

There are concerns among some investors that technology stocks, which account for over 40% of the S&P 500’s market capitalization, are trading at valuations that call to mind the boom and bust of the dot.com era. However, during the dot.com bubble, big tech was 2.4X more expensive than the S&P 500 compared to only 1.5X today.

Another factor to consider is the profitability of the market as measured by free cash flow margins. In 1999, the Information Technology sector’s free cash flow margins were 2% higher than that of the S&P 500. Today that number is as high as 11%. Additionally, margins in Communication Services are 6% greater than that of the broader index compared to -1.5% in 1999.

Lower relative valuations and greater profitability suggest to us that big tech is not overvalued, and these companies justify their price tags. In our view, the late 90s and early 2000s do not, bear a convincing resemblance to today. We remain constructive on equities and U.S. large cap stocks in particular as we continue to anticipate the many ways artificial intelligence, a huge driver of growth in the tech space, can improve profitability for all the S&P 500 sectors.
RELATED CONTENT
Resilience is a historical trend
Chart of the Week | Macroeconomic

The S&P 500’s history shows that despite recessions, wars, inflation, and corrections, the market’s long-term trajectory has remained upward. As the U.S. marks 250 years of resilience, the lesson for investors is clear: wealth is built through patience, discipline and staying invested.

Resilient through uncertainty
Chart of the Week | Macroeconomic

U.S. policy uncertainty has remained elevated and consumer sentiment has weakened. Even so, the economy has stayed resilient, and because growth has held up better than sentiment and headlines suggest, we continue to forecast 2% U.S. growth in 2026, in line with trend.

Getting real in retail
Chart of the Week | Macroeconomic

Despite persistent concerns that sticky inflation would erode purchasing power and drag consumer spending lower, the May retail sales data tells a different story. Spending is up not just in dollar terms, but in quantity, highlighting continued consumer resilience.

Higher inflation, contained expectations
Chart of the Week | Macroeconomic

Inflation has jumped since the Strait of Hormuz closed, squeezing consumers through higher gas and utility bills and pressuring businesses with higher freight and operating costs. Yet, longer-term inflation expectations remain contained, suggesting this looks more like a temporary energy shock than a lasting inflation upswing.

Gathering data
Disclaimer Not Available

This is a marketing communication