AI, resilient trade and a weaker dollar are turning heads towards the countries driving global growth. Emerging economies haven’t looked this promising in years.
Written off and rediscovered, the world’s up-and-coming economies have a long record of bouncing back through cycles. Sure enough, they are back, and the bull run may only just be starting. What is more, today’s backdrop looks more durable than a typical rebound. The IMF says emerging economies have grown faster than advanced economies every year this century. And by the end of 2025, the growth differential widened to 2.6 percentage points – its highest level in a decade. Put simply, when emerging economies grow faster than their developed peers, capital tends to flow into them.
We believe three big structural changes are behind it.
1. Emerging markets are fuelling the AI tech boom
If trade is the backbone of emerging markets, then AI is the topic du jour of this era. Tariffs, trade restrictions and talk of an AI tech bubble may have stirred anxiety among investors, but some Asian markets have quietly positioned themselves at the centre of the AI ecosystem.
Ask people what companies they think of when they hear AI and they will all say the big US tech firms - the so-called Magnificent Seven. But those companies rely on an elaborate network of chip makers, advanced packaging and hardware manufacturers. A network anchored in Asia.
The US tech titans stand to make hefty profits from AI, but so will the hardware manufacturers in countries like South Korea and Taiwan. And it does not stop there because the hardware makers depend on industrial metals and mined minerals like copper, lithium and rare earths – all largely exported from other emerging nations. Chile alone supplies over a quarter of the world’s copper output and the rise in AI data centres is spiking demand.
As AI investment scales, emerging markets that produce energy and critical minerals gain pricing power and volume certainty. That flows into stronger export receipts and better terms of trade. Asian hardware hubs are buying commodities from Latin America, Africa and other parts of Asia, which is growing EM-to-EM trade while cutting reliance on single routes.
So, rather than a cluster of US tech companies, AI is a global super-network of hardware, software, and infrastructure pushing up the price of commodities and positively affecting emerging markets at both macro and micro levels. For commodity exporters, higher prices are strengthening fiscal positions and external balances. Crucially, for the long term, this rally for commodities is not just a by-product of a weaker dollar or improved risk appetite, it is driven by real demand from a transforming global economy.
The Chinese infrastructure boom that dominated emerging markets has been overtaken by demand for energy and AI. We are seeing stronger exchange rates, rising currency reserves and, in some cases, a quicker-than-expected pivot towards dovish monetary policies, which are creating a more supportive environment for corporates. By providing both critical commodity supplies and essential manufacturing hubs, emerging markets could be at the heart of this new technological era for years to come.
2. Trade resilience
Trade in emerging markets is proving resilient, too. Even amid tariffs and trade restrictions, many emerging economies have supported healthy trade volumes. And demand is everywhere. Global AI investment is a boon for Taiwanese semiconductor makers and there is a stronger manufacturing presence in India.
A need for multi-node production is growing the semiconductor and electronics supply chain, while trade routes for energy and metals have shifted towards producers in the emerging markets. High-frequency indicators (real-time data points that help track economic activity) are showing that export orders and customs volumes have stabilised in important trade routes despite westbound shipments wavering.
Countries across the globe are buying energy and metals from emerging markets, while flexible contracts have softened the effect of tariffs and sanctions. Trade volumes are remaining steady, even as westbound shipments wobble. This means emerging markets can export more essential products to more countries, which gives them a stronger hand on pricing. That in turn supports their external balances, which can strengthen local currencies.
3. A weaker US dollar
A strong US dollar has been a chronic headwind for emerging markets. It increases the cost of servicing dollar‑denominated debt, weakens emerging market currencies and erodes investor returns. This has been the case for much of the past 15 years, but since early 2025 the dollar has steadily softened. And when the greenback weakens, the opposite effect tends to take hold. Debt burdens ease, commodity prices rise and the emerging markets’ central banks gain greater monetary policy flexibility.
The US is still the world’s deepest capital market, but its structural advantages are beginning to creak as policy volatility weighs further on the currency. Historically, periods of large US twin deficits have also coincided with weaker dollar policies aimed at correcting those imbalances.
These shifts matter enormously for global capital flows. Even modest reallocations away from pricey US assets toward undervalued emerging markets can generate outsized returns. And capital leaving the US has to settle somewhere, often in higher‑growth emerging market economies.
In 2025, around one‑third of the ~$33 billion invested in US assets by foreign investors originated from emerging markets. Despite this, global investors are still under‑allocated to emerging markets. But a rotation out of US assets, resilient emerging market growth and a softer dollar are starting to reverse the trend.
A weaker US dollar adds more power to this movement. First, it tends to improve global liquidity conditions, as lower hedging costs and reduced dollar funding stress make it easier for emerging market corporates and sovereigns to raise capital. Second, a softer dollar often coincides with stronger global risk appetite, supporting equity and bond inflows into regions with superior growth trajectories. Together, these forces strengthen the three pillars – growth premiums over developed markets, credible policy frameworks, and supportive global financial conditions – which leaves emerging markets primed for further growth.
The case for hard currency corporate bonds
From an active manager’s perspective, the case for hard‑currency corporate bonds in emerging markets has rarely been more compelling.
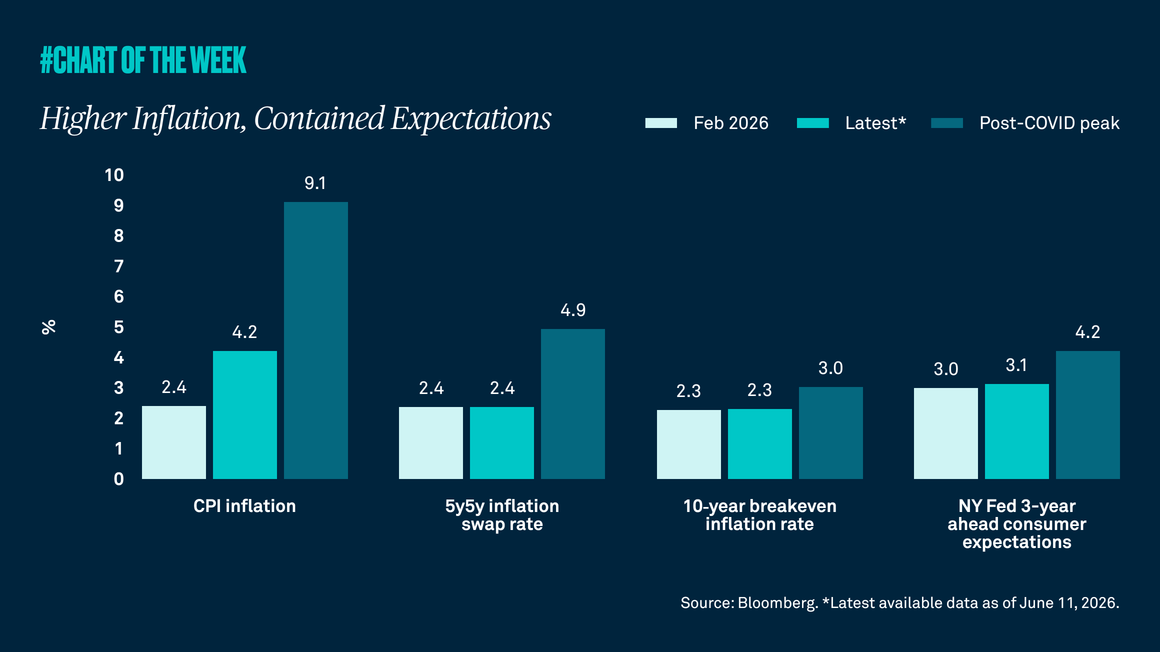
Today’s macroeconomic backdrop – a softening US dollar, moderating global inflation, and steady emerging market growth – aligns with asset‑class‑specific strengths to create a favourable entry point for investors.
Emerging market corporates now represent a diverse and expansive universe, totalling about $2.6 trillion (Figure 1), making it twice the size of both emerging market hard currency sovereigns ($1.8 trillion) and US high yield ($1.4 trillion) – and increasingly comparable to the EUR investment‑grade market ($3.6 trillion).
With exposure across 70 countries and a mix of sectors similar to its developed‑market peers, the breadth of opportunities has soared.
Importantly, a majority of the investor base is now domestic – 53% local emerging market ownership – which tends to be more stable and lower volatility. As a result, emerging market corporates have delivered the highest risk‑adjusted returns versus emerging market sovereigns, local markets, or emerging market equities.
Figure 1: An asset class of significant size and average investment grade rating


Source: JP Morgan as at December 2025.
Strong fundamentals reinforce the case for allocating now.
Emerging market corporate balance sheets remain healthier than many developed‑market businesses. As Figure 2 shows, emerging market investment grade leverage was less than half that of US and European investment grade corporates, while emerging market high yield leverage (2.6×) is still below both US high yield (3.5×) and European high yield (4.7×).
These improvements have converted into a second consecutive year of net credit upgrades and default rates that have normalised to around 3%, on par with developed‑market high yield.
Technicals are equally supportive with net issuance set to remain negative for a fifth straight year in 2026 as amortisations, coupons and buybacks continue to exceed new supply. This has created favourable scarcity at a time when inflows into hard‑currency bond funds are strengthening.
Figure 2: Emerging market corporate fundamentals remain stronger than global counterparts


Source: JP Morgan as at February 2026. Note: excluding 100% quasi-sovereigns, financials, real estate and defaulted companies. 2022 additionally excludes Russian companies. JP Morgan create their own indices to monitor the size of financial instruments based on internal data.
Valuations smooth the investment case, making emerging market corporates especially attractive at the moment.
Adjusted for stronger fundamentals, spreads are still wide relative to global peers, renewing interest from crossover investors seeking yield without materially higher risk. With shrinking supply, fundamentals strengthening and global capital rotating out of expensive US credit markets, emerging market corporates are well placed to outperform. Adding the softer US dollar to this has created an unusual opportunity where cyclical tailwinds and structural improvements come together. As a result, investors are presented with a compelling opportunity, supported by both favourable market cycles and fundamental improvements within the sector. For investors seeking steady income and a balanced risk‑return profile, now could be a perfect time to increase their holdings in emerging market corporates.
Figure 3: Spread compensation relative to risk
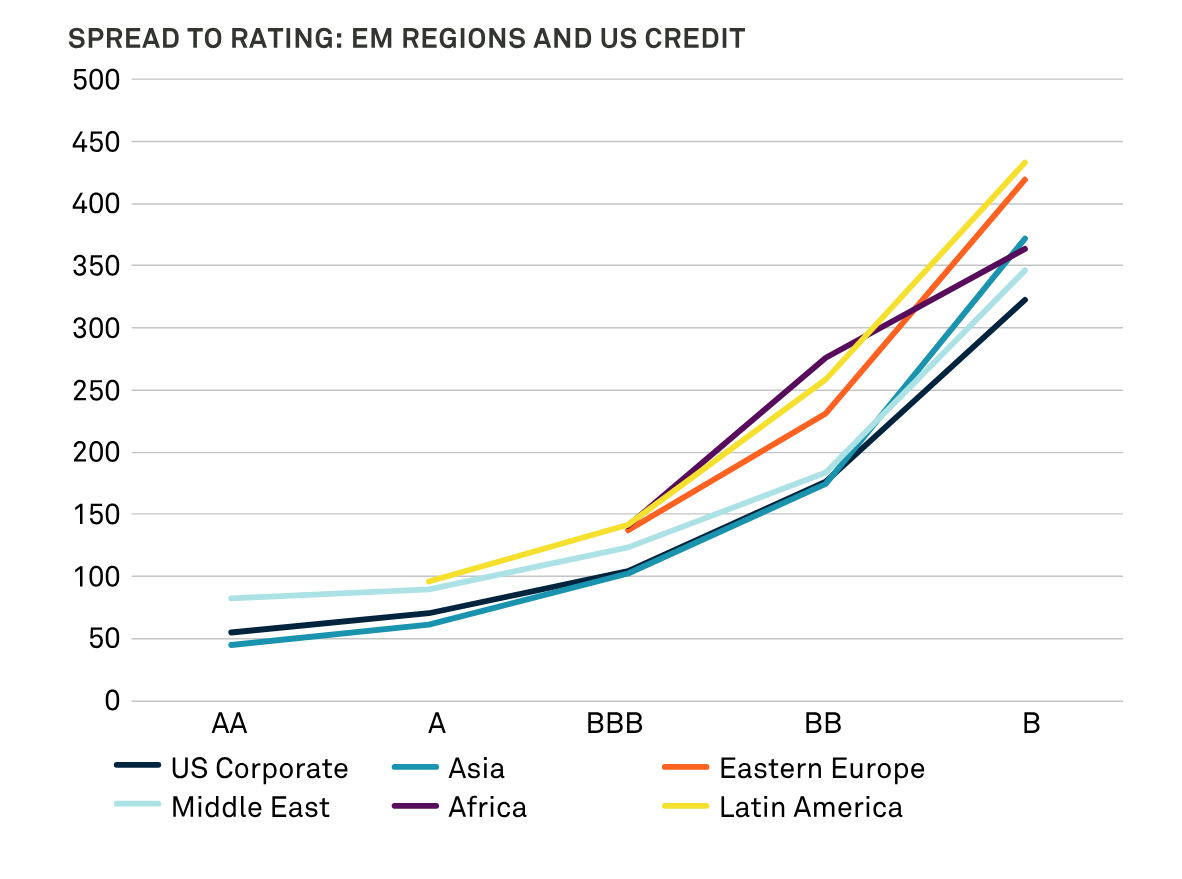
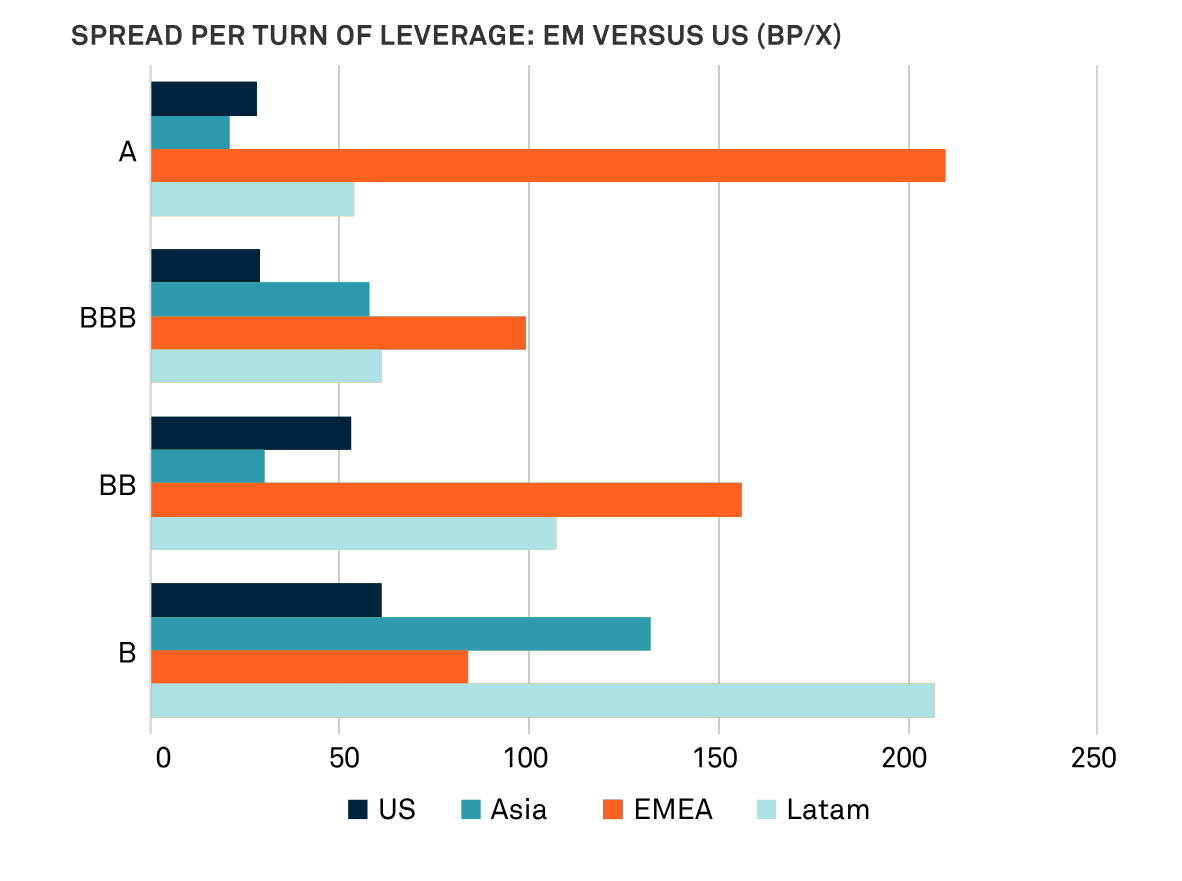
Source: JP Morgan, Insight and Bank of America as at 28 February 2026. JP Morgan and Bank of America create their own to monitor the size of financial instruments based on internal data.
Figure 4: Emerging market corporates have achieved attractive risk-adjusted returns over time
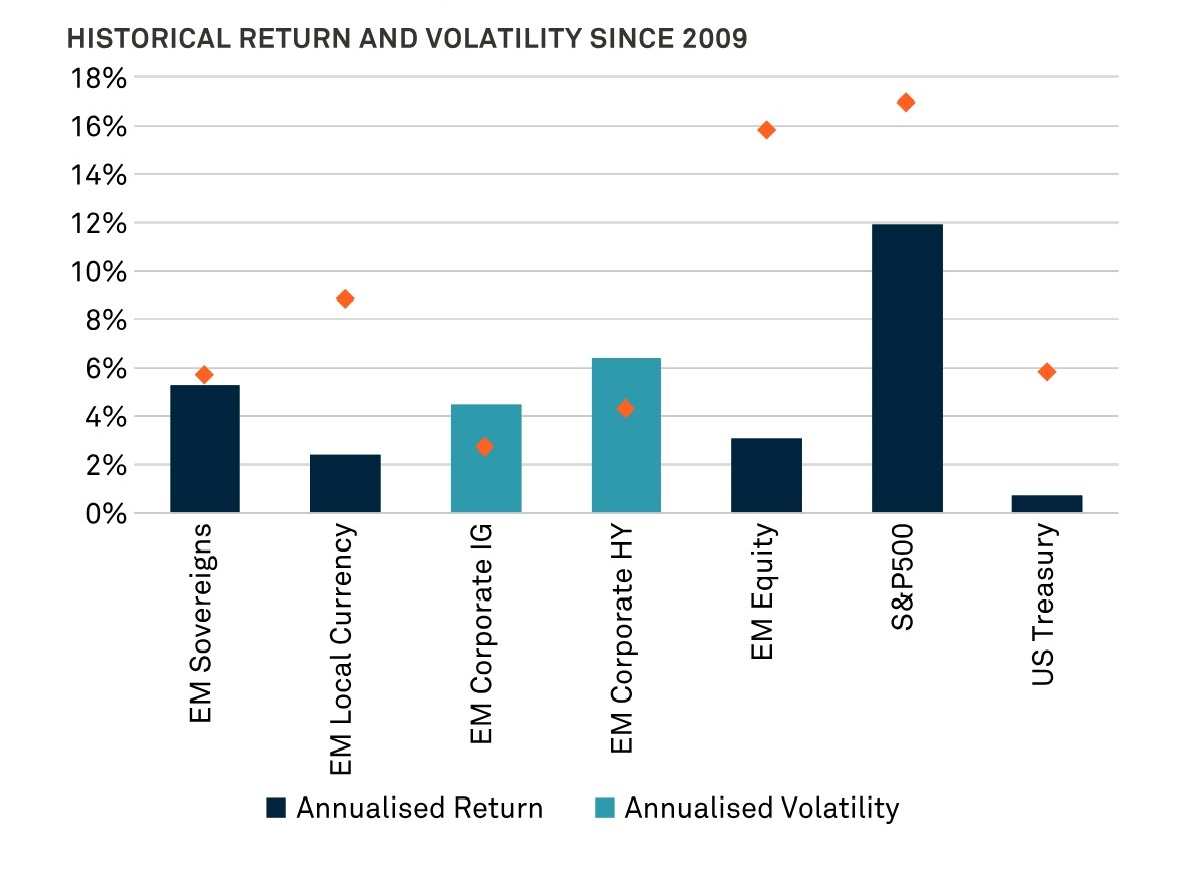
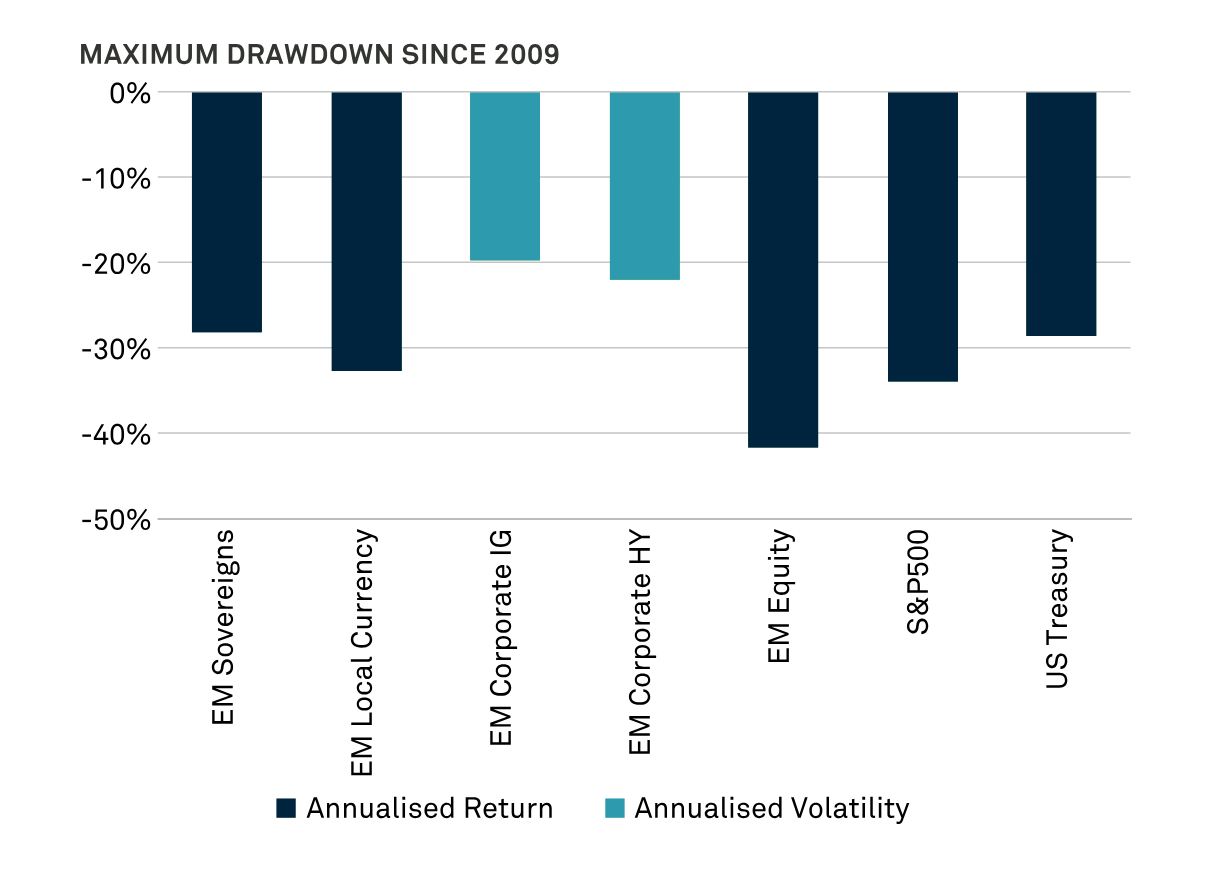
Source: JP Morgan, Bloomberg and Insight as at 28 February 2026. Daily returns since 2009. EM Sovereigns = JPMorgan EMBI Global Diversified Index USD unhedged, EM Local Currency = JPMorgan GBI-EM Global Diversified Index USD unhedged, EM Corporates IG = JPMorgan Corporate Emerging Market Bond Index (CEMBI) Broad Diversified Investment Grade, EM Corporate HY = JPMorgan Corporate Emerging Market Bond Index High Yield, EM Equity = MSCI Emerging Markets Index, S&P500 = S&P 500 Index, US Treasury = Bloomberg Global Aggregate Treasuries Total Return Index USD unhedged.
3181200 Exp: 19 September 2026