Please ensure Javascript is enabled for purposes of website accessibility Narrow Drawdown?
lu
en
intermediary
intermediary
false
true
Gathering data
Disclaimer Not Available

Equity volatility is rising, but all is not what it seems. The technology sector is weighing on the S&P 500 while value and cyclical stocks lead. A market rotation is underway as many investors begin to favor companies beyond tech.
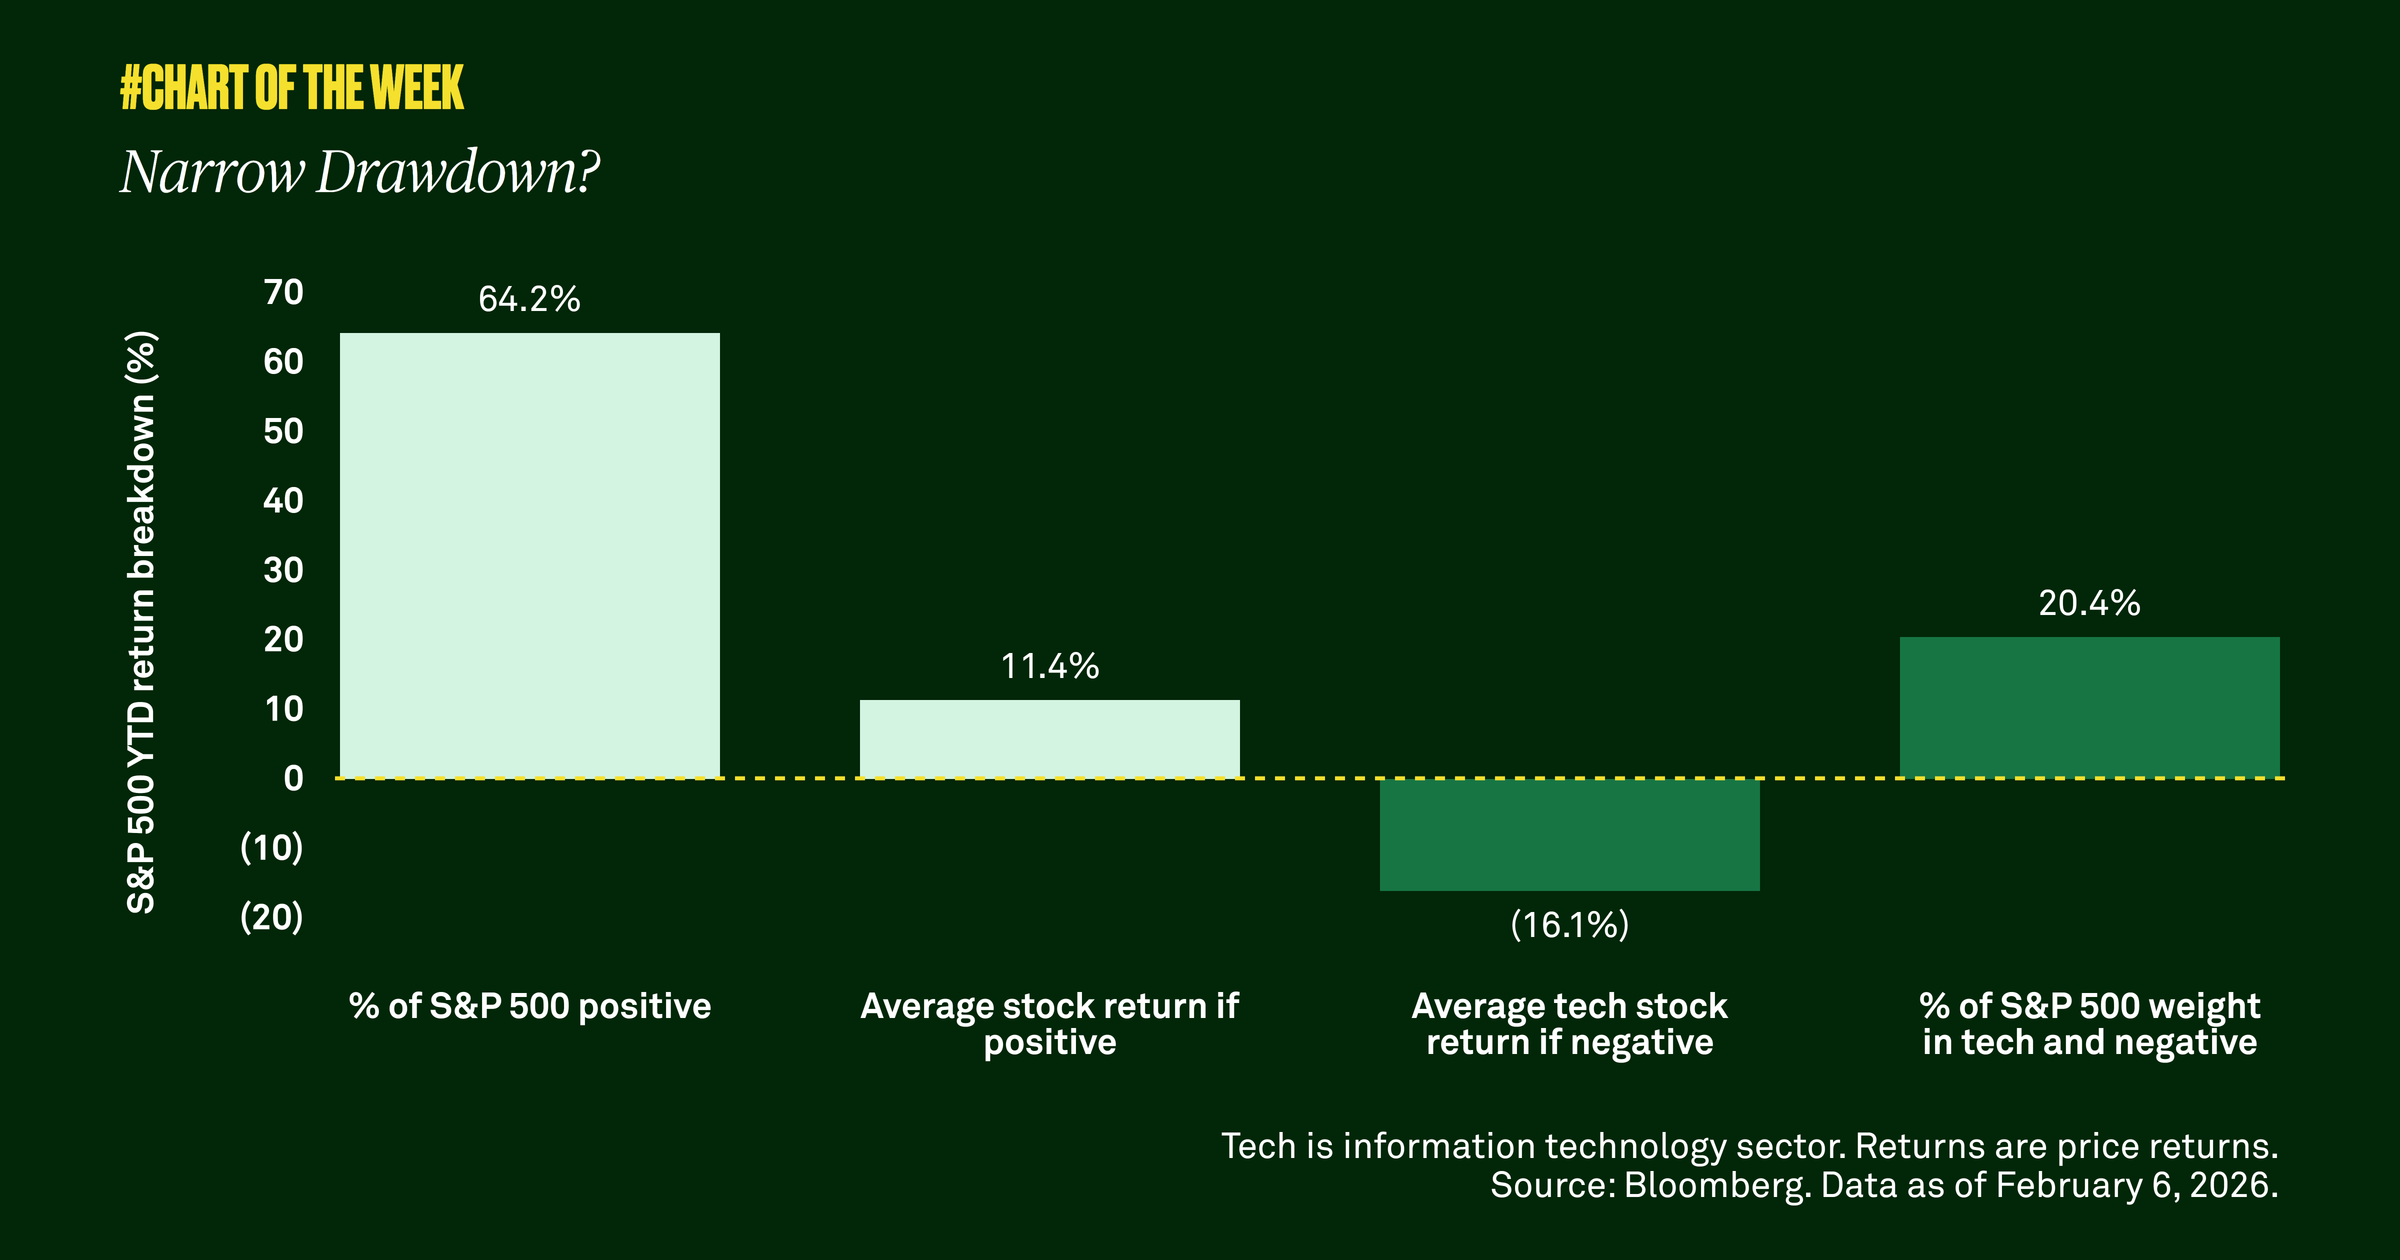

Equity market volatility has heated up since late January, causing some to fear a more pronounced sell-off may be underway. However, we examined recent performance and found that mega cap technology stocks, which once held market leadership, are driving the decline. As an example, last week software stocks were hit hard because artificial intelligence improvements caused investors to reconsider the sector's competitive positioning and long-term value. Among all the negative performers in tech, the average stock is down 16%—and the entire tech sector accounts for more than 20% of the S&P 500’s weight.

It's not all bad news. Outside of tech, S&P 500 stocks are climbing. Sixty-four percent of those stocks are positive year to date, yielding an average return of 11.4% through February 6. The reason is a market rotation is underway— out of big technology stocks and into cyclical areas such as value stocks. In our view, this trend has legs.

Cyclical stocks tend to be more sensitive to fluctuations in the economy, and right now the U.S. economy is resilient. With market participation and earnings growth broadening beyond big tech, we remind clients of the importance of diversification—across market capitalizations, sectors and even geographies.
RELATED CONTENT
In a real regime shift?
Chart of the Week | Macroeconomic

Higher inflation has been a dominant theme of the current decade. In addition to price shocks, it is being shaped by secular investment trends in infrastructure, defense spending, onshoring and the ongoing AI buildout. These structural changes reinforce the case for looking beyond traditional 60/40 portfolios to include real assets as a source of diversification and return potential in portfolios.

Getting real with real assets
Chart of the Week | Macroeconomic

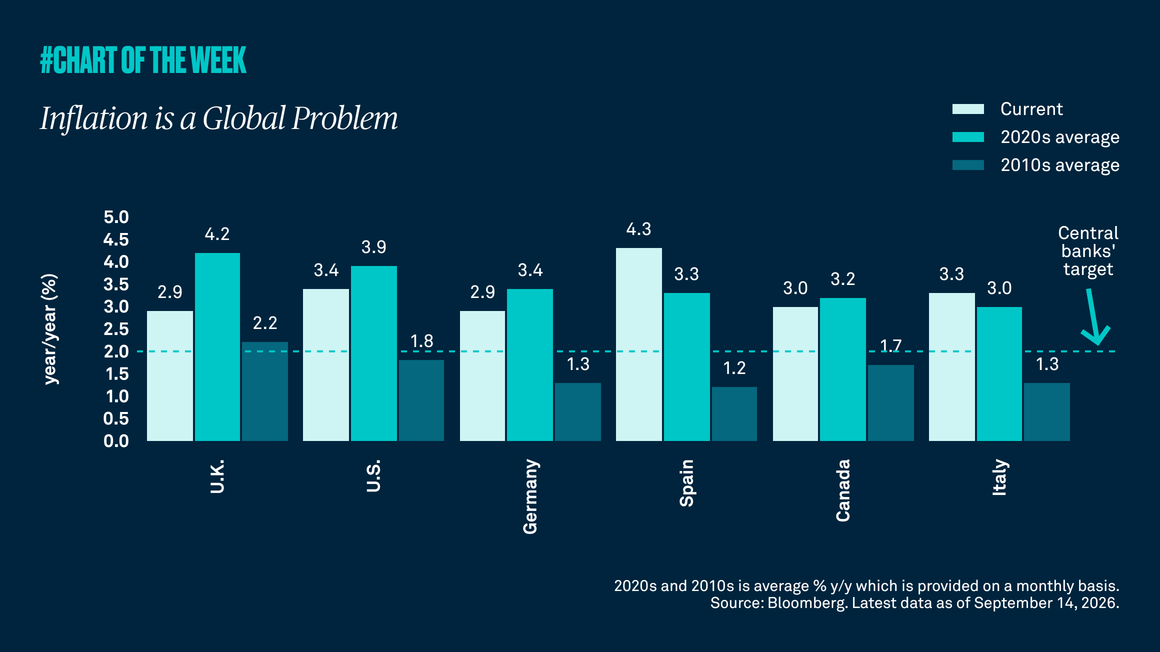
Inflation appears to have transitioned from its pre-Covid average of 2% to a stickier point closer to 3%, and we do not expect a near-term return to prior levels. In this environment, we believe real assets, such as commodities, infrastructure and REITs, can provide inflation protection, diversification and return potential.

Not in a bubble
Chart of the Week | Macroeconomic

As the S&P 500 approaches all-time highs, there are renewed concerns among investors about elevated valuations. However, historically strong profitability and expected earnings growth appear to support current pricing. In addition, the current S&P 500 price-to-earnings (P/E) ratio is roughly equal to the average since Covid. As a result, we do not view U.S. equities as being in bubble territory and we remain constructive on the asset class.

Is the market rally broadening?
Chart of the Week | Macroeconomic

Stocks, as measured by the S&P 500, are up over 13% through early August. The solid gains have been fueled by a resilient economy, steady consumer spending, optimism around artificial intelligence and better-than-expected earnings growth. Still, some investors worry the advance may be too concentrated in technology and that AI-capex monetization may fall short of expectations. A closer look suggests that it is not just tech moving the market higher.

Gathering data
Disclaimer Not Available

This is a marketing communication