Please ensure Javascript is enabled for purposes of website accessibility Healthy Correction?
lu
en
institutional
institutional
false
true
Gathering data
Disclaimer Not Available

Healthy correction?

Healthy correction?

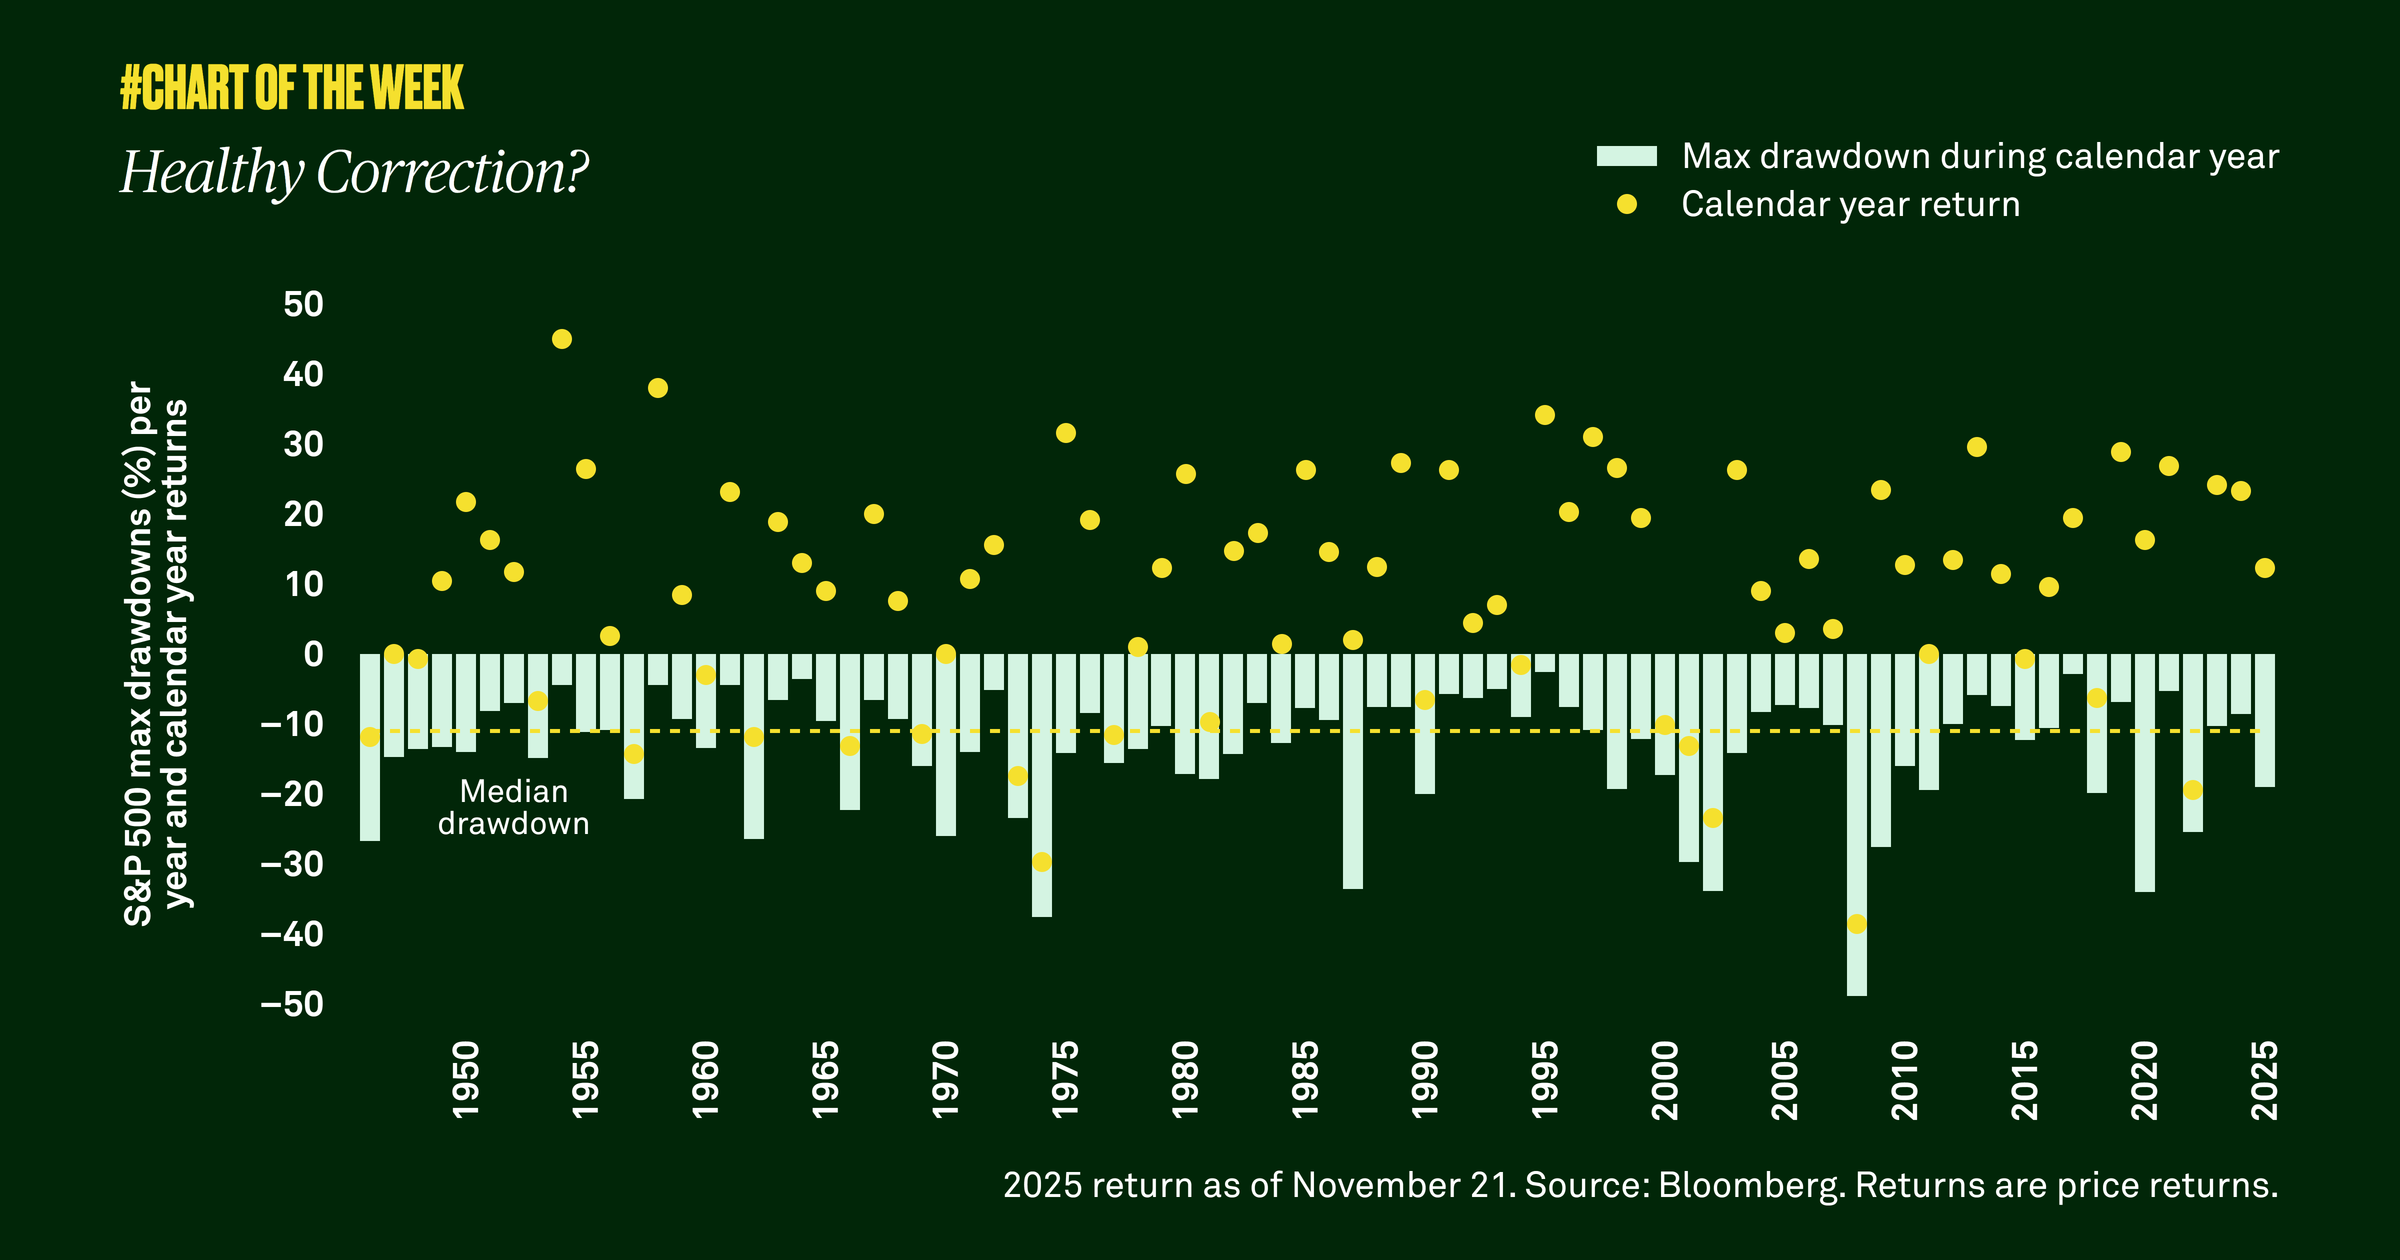
After climbing 17% year to date through late October, the S&P 500 declined 5% through November 20. We believe the market was due for a healthy correction. While further downside is possible, it would not concern us.  


After reaching a new all-time high on October 28, the S&P 500 declined 5% through November 20, leading to concerns of a renewed correction. We believe the market was due for a healthy correction and while further volatility may persist, additional downside would not concern us.

History shows that markets don’t move in a straight line, and drawdowns are normal. Since 1946, the S&P 500 has experienced a median annual correction of 11%.

Additionally, we do not believe we’re heading for a bear market or imminent recession, and we see the latest decline as more technically driven rather than a change in fundamentals or a more negative outlook. In 2026, we expect economic growth near 2% and earnings growth to continue to broaden beyond the tech sector, which should support equity performance. Therefore, staying invested and weathering the downside is critical for capturing potential upside. 

RELATED CONTENT
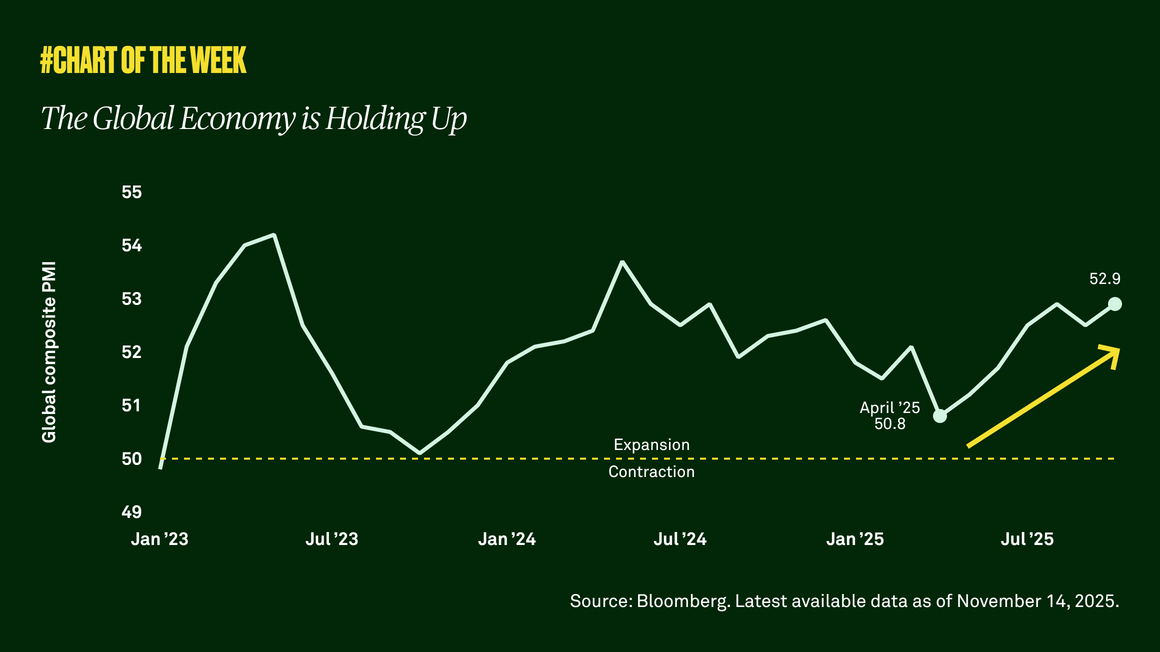
The global economy is holding up
Chart of the week | Macroeconomic

This past year was rife with risks to the global economy: policy changes, tariff uncertainty and more. Yet, the global economy held up as manufacturing and services activity strengthened across the world. We see an opportunity for U.S. investors to diversify geographically.

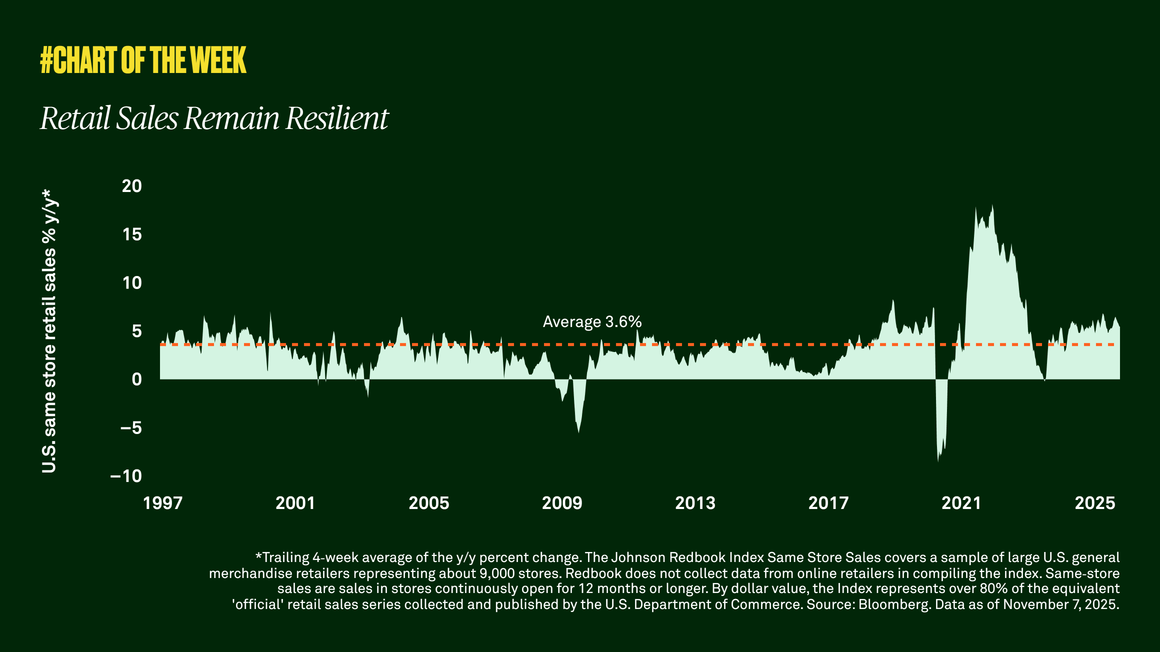
Retail sales remain resilient
Chart of the week | Macroeconomic

Considering the slowing job market, we dove into retail sales data to search for signs of the direction of household spending. We analyzed existing-store sales and found that, despite the softening labor market and concerns about growth, aggregate consumer spending remains resilient.

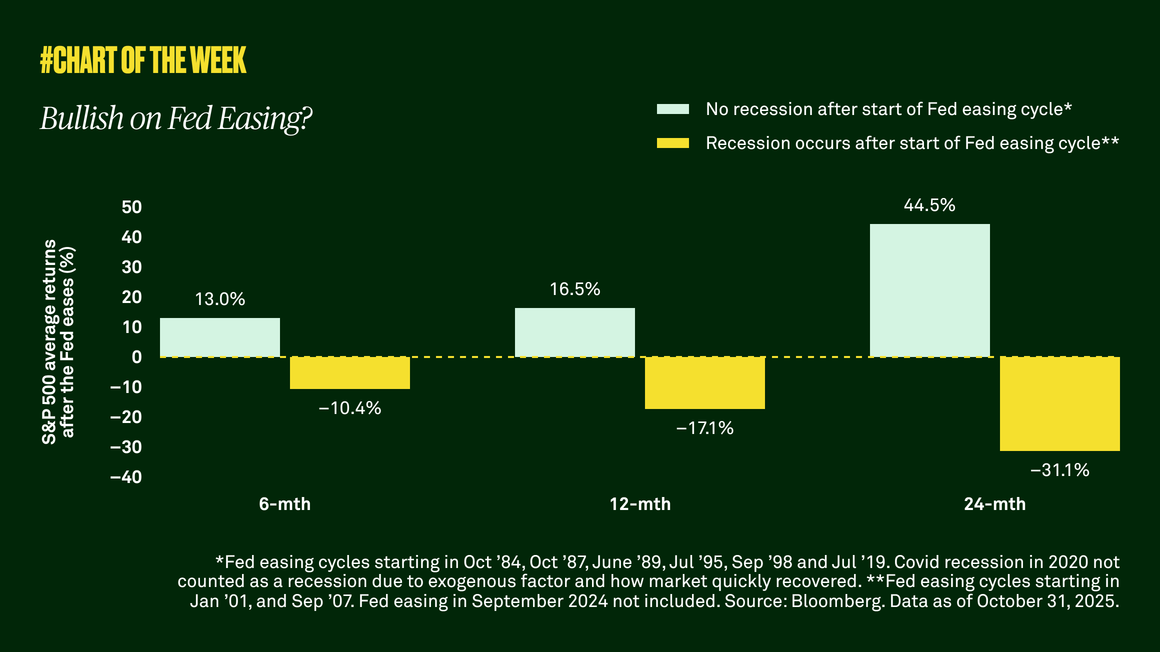
Bullish on Fed easing?
Chart of the week | Macroeconomic

As expected, the Federal Open Market Committee delivered another 25-basis point rate cut. Investors are now focused on the pace of cuts from here. However, the more important driver of future equity returns is whether the Fed is easing into an economy that is growing or not.

Good news on inflation?
Chart of the week | Macroeconomic

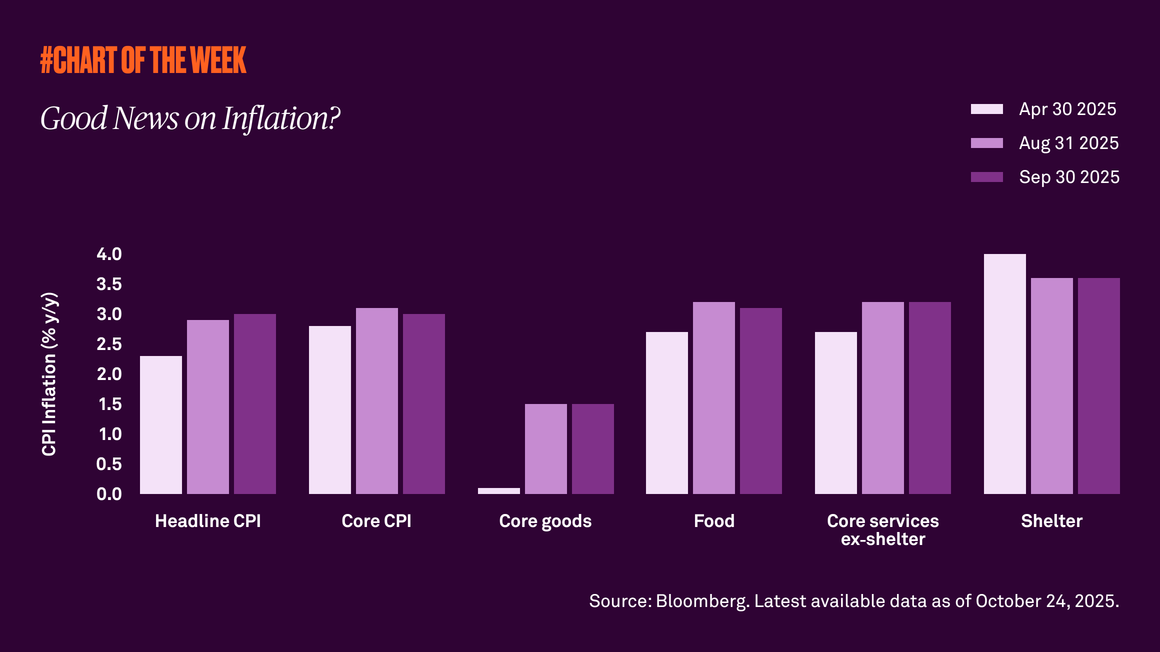
Last week’s Consumer Price Index report, a widely used indicator of inflation in the U.S. economy, showed growth of 3% in September, which was above 2.9% in August but less than expected. Despite the modest increase, various categories have shown signs of stabilization. What does this mean for inflation going forward?

Gathering data
Disclaimer Not Available

This is a marketing communication