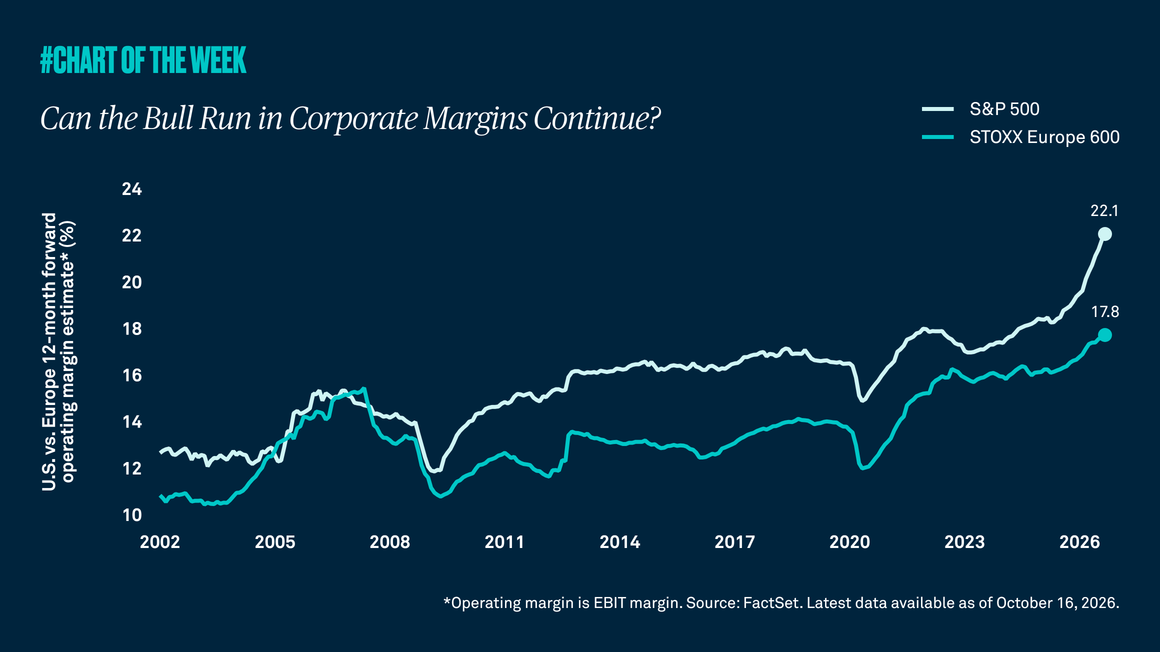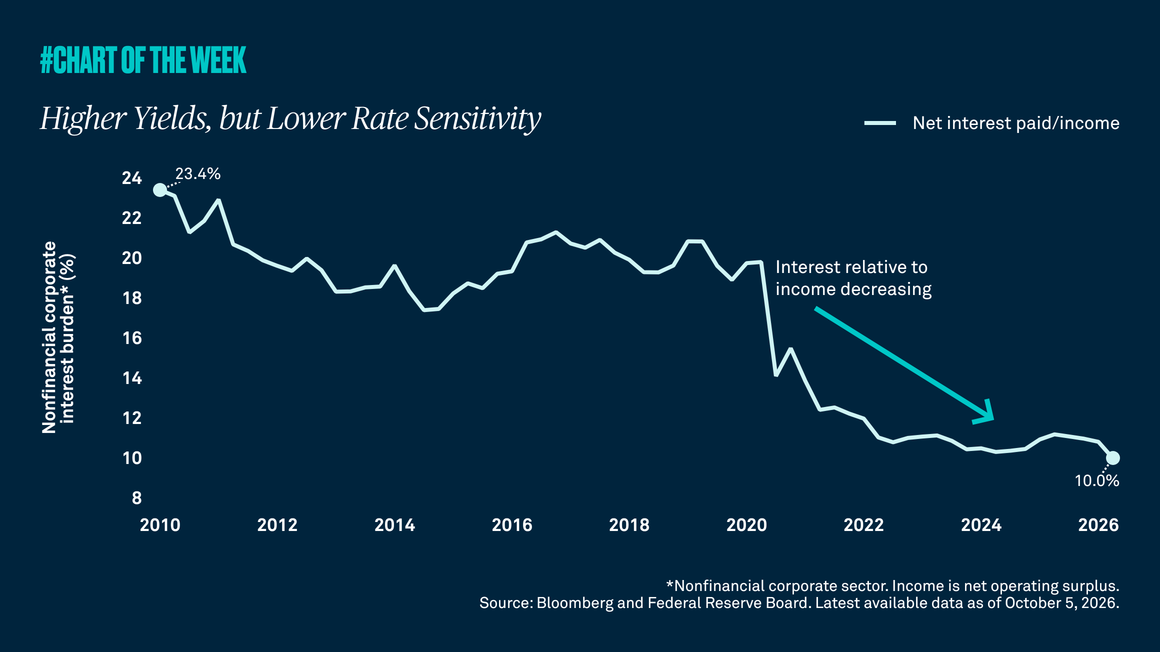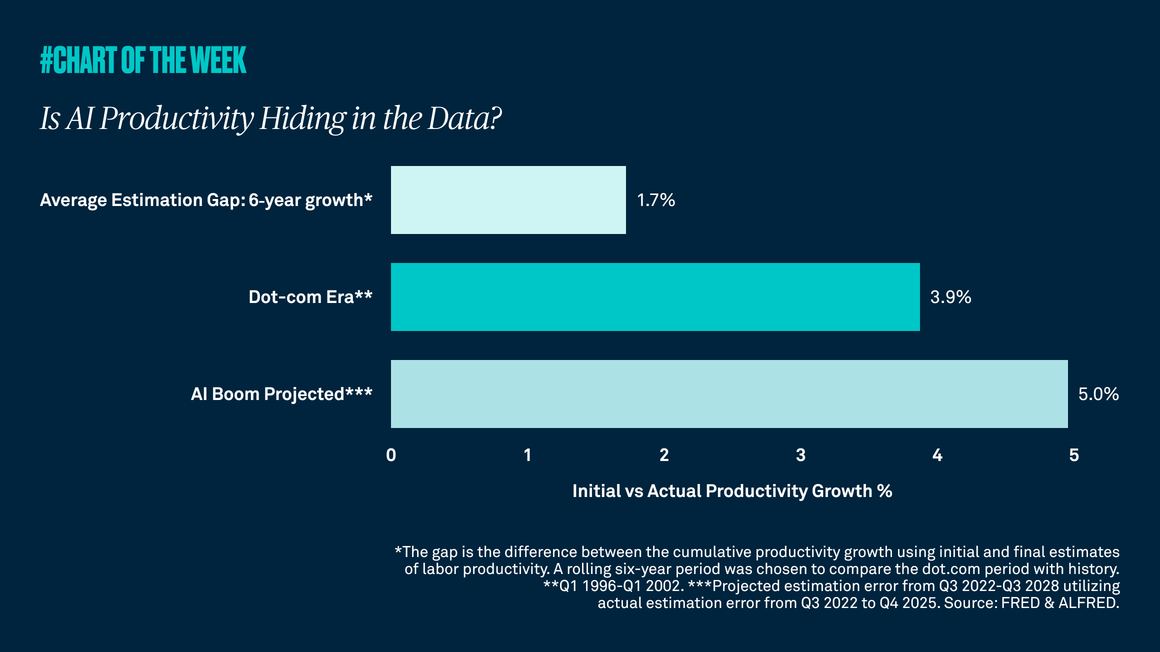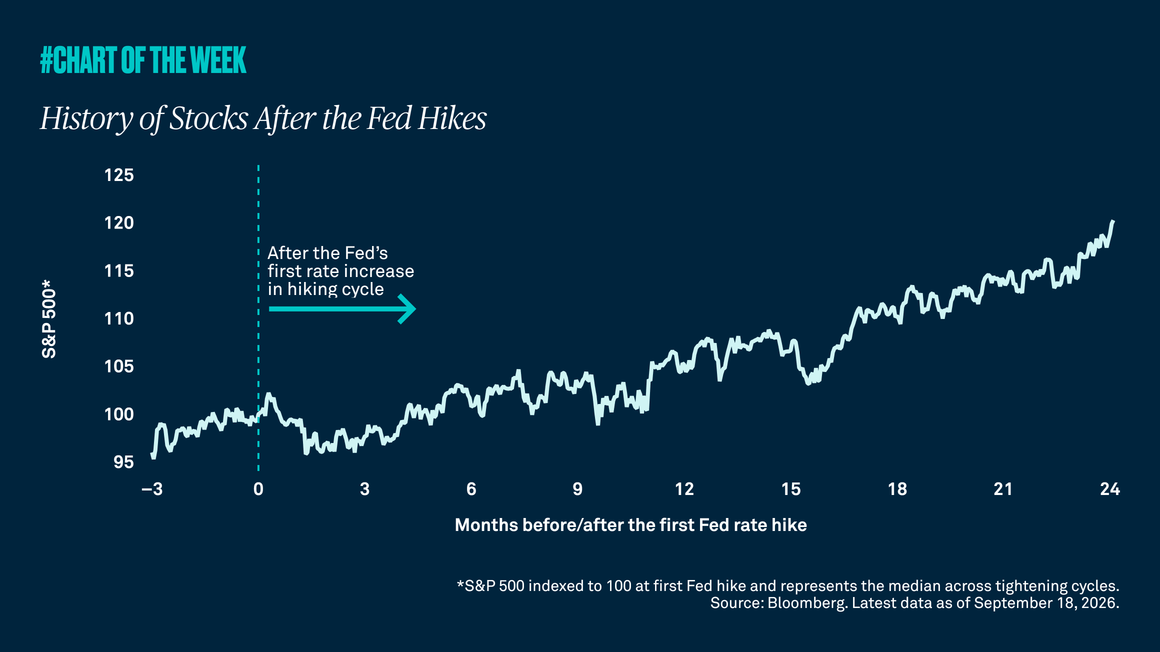
Small caps have outperformed this year despite the threat of higher interest rates, suggesting the rally is being driven by more than just diversification away from large cap tech stocks. Improving earnings expectations and a resilient U.S. economy support our view that small caps have further upside from here.
Despite the risk that war-driven energy inflation could keep interest rates higher for longer — or cause the Federal Reserve to tighten monetary policy — small cap stocks have been among the best-performing asset classes year to date. That is especially notable because small caps are typically one of the most interest-rate-sensitive areas of the market.
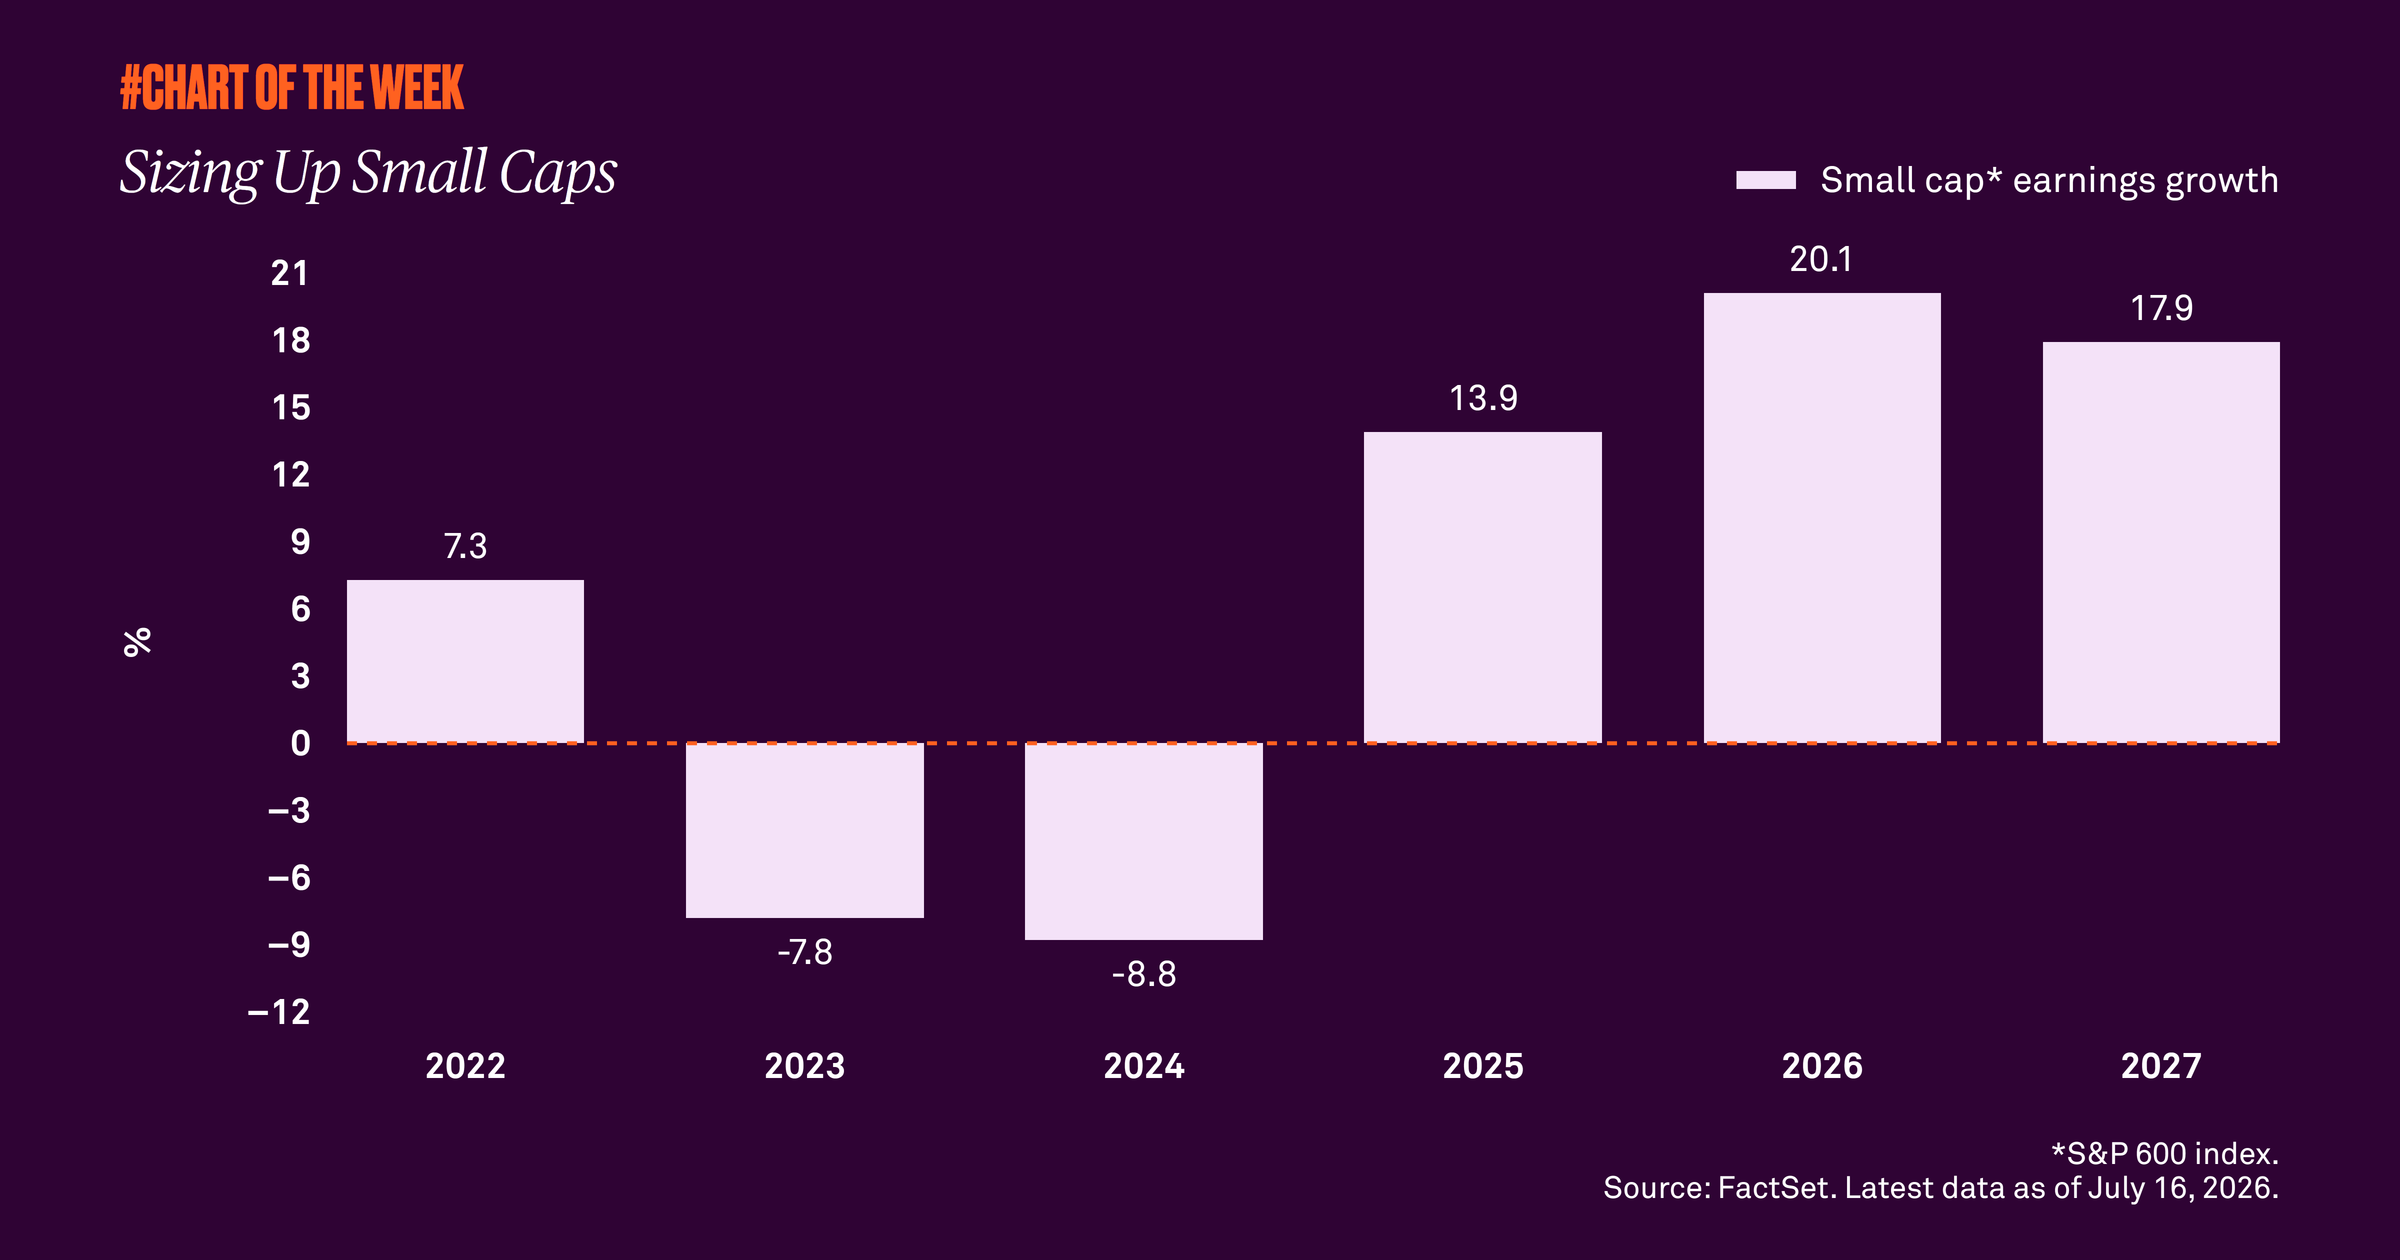
While some investors are using small caps to diversify beyond crowded large cap tech leadership, the fundamentals also appear to justify the rally. After a period of negative earnings growth in 2023 and 2024, small cap earnings growth recovered to 14% in 2025 and is expected to accelerate to 20% this year and 18% next year. That trajectory demonstrates a meaningful rebound in profit growth and supports the case for higher valuations. Small caps also continue to benefit from a resilient U.S. economy because of their more domestic orientation.
We therefore believe small caps have further upside from current levels. While rate volatility remains a risk, improving earnings and a broadening market backdrop should continue to support the group. As a result, we advise clients to consider adding exposure to small cap companies within a globally diversified equity allocation.