Please ensure Javascript is enabled for purposes of website accessibility Is the market rally broadening?
hk
en
institutional
institutional
false
true
Gathering data
Disclaimer Not Available

Is the market rally broadening?

Is the market rally broadening?

Stocks, as measured by the S&P 500, are up over 13% through early August. The solid gains have been fueled by a resilient economy, steady consumer spending, optimism around artificial intelligence and better-than-expected earnings growth. Still, some investors worry the advance may be too concentrated in technology and that AI-capex monetization may fall short of expectations. A closer look suggests that it is not just tech moving the market higher. 
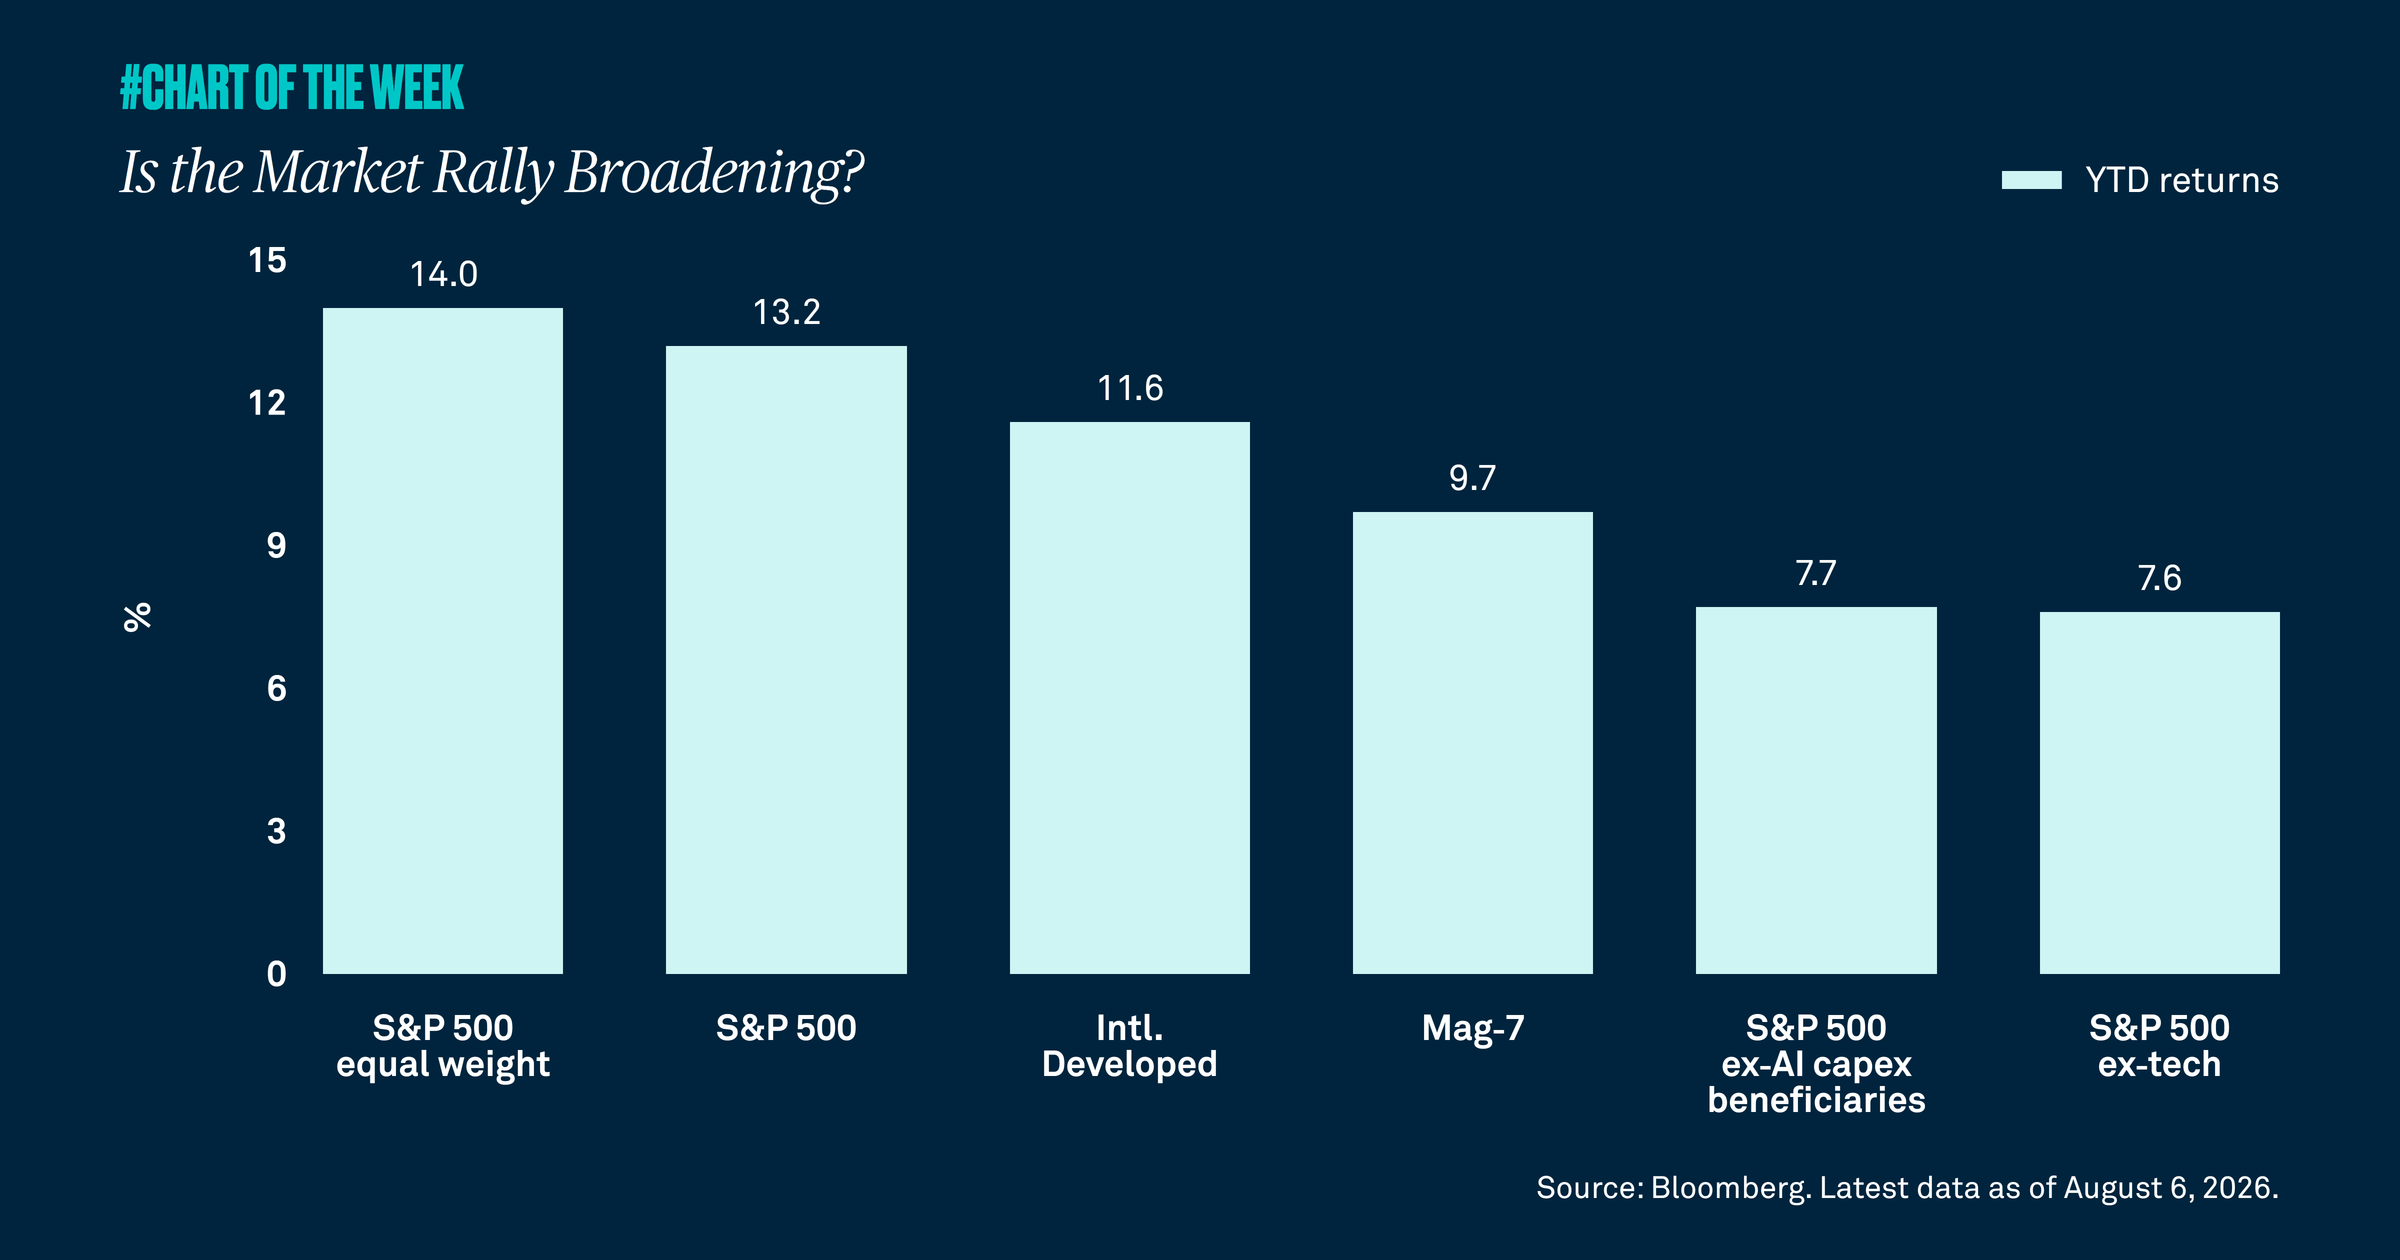

With technology companies on track to deliver a roughly 50% earnings growth rate in 2026, it is not surprising that the sector has remained a major driver of market performance. However, market gains are not solely reliant on technology and AI-linked names. Excluding these, the S&P 500 is still posting solid gains of 8% year to date, which is a healthy sign and indicative of broader market strength. 

A key measure of market breadth is the comparison between the market-cap weighted S&P 500 to the equal-weighted S&P 500.  It may surprise some investors to learn that the equal-weighted S&P 500 index is modestly outperforming the S&P 500 so far this year, with a gain of 14% versus 13.2% through early August. This suggests sectors beyond technology and AI capex are contributing to moving the market higher.

Another way to evaluate whether the market is broadening is to look at how many stocks are trading above their recent trend. Currently, about 72% of S&P 500 companies are trading above their 200-day moving average. That is the highest level since December 2024.

Collectively, these measures suggest that breadth is improving – a constructive sign for the forward outlook.
RELATED CONTENT
In a real regime shift?
Chart of the Week | Macroeconomic

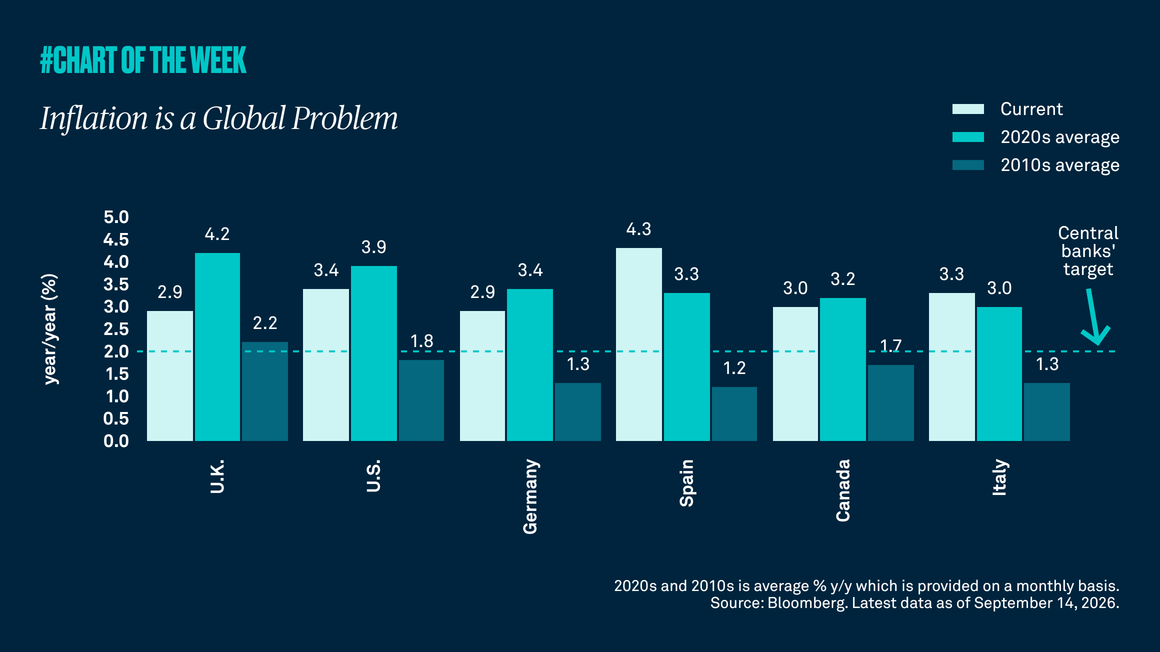
Higher inflation has been a dominant theme of the current decade. In addition to price shocks, it is being shaped by secular investment trends in infrastructure, defense spending, onshoring and the ongoing AI buildout. These structural changes reinforce the case for looking beyond traditional 60/40 portfolios to include real assets as a source of diversification and return potential in portfolios.

Getting real with real assets
Chart of the Week | Macroeconomic

Inflation appears to have transitioned from its pre-Covid average of 2% to a stickier point closer to 3%, and we do not expect a near-term return to prior levels. In this environment, we believe real assets, such as commodities, infrastructure and REITs, can provide inflation protection, diversification and return potential.

Fed friction?
Chart of the Week | Macroeconomic

Markets are navigating tensions between a Fed that offers less guidance and an inflation backdrop that remains sticky. Added uncertainty from Middle East tensions and energy-price swings is further shaping sentiment, with recent moves in Treasury yields suggesting the market wants the Fed to hike. However, with yield volatility expected to linger in the near term, we see today’s elevated Treasury yields as an especially compelling opportunity in fixed income.

cotw_27_07_2026
Chart of the Week | Macroeconomic

The war in Iran has increased volatility across fixed income markets, pushing municipal bond yields higher as investors reassess inflation risk, energy costs and the path of Federal Reserve policy. Even so, historically elevated municipal bond yields present a compelling opportunity for tax-sensitive investors.

Gathering data
Disclaimer Not Available

CONTACT US  |  +852 3926 0600