Please ensure Javascript is enabled for purposes of website accessibility Healthy Correction?
hk
en
institutional
institutional
false
true
Gathering data
Disclaimer Not Available

After climbing 17% year to date through late October, the S&P 500 declined 5% through November 20. We believe the market was due for a healthy correction. While further downside is possible, it would not concern us.  


After reaching a new all-time high on October 28, the S&P 500 declined 5% through November 20, leading to concerns of a renewed correction. We believe the market was due for a healthy correction and while further volatility may persist, additional downside would not concern us.

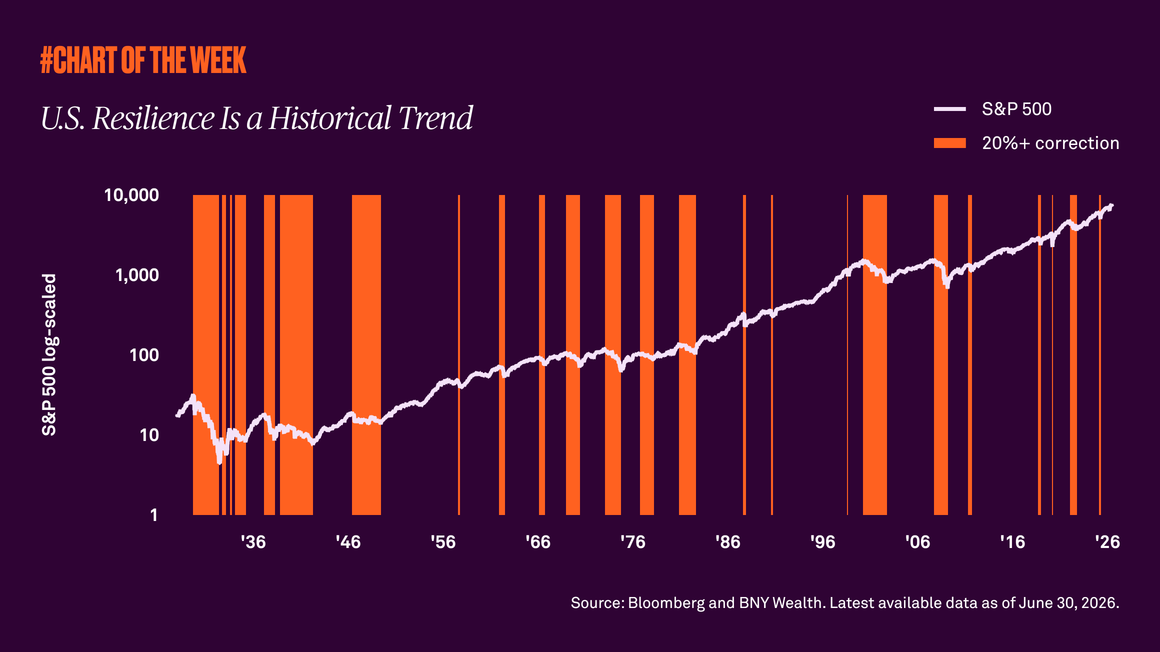
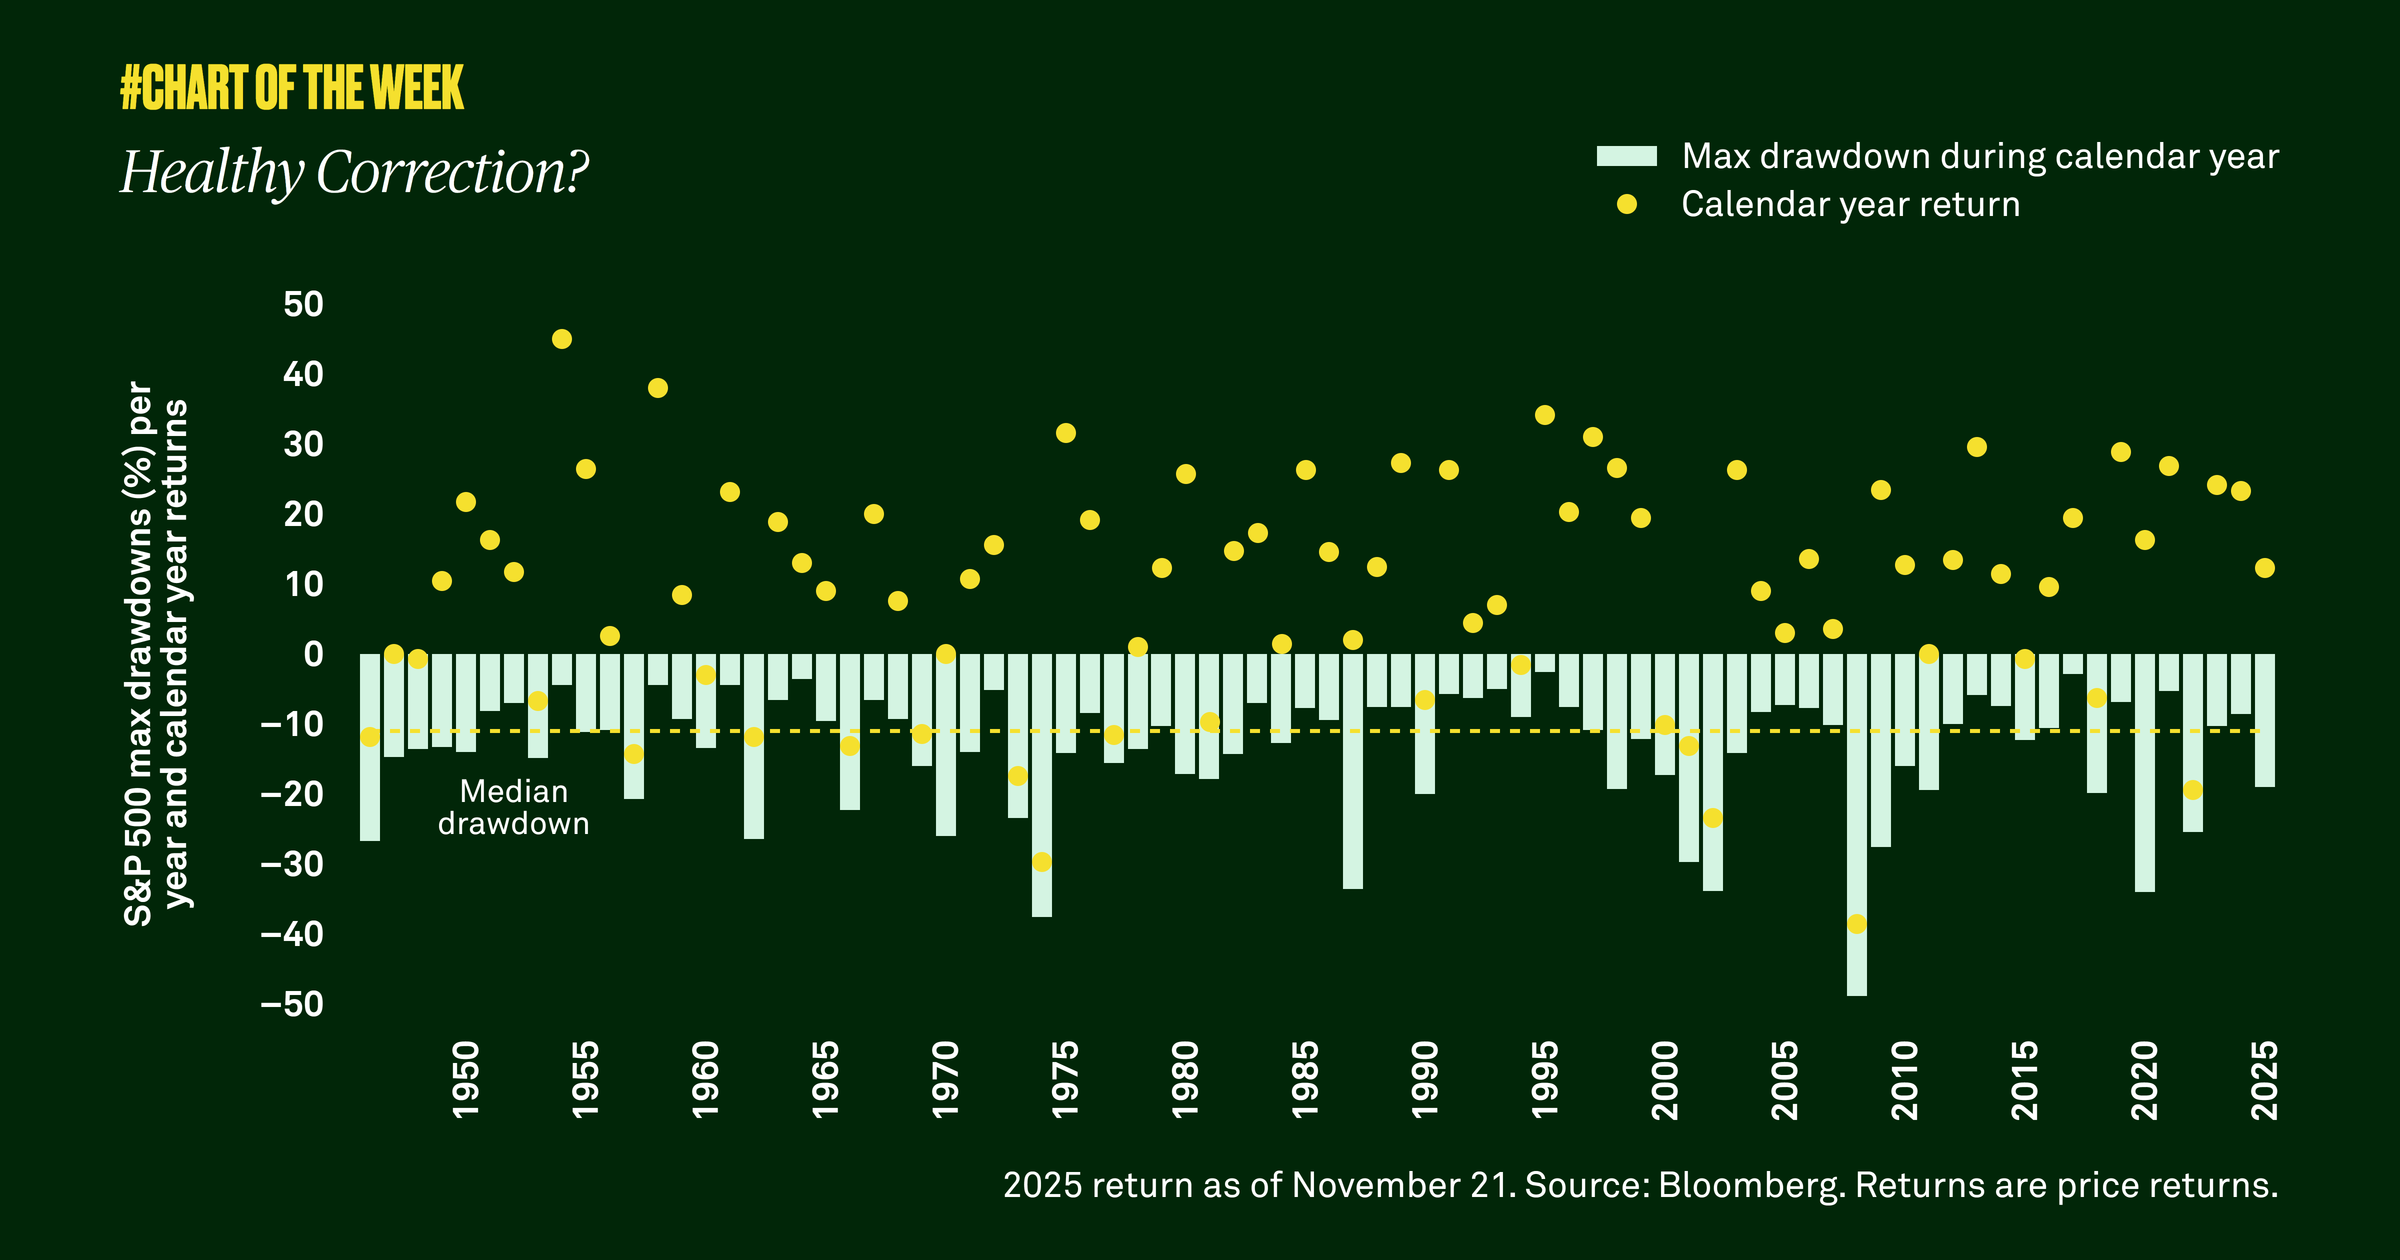
History shows that markets don’t move in a straight line, and drawdowns are normal. Since 1946, the S&P 500 has experienced a median annual correction of 11%.

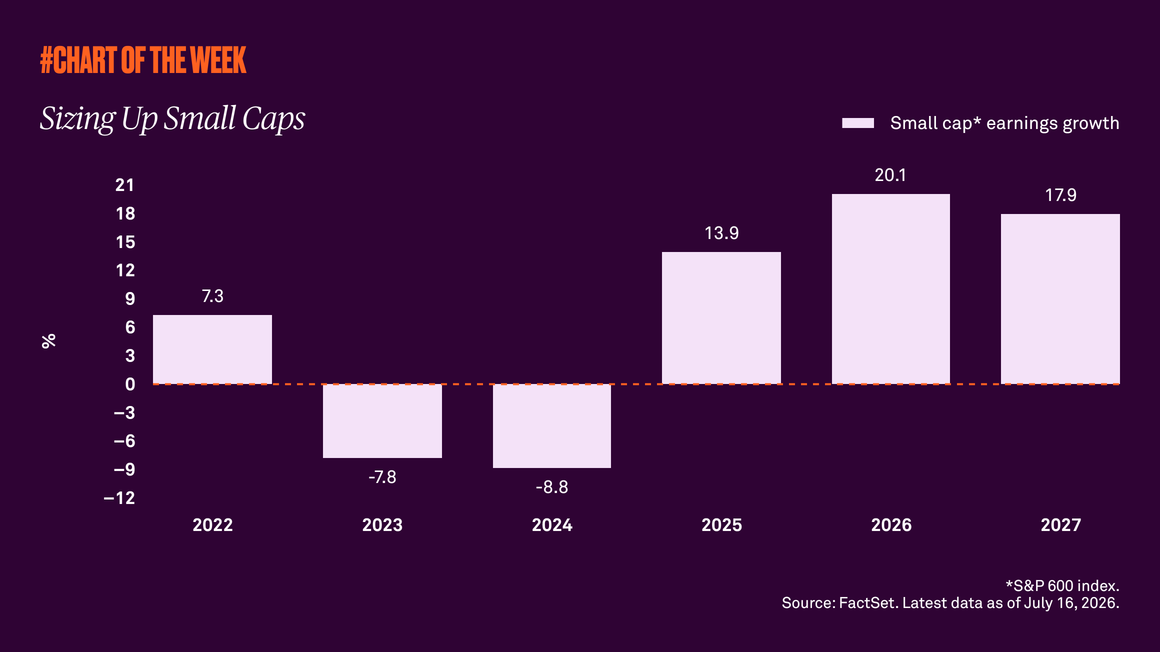
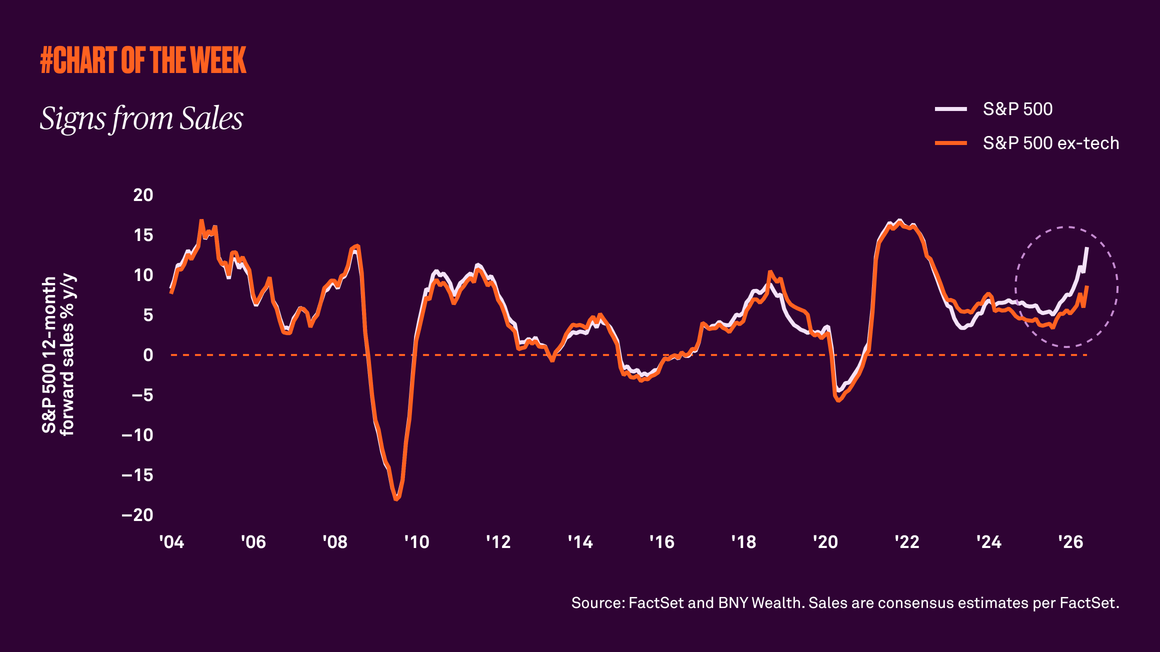
Additionally, we do not believe we’re heading for a bear market or imminent recession, and we see the latest decline as more technically driven rather than a change in fundamentals or a more negative outlook. In 2026, we expect economic growth near 2% and earnings growth to continue to broaden beyond the tech sector, which should support equity performance. Therefore, staying invested and weathering the downside is critical for capturing potential upside. 

RELATED CONTENT
Returns after oil spikes
Chart of the week | Macroeconomic

The Strait of Hormuz, which moves about 20% of global oil, has seen many ships that normally travel through it curtail their activity. Consequently, WTI oil was up over 36% in the five days after the oil supply shock began. Yet equities barely budged, signaling a temporary supply shock, not a larger crisis. Historically, after similar price spikes equities tend to move higher while oil prices decline — further evidence for avoiding emotion-driven investing.

Impact of geopolitics over time?
Chart of the week | Macroeconomic

Tensions between the U.S./Israel and Iran have recently boiled over into a military conflict, which has given many investors the jitters. However, our research shows that equity market pullbacks resulting from geopolitical events are often short lived with the S&P 500 typically higher in the months following these events.

Behind the numbers: Q4 GDP
Chart of the week | Macroeconomic

Gross domestic product undershot expectations last quarter, but the shortfall appears driven more by the temporary government shutdown than broad-based weakness. Consumer demand remains resilient, and with supportive fiscal policy, easing financial conditions and a steady labor market, the outlook points to a modest acceleration in economic activity this year.

Narrow drawdown?
Chart of the week | Macroeconomic

Equity volatility is rising, but all is not what it seems. The technology sector is weighing on the S&P 500 while value and cyclical stocks lead. A market rotation is underway as many investors begin to favor companies beyond tech.

Gathering data
Disclaimer Not Available

CONTACT US  |  +852 3926 0600