
We expect market leadership to broaden beyond mega-cap tech in U.S. equity markets. For growth heavy portfolios, the narrowing gap between growth and value signals a potential need to add value investments to reduce concentration risk and improve diversification.
A Turning Point
Since November 2025, growth’s momentum has started to slow, and value has begun to outperform, suggesting a shift in market leadership after years of growth dominance. The recent decline in the growth-to-value ratio reinforces that this rotation into value may already be underway. In January alone, mega-cap tech, as represented by the Magnificent 7, was highly dispersed and no longer moving in lockstep, raising both volatility and return risk. For example, Meta advanced by more than 9% while Microsoft declined by 11% during this period. Given this backdrop, we believe it’s increasingly important to broaden exposure to value while being more selective within growth.
U.S. Growth vs Value
The ratio below 1.0 indicates value outperformance; above 1.0 indicates growth outperformance.
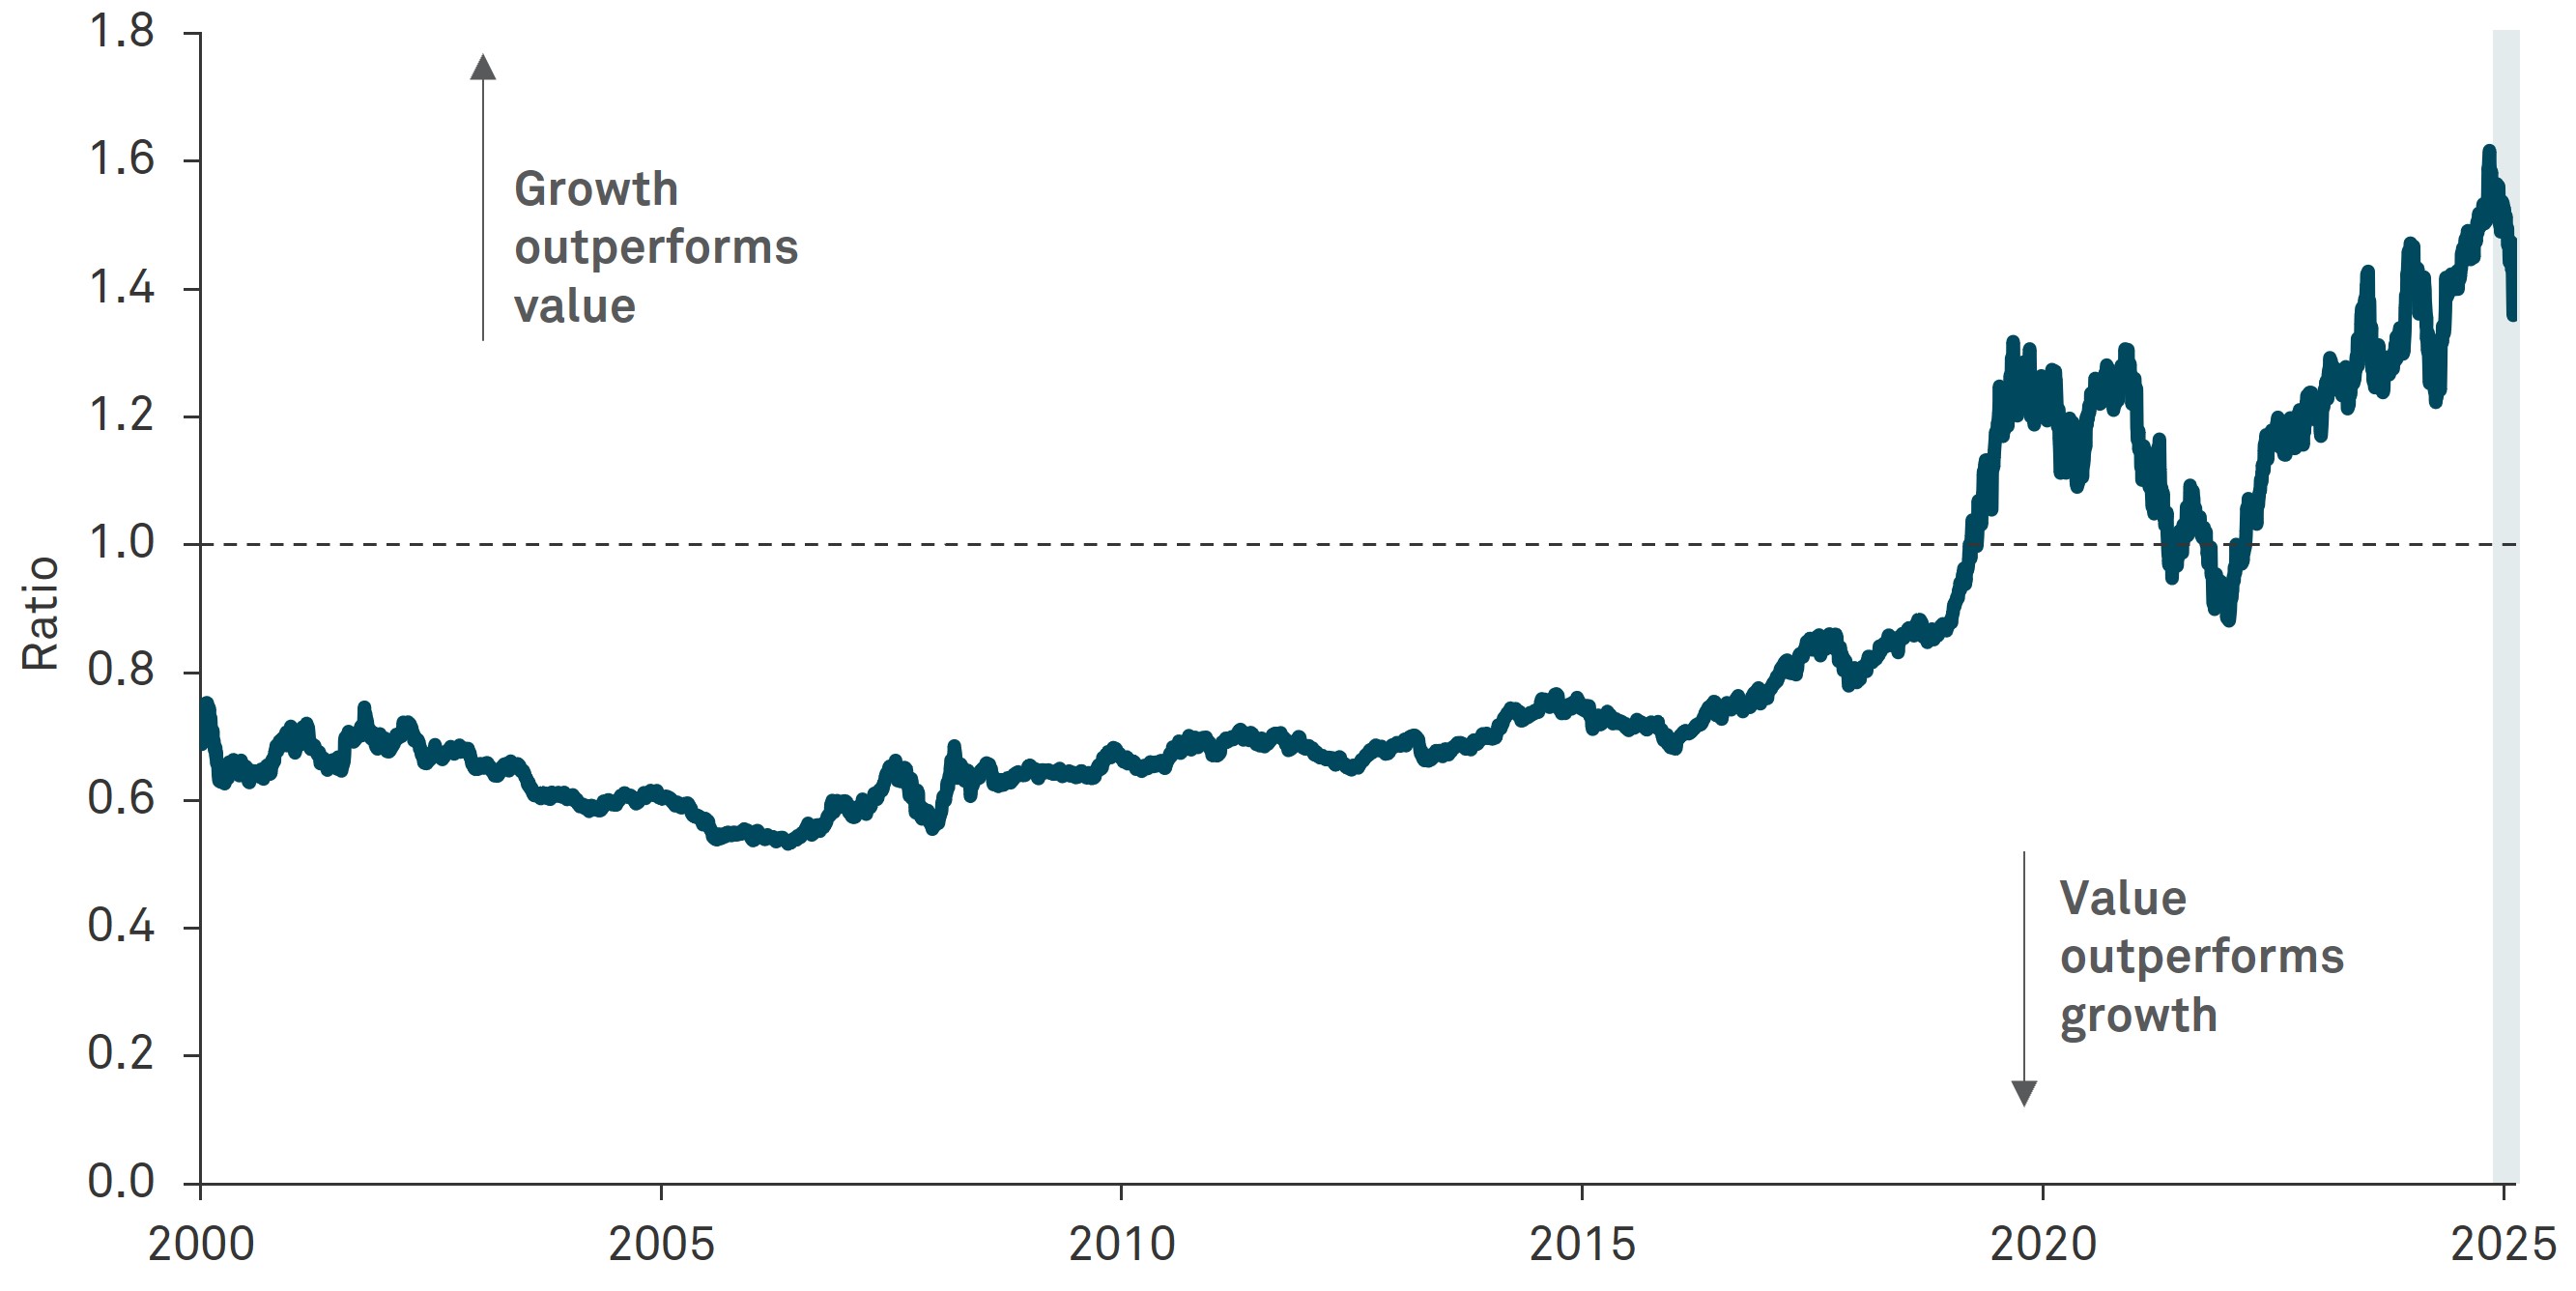
Source: Source: BNY Investment Strategy & Research Group, Macrobond. Data as of January 31, 2026.
Magnificent 7 Year-to-Date Performance
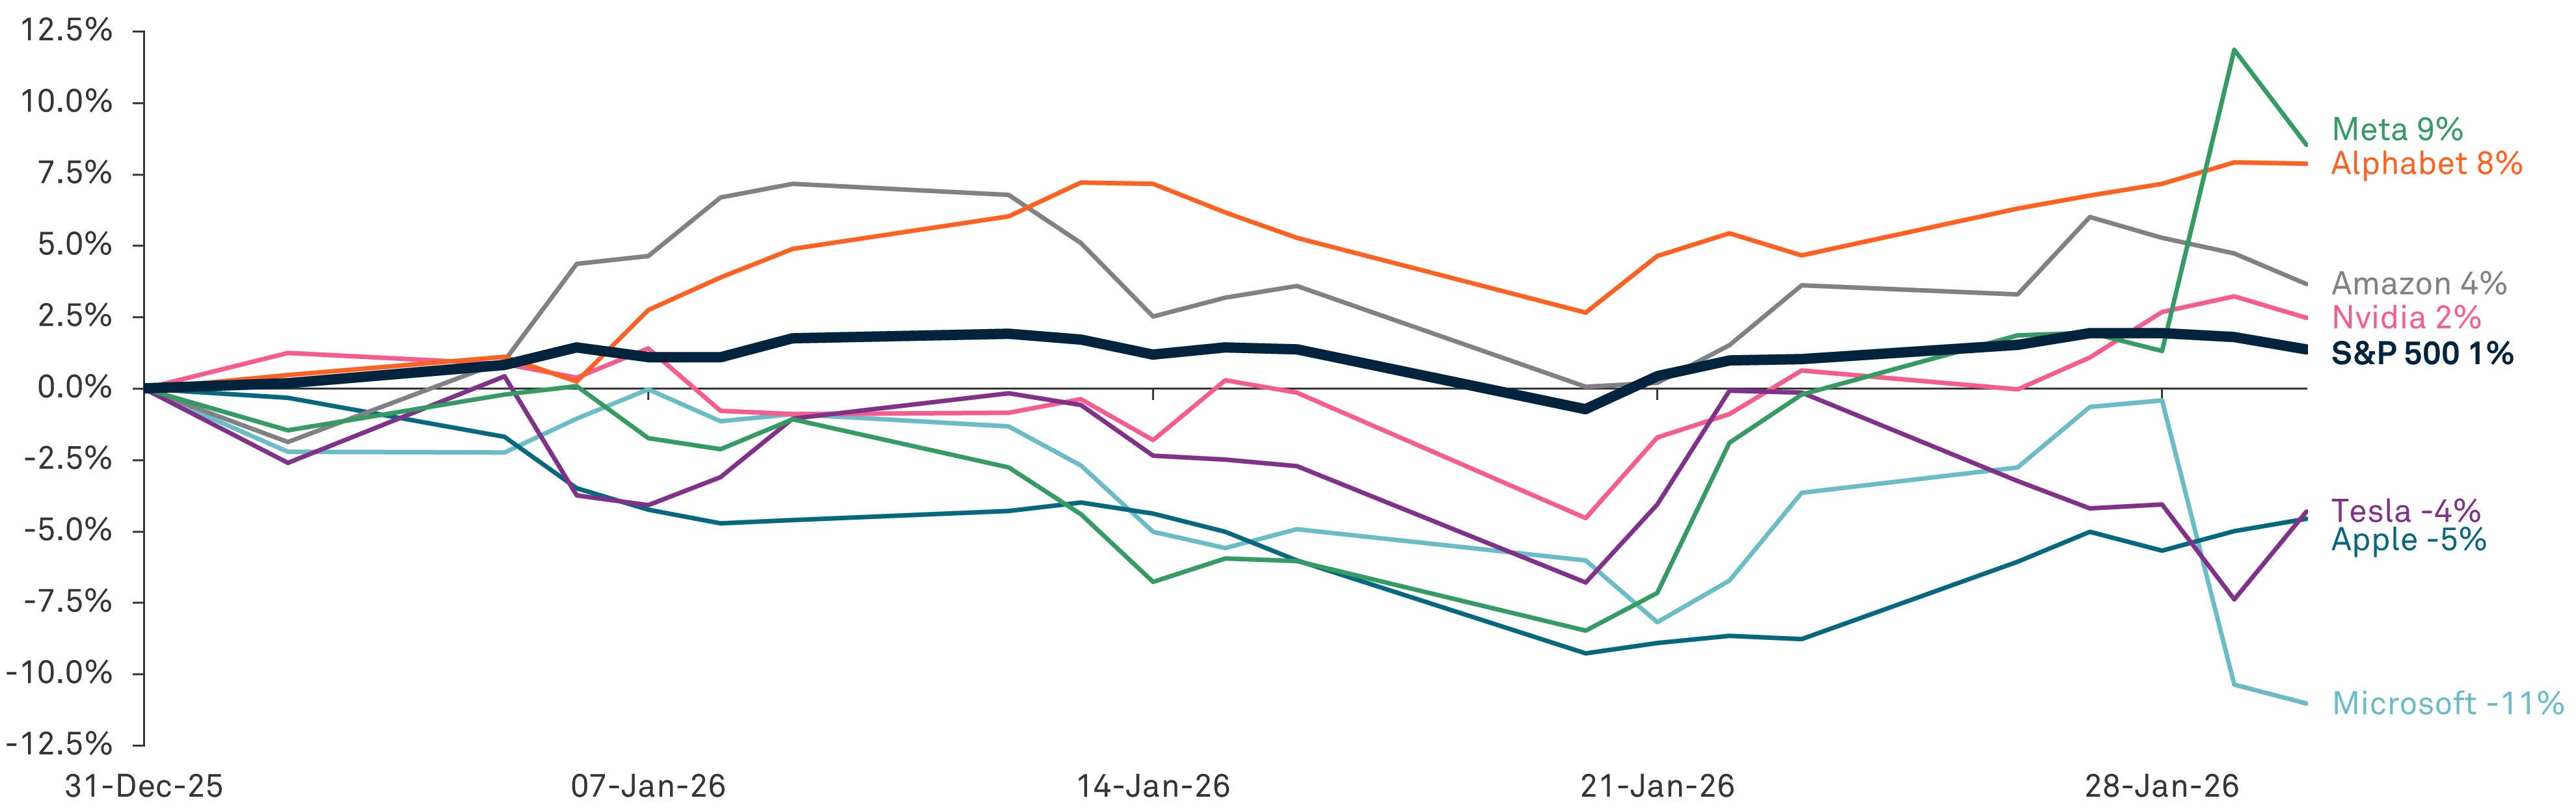
BNY Investment Strategy & Research Group, Macrobond. Data as of January 31, 2026.
Momentum for Value
We believe the shift toward value is driven by improving fundamentals in the large cap value asset class. Looking at profit margins, large-cap growth companies have declined 2.5 percentage points in the last six months. Meanwhile, large-cap value companies, such as those in the financial sector, grew from flat to 1.0% over the same time period, signaling a shift toward positive momentum. We believe the trend into value will continue. Including value stocks alongside growth stocks can help investors navigate a continued rotation toward broader equity leadership while strengthening diversification and return durability.
Yearly Change in Profit Margin
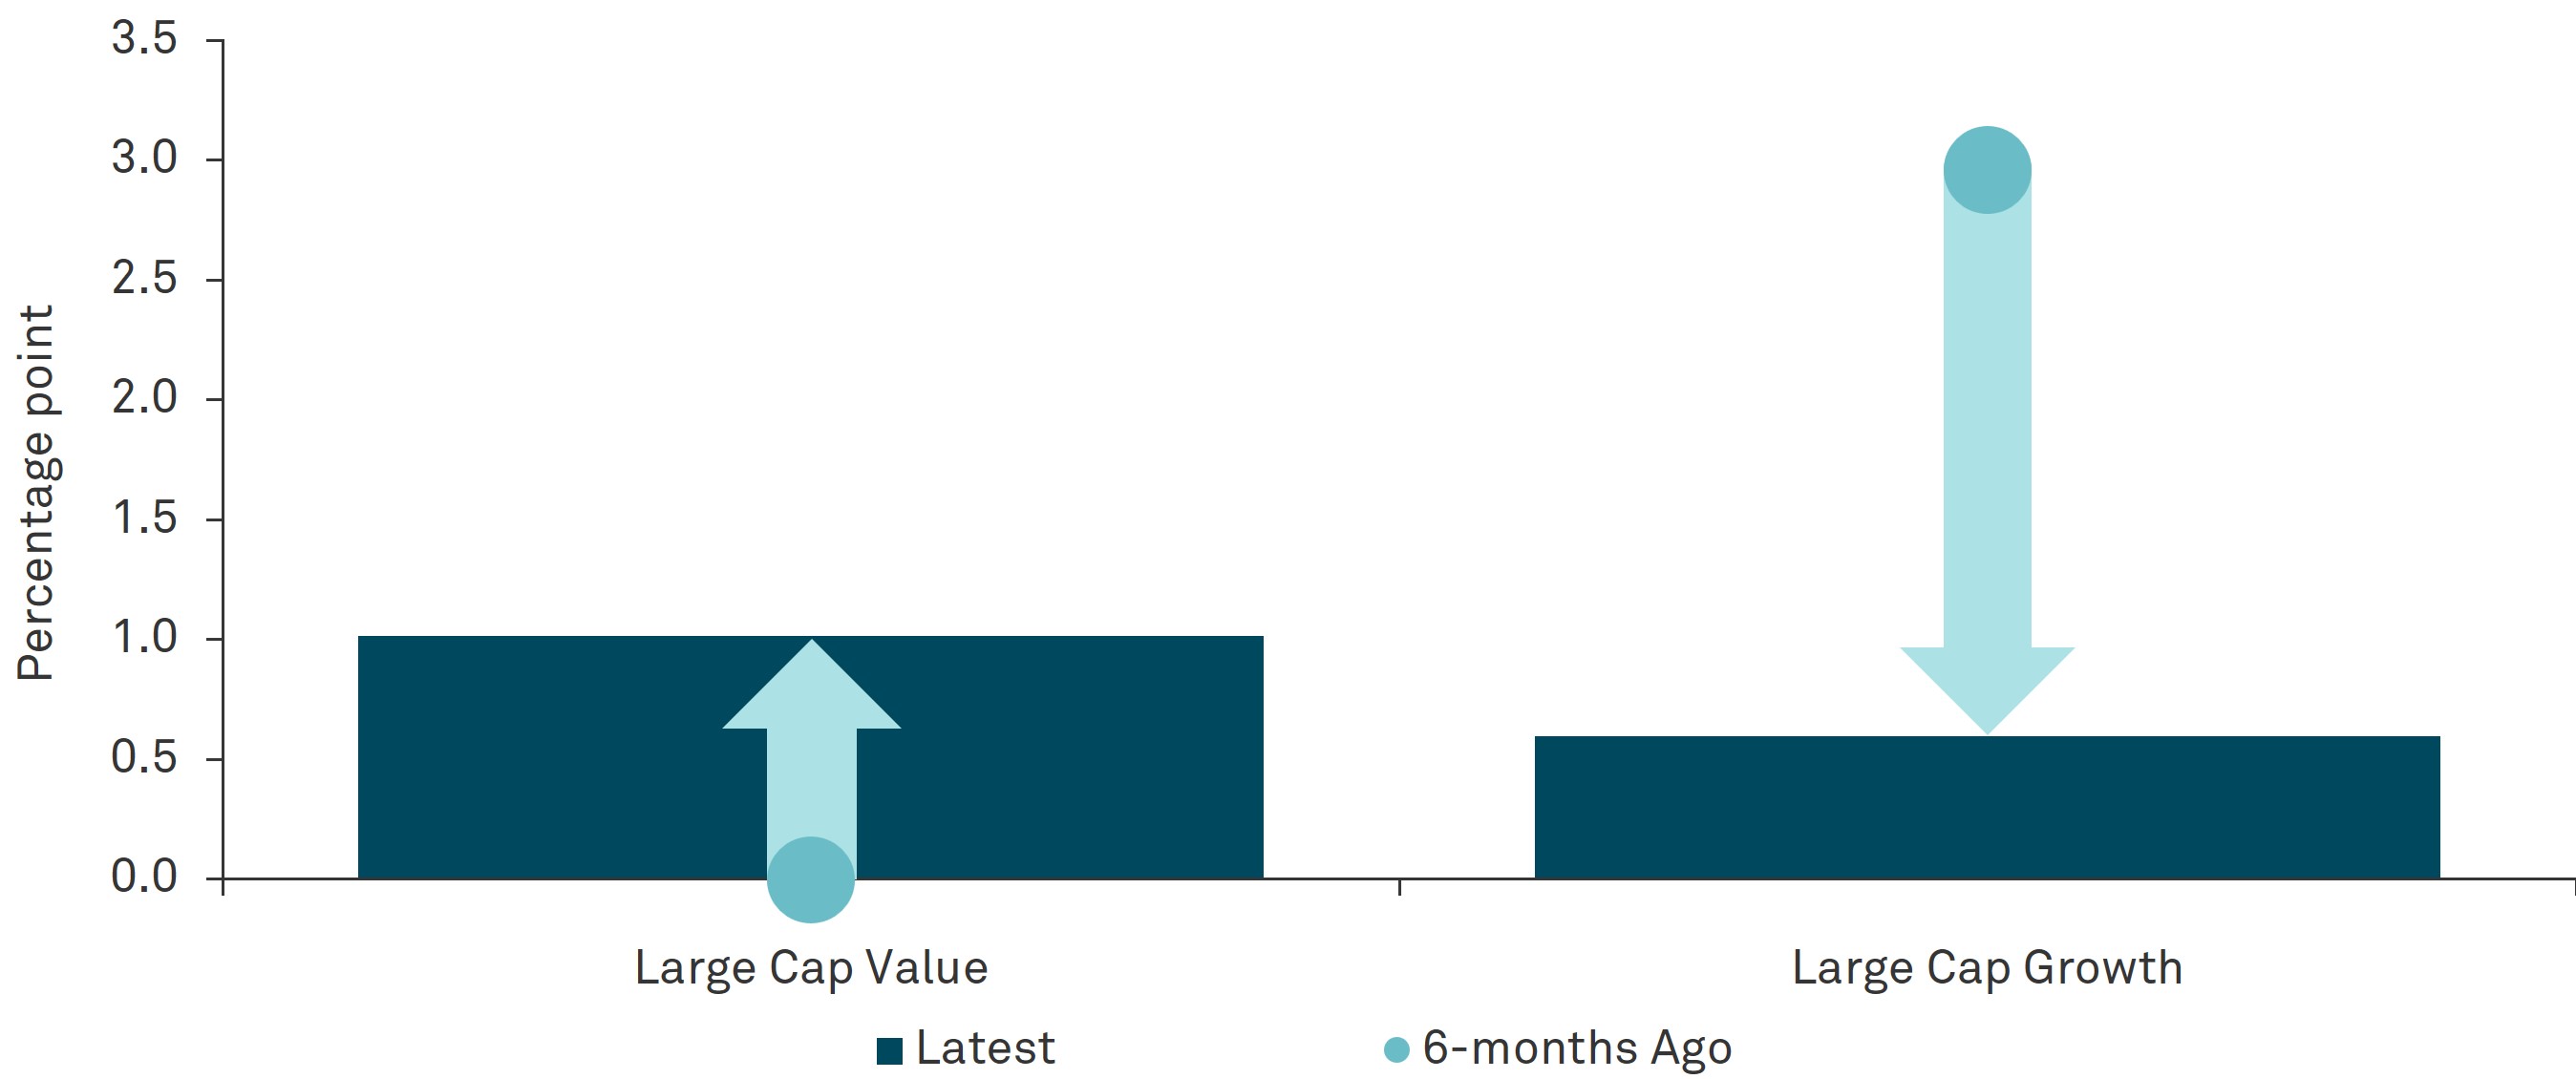
BNY Investment Strategy & Research Group, Macrobond. Data as of January 31, 2026.
This is an extract from Checkpoints, a comprehensive monthly chartbook that provides insights into major themes affecting financial markets. For additional analysis, read the full report.

GLOSSARY
Growth stocks are companies that are expected to grow quickly; investors often pay higher prices relative to current profits.
Large-cap refers to companies with a large total market value (their share price multiplied by the number of shares). “Large-cap value” and “large cap growth” are style segments within this size group.
Magnificent 7 refers to the following seven stocks: Nvidia, Meta, Tesla, Amazon, Alphabet, Apple, and Microsoft.
Market leadership is the group of stocks or sectors that are driving most of the gains in the stock market over a period of time.
Mega-cap tech refers to very large technology companies with extremely high market values (e.g., the largest, most well-known tech firms). These stocks have often dominated U.S. market performance in recent years.
Value stocks are companies that appear cheaper relative to fundamentals (like earnings or book value), often because they are out of favor or in mature industries.
IMPORTANT INFORMATION
IN THE UNITED STATES: FOR GENERAL PUBLIC USE.
IN ALL OTHER JURISDICTIONS: FOR INSTITUTIONAL, PROFESSIONAL, QUALIFIED INVESTORS AND QUALIFIED CLIENTS.
The information contained herein reflects general views and is provided for informational purposes only. This material is not intended as investment advice nor is it a recommendation to adopt any investment strategy. Opinions and views expressed are subject to change without notice.
PAST PERFORMANCE IS NO GUARANTEE OF FUTURE RESULTS.
ISSUING ENTITIES
This material is only for distribution in those countries and to those recipients listed, subject to the noted conditions and limitations: • United States: by BNY Mellon Securities Corporation (BNYSC), 240 Greenwich Street, New York, NY 10286. BNYSC, a registered broker-dealer and FINRA member, has entered into agreements to offer securities in the U.S. on behalf of certain BNY Investments firms. • Europe (excluding Switzerland): BNY Mellon Fund Management (Luxembourg) S.A., 2-4 Rue Eugène Ruppert L-2453 Luxembourg. • UK, Africa and Latin America (ex-Brazil): BNY Mellon Investment Management EMEA Limited, BNY Mellon Centre, 160 Queen Victoria Street, London EC4V 4LA. Registered in England No. 1118580. Authorised and regulated by the Financial Conduct Authority. • South Africa: BNY Mellon Investment Management EMEA Limited is an authorised financial services provider. • Switzerland: BNY Mellon Investments Switzerland GmbH, Bärengasse 29, CH-8001 Zürich, Switzerland. • Middle East: DIFC branch of The Bank of New York Mellon. Regulated by the Dubai Financial Services Authority. • South East Asia and South Asia: BNY Mellon Investment Management Singapore Pte. Limited Co. Reg. 201230427E. Regulated by the Monetary Authority of Singapore. • Hong Kong: BNY Mellon Investment Management Hong Kong Limited. Regulated by the Hong Kong Securities and Futures Commission. • Japan: BNY Mellon Investment Management Japan Limited. BNY Mellon Investment Management Japan Limited is a Financial Instruments Business Operator with license no 406 (Kinsho) at the Commissioner of Kanto Local Finance Bureau and is a Member of the Investment Trusts Association, Japan and Japan Investment Advisers Association and Type II Financial Instruments Firms Association. • Brazil: ARX Investimentos Ltda., Av. Borges de Medeiros, 633, 4th floor, Rio de Janeiro, RJ, Brazil, CEP 22430-041. Authorized and regulated by the Brazilian Securities and Exchange Commission (CVM). • Canada: BNY Mellon Asset Management Canada Ltd. is registered in all provinces and territories of Canada as a Portfolio Manage and Exempt Market Dealer, and as a Commodity Trading Manager in Ontario. All issuing entities are subsidiaries of The Bank of New York Mellon Corporation.
NOT FDIC INSURED | NO BANK GUARANTEE | MAY LOSE VALUE
© 2026 THE BANK OF NEW YORK MELLON CORPORATION
MARK-887488-2026-02-17
GU-802 -28 February 2027