Please ensure Javascript is enabled for purposes of website accessibility Is Big Tech Overvalued?
fr
fr
intermediary
intermediary
false
true
Gathering data
Disclaimer Not Available

Is Big Tech Overvalued?

Is Big Tech Overvalued?

It’s true that the S&P 500 currently exhibits high valuations, with the technology sector alone comprising over 40% of its market capitalization and driving concerns about valuations. Are those high multiples justified?  


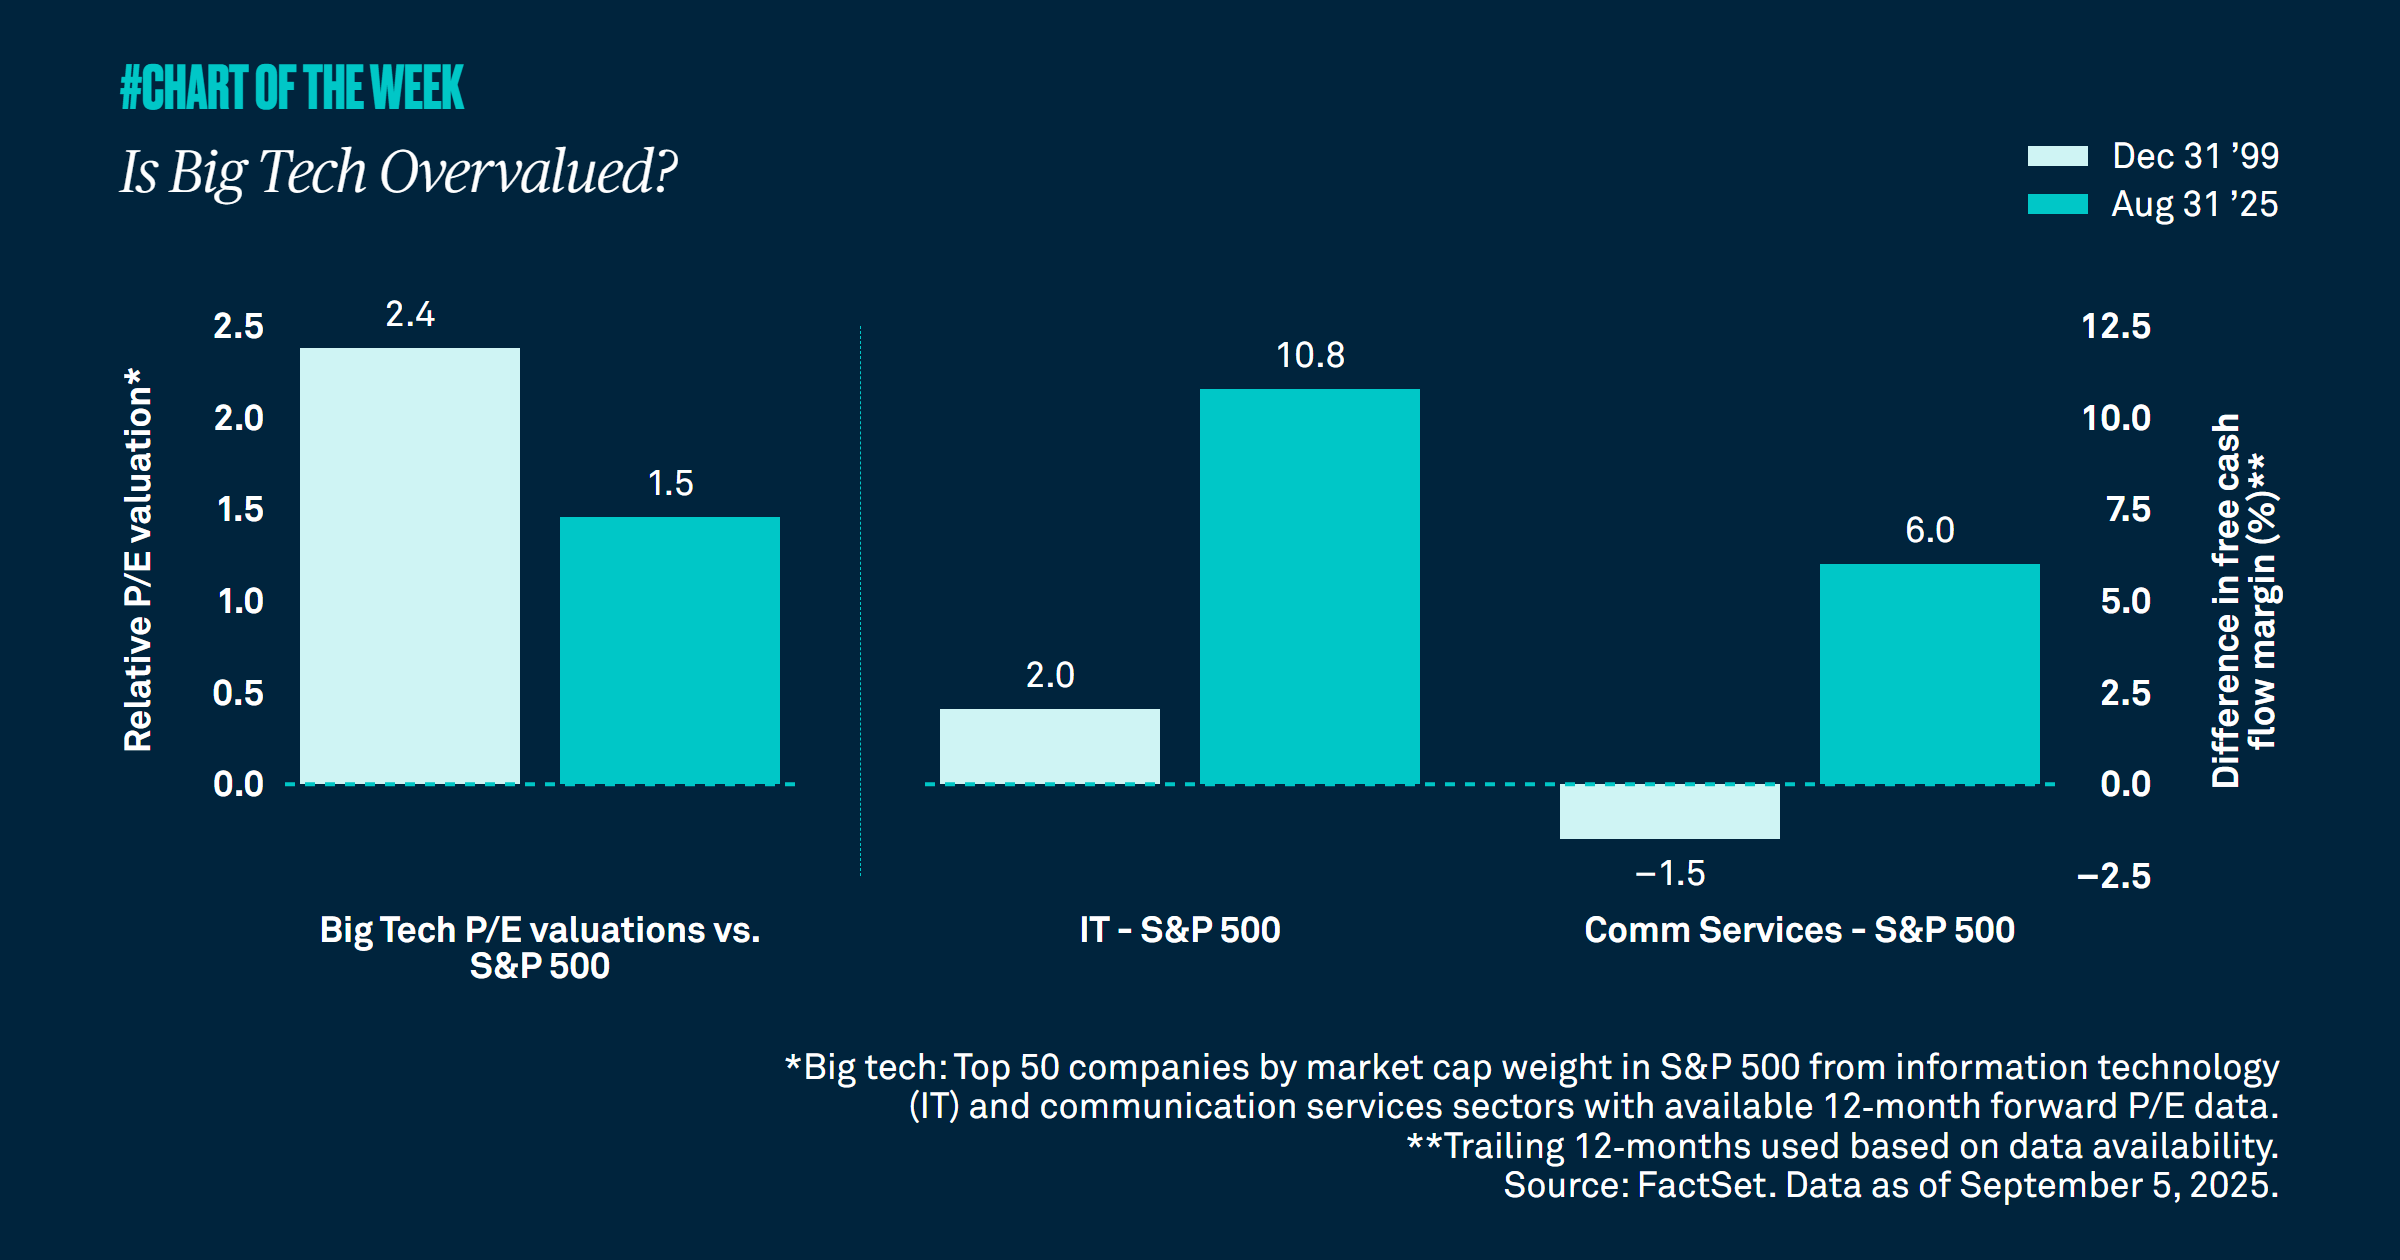
There are concerns among some investors that technology stocks, which account for over 40% of the S&P 500’s market capitalization, are trading at valuations that call to mind the boom and bust of the dot.com era. However, during the dot.com bubble, big tech was 2.4X more expensive than the S&P 500 compared to only 1.5X today.

Another factor to consider is the profitability of the market as measured by free cash flow margins. In 1999, the Information Technology sector’s free cash flow margins were 2% higher than that of the S&P 500. Today that number is as high as 11%. Additionally, margins in Communication Services are 6% greater than that of the broader index compared to -1.5% in 1999.

Lower relative valuations and greater profitability suggest to us that big tech is not overvalued, and these companies justify their price tags. In our view, the late 90s and early 2000s do not, bear a convincing resemblance to today. We remain constructive on equities and U.S. large cap stocks in particular as we continue to anticipate the many ways artificial intelligence, a huge driver of growth in the tech space, can improve profitability for all the S&P 500 sectors.

AUTRES ARTICLES ASSOCIÉS
cotw-30-03-2026-thumbnail-580x326px
Chart of the week | Macroéconomique

Markets are reacting to the Middle East conflict with sharp moves across asset classes, signaling broad risk repricing and shifting safe haven behavior. While volatility is elevated, fundamentals like earnings growth continue to support our constructive outlook.

Signals from spreads
Chart of the week | Macroéconomique

Credit spreads have risen yet remain historically low, reinforcing our view that the oil shock is likely temporary — not a driver of long-term growth concerns.

Dollar strength: what does it mean for markets?
Chart of the week | Macroéconomique

Geopolitical tensions have lifted oil prices, sent U.S. stocks slightly lower and driven flows into the safety of the U.S. dollar, which has strengthened versus peers. While a weaker dollar previously supported international equity outperformance, dollar stabilization now suggests that tailwind is fading, underscoring the importance of diversification across regions and asset classes.

Returns after oil spikes
Chart of the week | Macroéconomique

The Strait of Hormuz, which moves about 20% of global oil, has seen many ships that normally travel through it curtail their activity. Consequently, WTI oil was up over 36% in the five days after the oil supply shock began. Yet equities barely budged, signaling a temporary supply shock, not a larger crisis. Historically, after similar price spikes equities tend to move higher while oil prices decline — further evidence for avoiding emotion-driven investing.

Gathering data
Disclaimer Not Available

Ce document constitue une communication marketing