Please ensure Javascript is enabled for purposes of website accessibility What Is Driving Slowing Inflation?
fi
en
institutional
institutional
false
true
Gathering data
Disclaimer Not Available

What is driving slowing inflation?

What is driving slowing inflation?

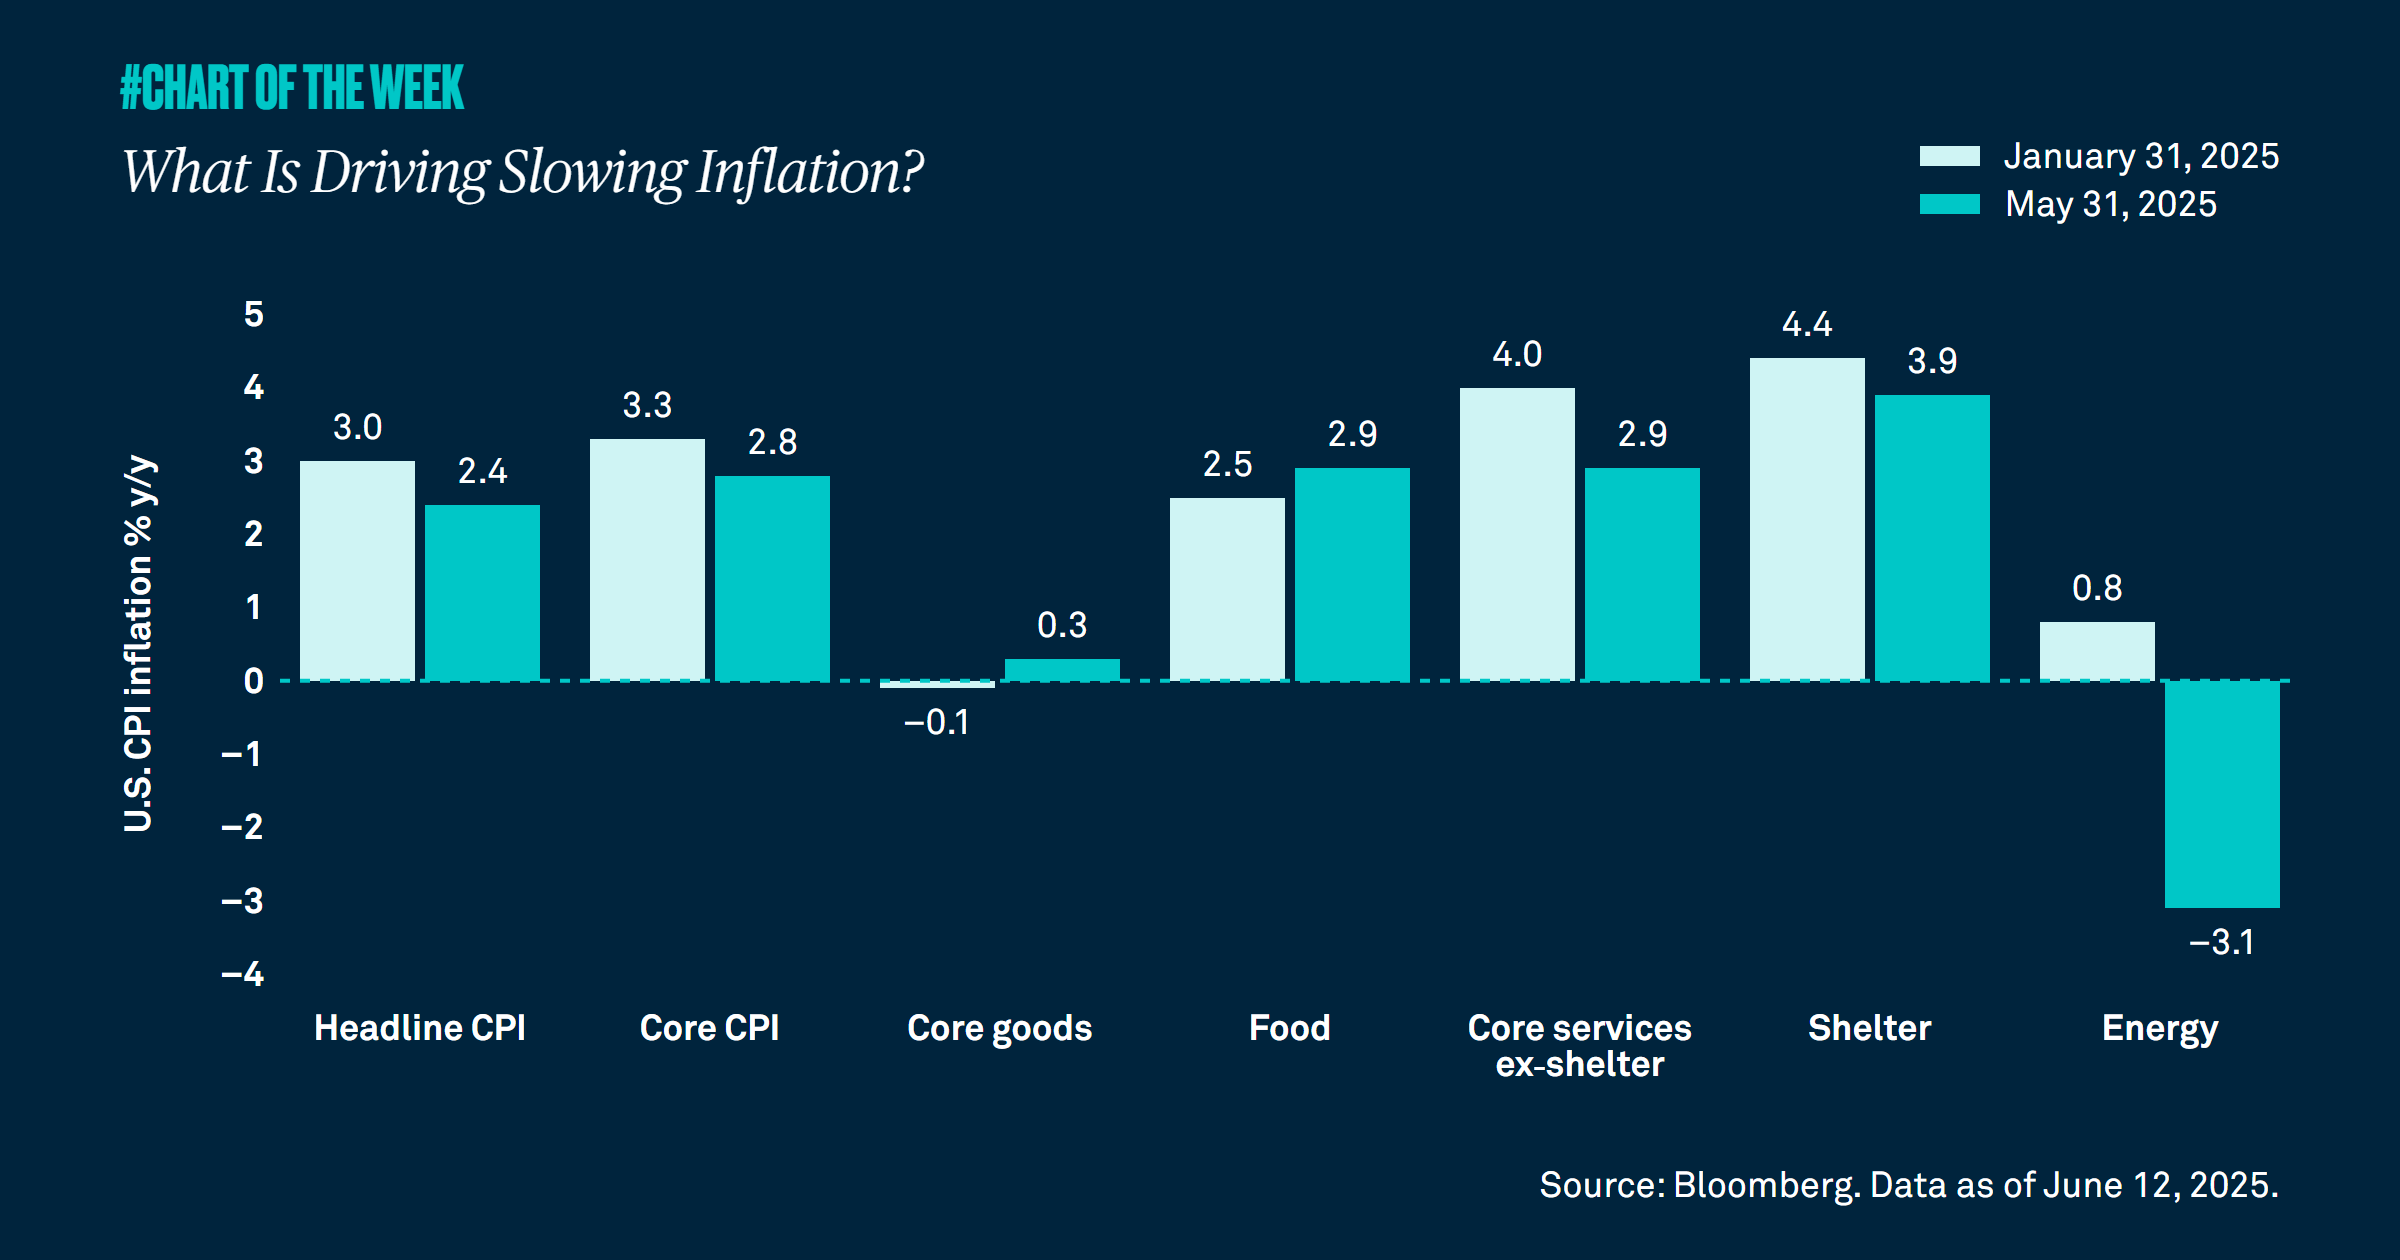
Inflation came in cooler than expected in May. In fact, it’s down from January’s growth rate of 3.0% year over year to 2.4%. While stickier services components such as shelter have driven this decline, could the recent uptick in oil prices and higher tariffs pose headwinds?


While we expected inflation to slow, it is encouraging to see the stickier components of services and shelter inflation driving the decline.

Led by services, the disinflation trend has been notable, with prices declining from a growth rate of 3.0% from a year ago in January to 2.4% in May. At 3.9% year over year, shelter inflation is the lowest it has been since November 2021, while core services at 2.9% is the lowest in more than four years.

However, could tariff-related price hikes and the recent increase in oil prices due to tensions in the Middle East hamper the downward path of inflation? We believe the impact of tariffs will amount to a one-time price adjustment as opposed to a long-term trend. Despite the roughly $17 increase in the price of oil since early May to $74 a barrel, it is only up 0.4% from a year ago. If there are no significant supply disruptions or if tensions de-escalate, the additional impact to energy prices or overall inflation should be limited. While the disinflation trend may slow from here, we maintain our year-end inflation forecast of 2.5-3.5%.

RELATED CONTENT
Narrow drawdown?
Chart of the week | Macroeconomic

Equity volatility is rising, but all is not what it seems. The technology sector is weighing on the S&P 500 while value and cyclical stocks lead. A market rotation is underway as many investors begin to favor companies beyond tech.

Capex as a catalyst
Chart of the week | Macroeconomic

Improved business confidence and recent tax legislation are compelling corporations to reinvest their cash flows in their businesses. We believe this is a positive signal for economic growth.

Global leading indicator turning higher
Chart of the week | Macroeconomic

Headline volatility persists and yet the global growth outlook continues to improve. We examined a leading indicator, and why there is good cause to diversify equity holdings if you haven’t already.

A cyclical rotation?
Chart of the week | Macroeconomic

Stronger growth expectations are driving a global rotation out of growth-oriented and mega cap technology stocks, and into cyclical companies. At a time when geopolitical tensions and tariff discussions continue to simmer, we remind investors to stay invested despite the headline noise.

Gathering data
Disclaimer Not Available

This is a marketing communication