The S&P 500 is up 14% year to date after gaining more than 20% annually over the past couple of years. Valuations are certainly elevated, but we believe the market is in a new world where higher multiples are normal rather than stretched.
The S&P 500 is up 14% year to date after gaining more than 20% annually over the past couple of years. Some investors are speculating that we are amidst another tech bubble because technology companies have been leading the market higher. However, we believe the market is in a new world where higher multiples are normal rather than a sign of stretched valuations.
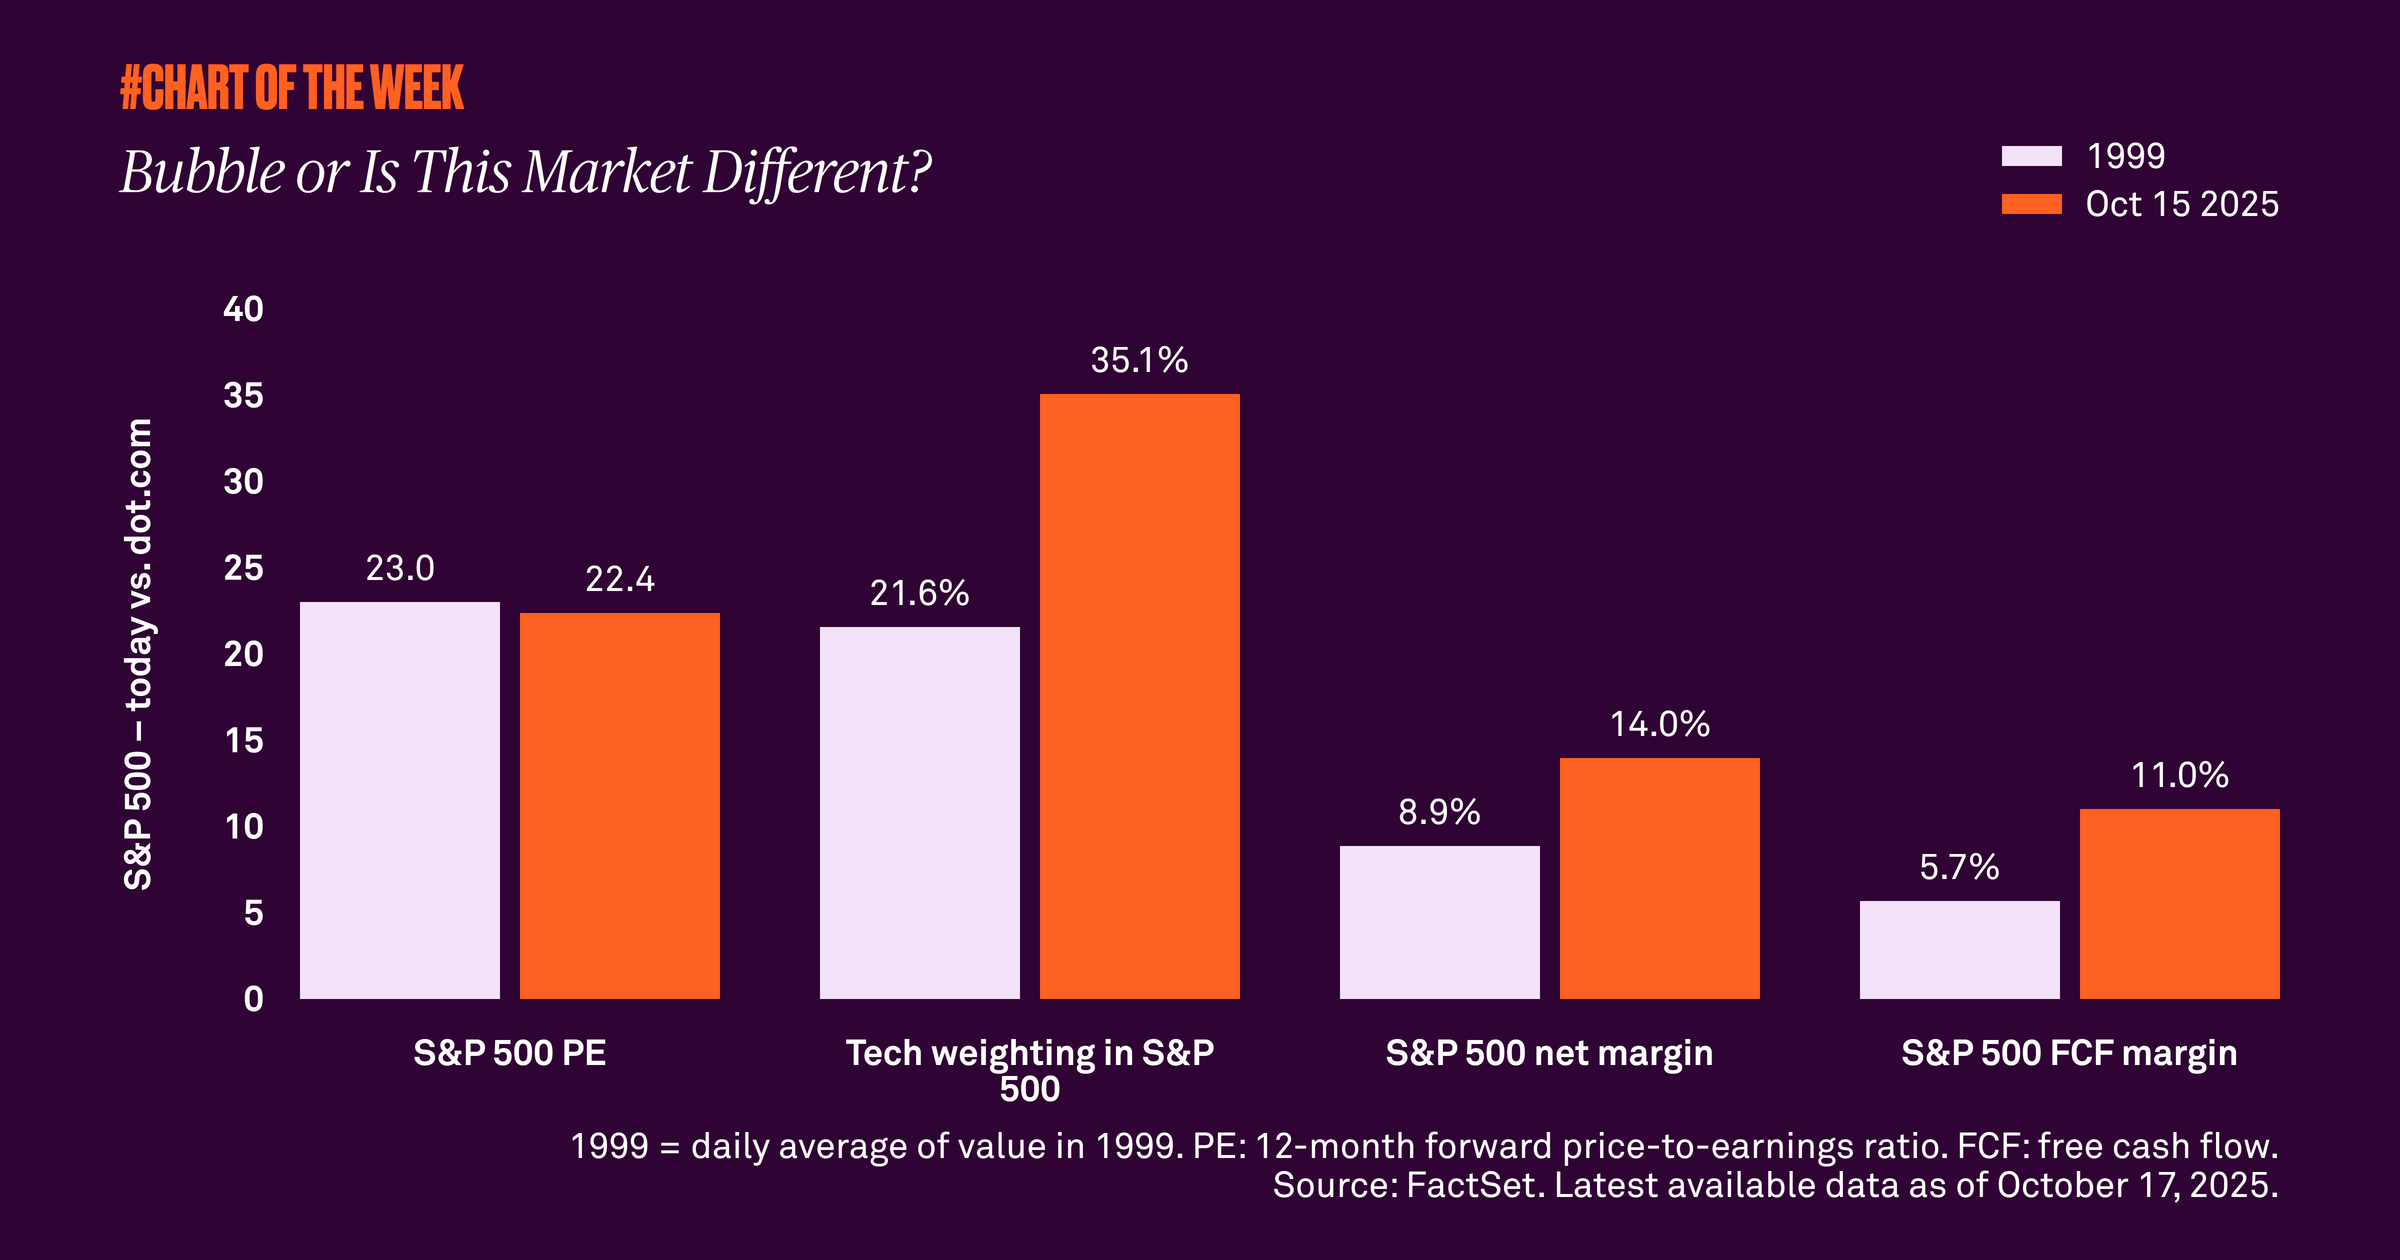
For some context, the S&P 500’s 12-month future price-to-earnings (PE) ratio is currently 22.4x, notably greater than the 16.8x average since 1996. While the index appears expensive relative to history, we believe this higher-multiple environment is justified. A key reason is the improved profitability of the market; net margins are 1.6x higher at 14% compared to the dot.com era. Similarly, free cash flow margins are 1.9x higher at 11%. In addition, the weight of the technology sector, which has the highest PE, has increased 1.6x since the dot.com era to 35% of the index. This naturally increases the PE of the index.
The changing market structure with the increased size of tech and the broader index’s higher profitability have led to higher PEs compared to long-term averages. In our view, the disconnect between current valuations and historical averages reflects a different type of market – not an overvalued one.
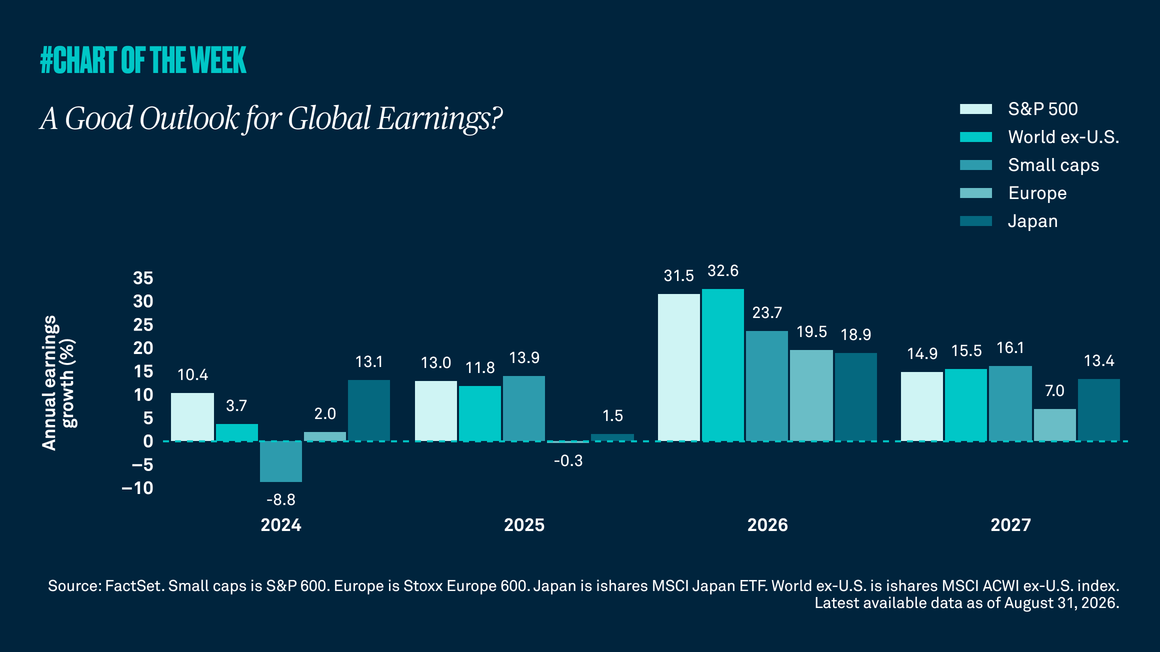
So, while we don’t believe the market is in a bubble, we believe that investors’ skepticism is healthy for keeping bull markets intact. Current valuations could consolidate from elevated levels, but we remain constructive on the forward outlook given improving earnings.