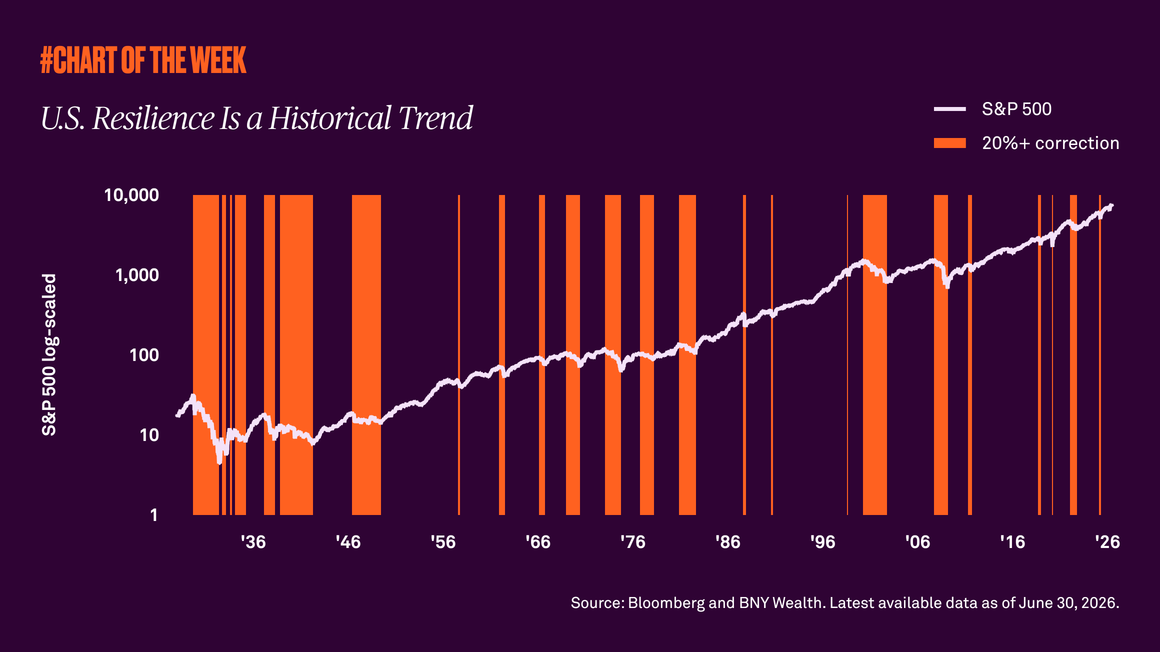
Last week the S&P 500 reached yet another all-time high. After nearing a 20% decline in April, the index is up over 8% year to date. With a 22x forward price-to-earnings ratio for the S&P 500, many investors are wondering if the market is expensive. Our analysis suggests that valuations are high because the market is more profitable, which is driven by tech.
Last week the S&P 500 reached yet another all-time high. After nearing a 20% decline in April, the index is up over 8% year to date. Its price-to-earnings (PE) ratio, a measure that indicates how much investors are willing to pay for earnings expected over the next 12 months, is now 22x compared to the roughly 17x average set since 1996. The wide discrepancy has led some investors to worry that the equity market has become too expensive.
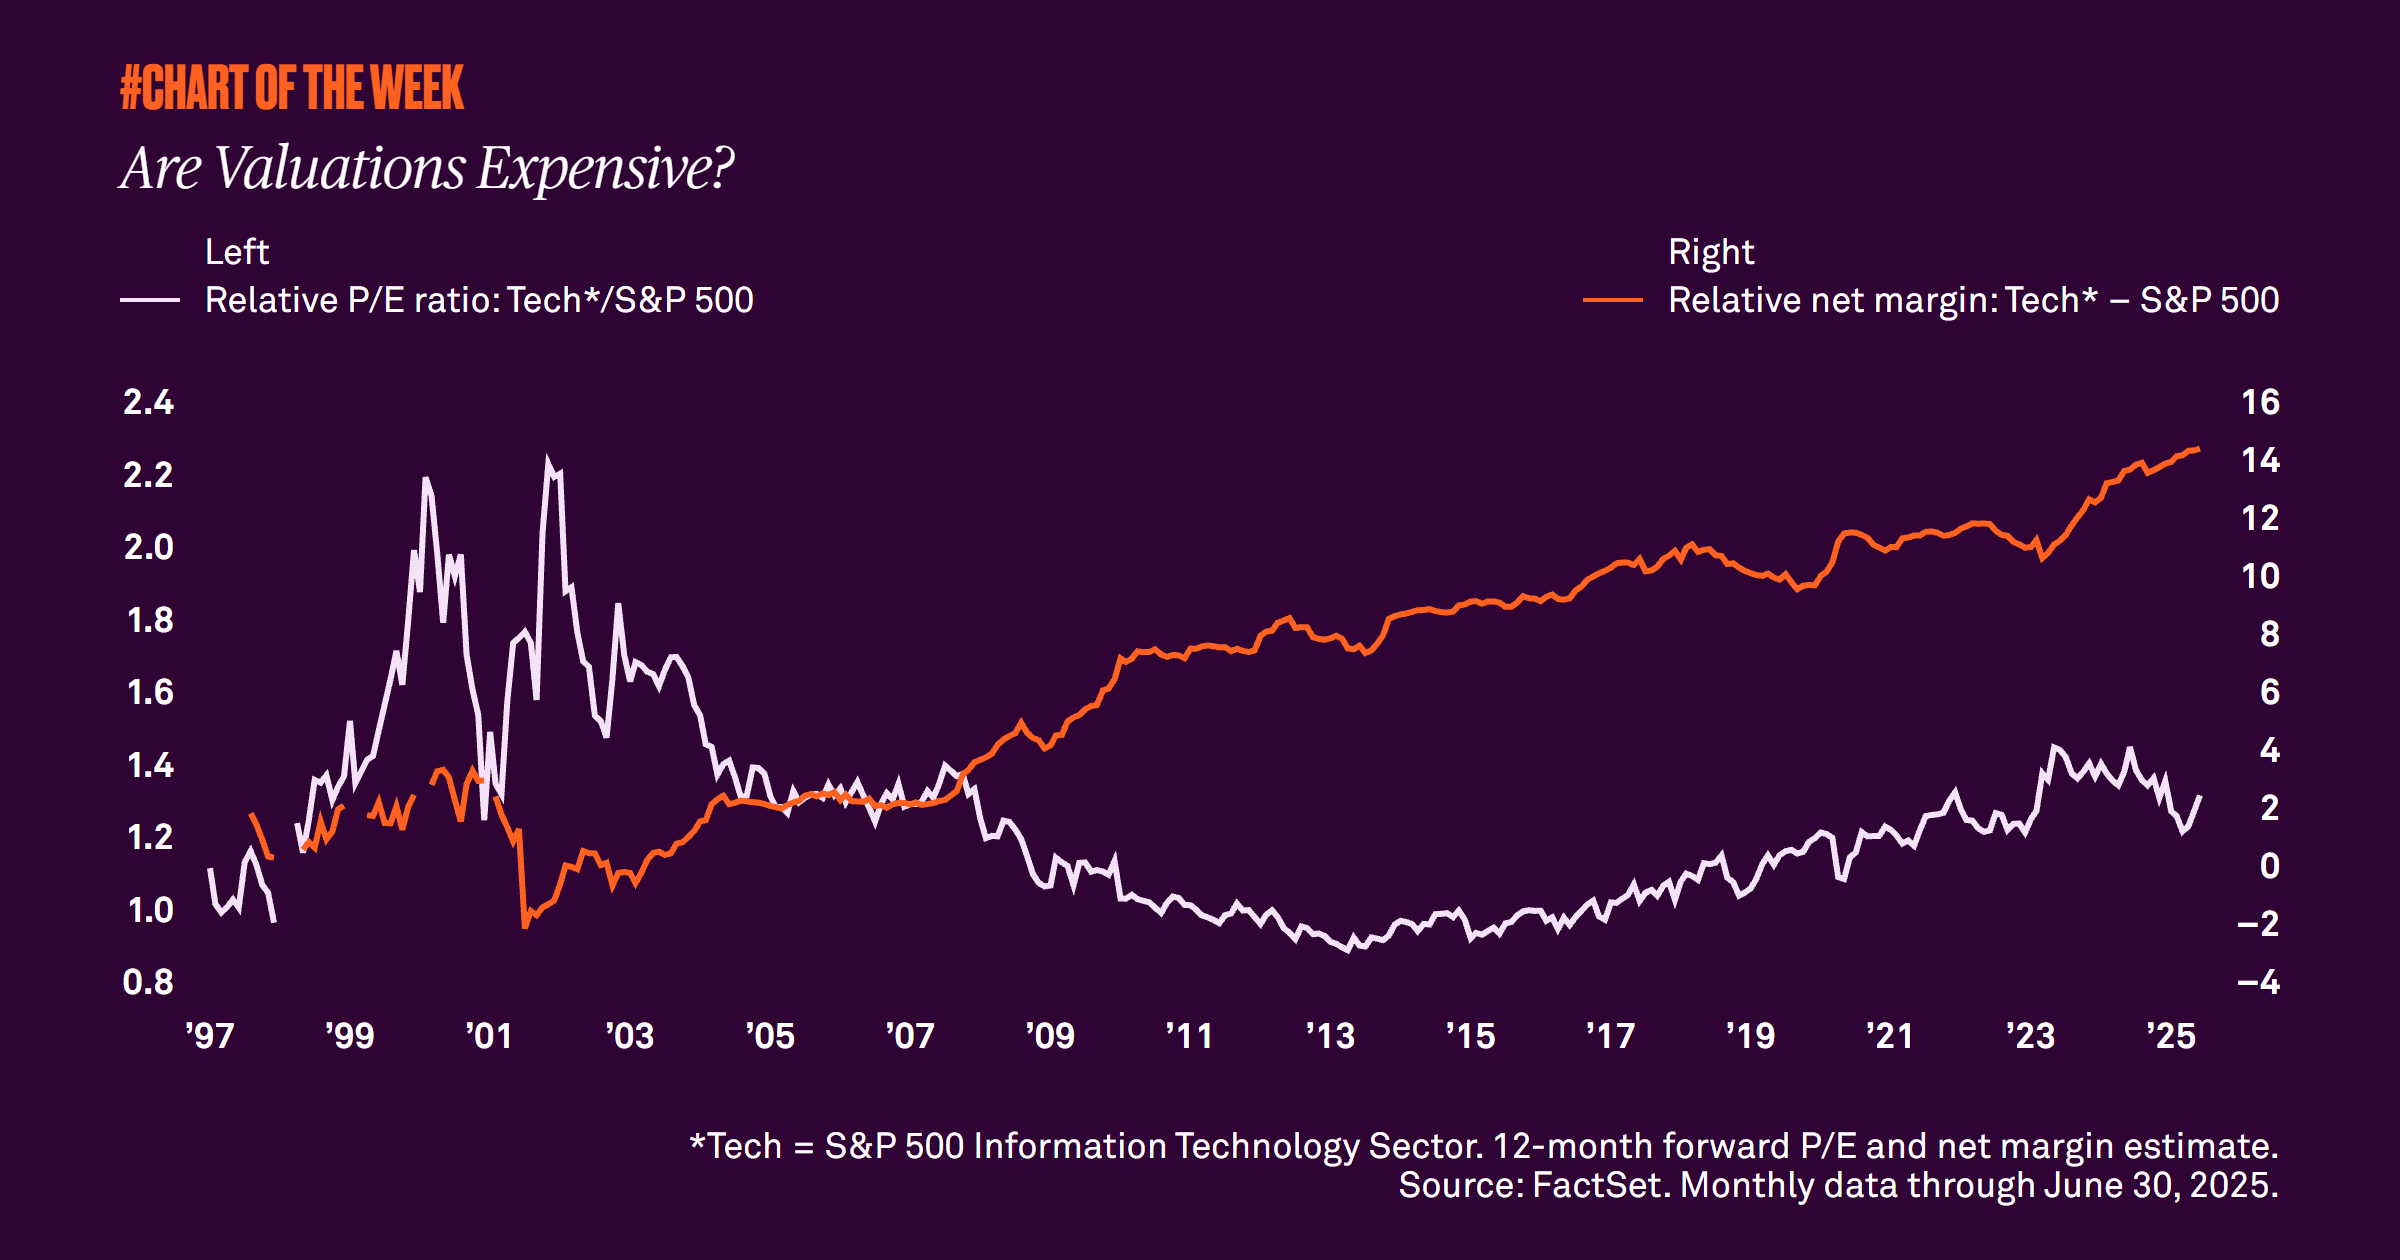
Our analysis suggests that the technology sector has been a key driver of the above average PE ratios. While this could suggest tech is expensive, net margins, which indicate how efficiently companies convert revenues into actual profits, are 14.4% higher for the technology sector than the S&P 500. This marks the highest difference in history. In addition to better margins, relative valuations of technology stocks versus the S&P 500 are much lower than they were during the dotcom bubble.
Given better margins and lower relative valuations, we believe technology is not overvalued, and therefore neither is the broader market. While current valuations are historically high, we’re in a higher margin regime that is driven by tech. This means the market is better at turning revenue into profits, which helps explain current valuation levels and suggests we could be in a higher PE world. While we anticipate some volatility over the historically challenging August and September period, we remain constructive on equities and maintain our overweight to U.S. large caps.