Markets are reacting to the Middle East conflict with sharp moves across asset classes, signaling broad risk repricing and shifting safe‑haven behavior. While volatility is elevated, fundamentals like earnings growth continue to support our constructive outlook.
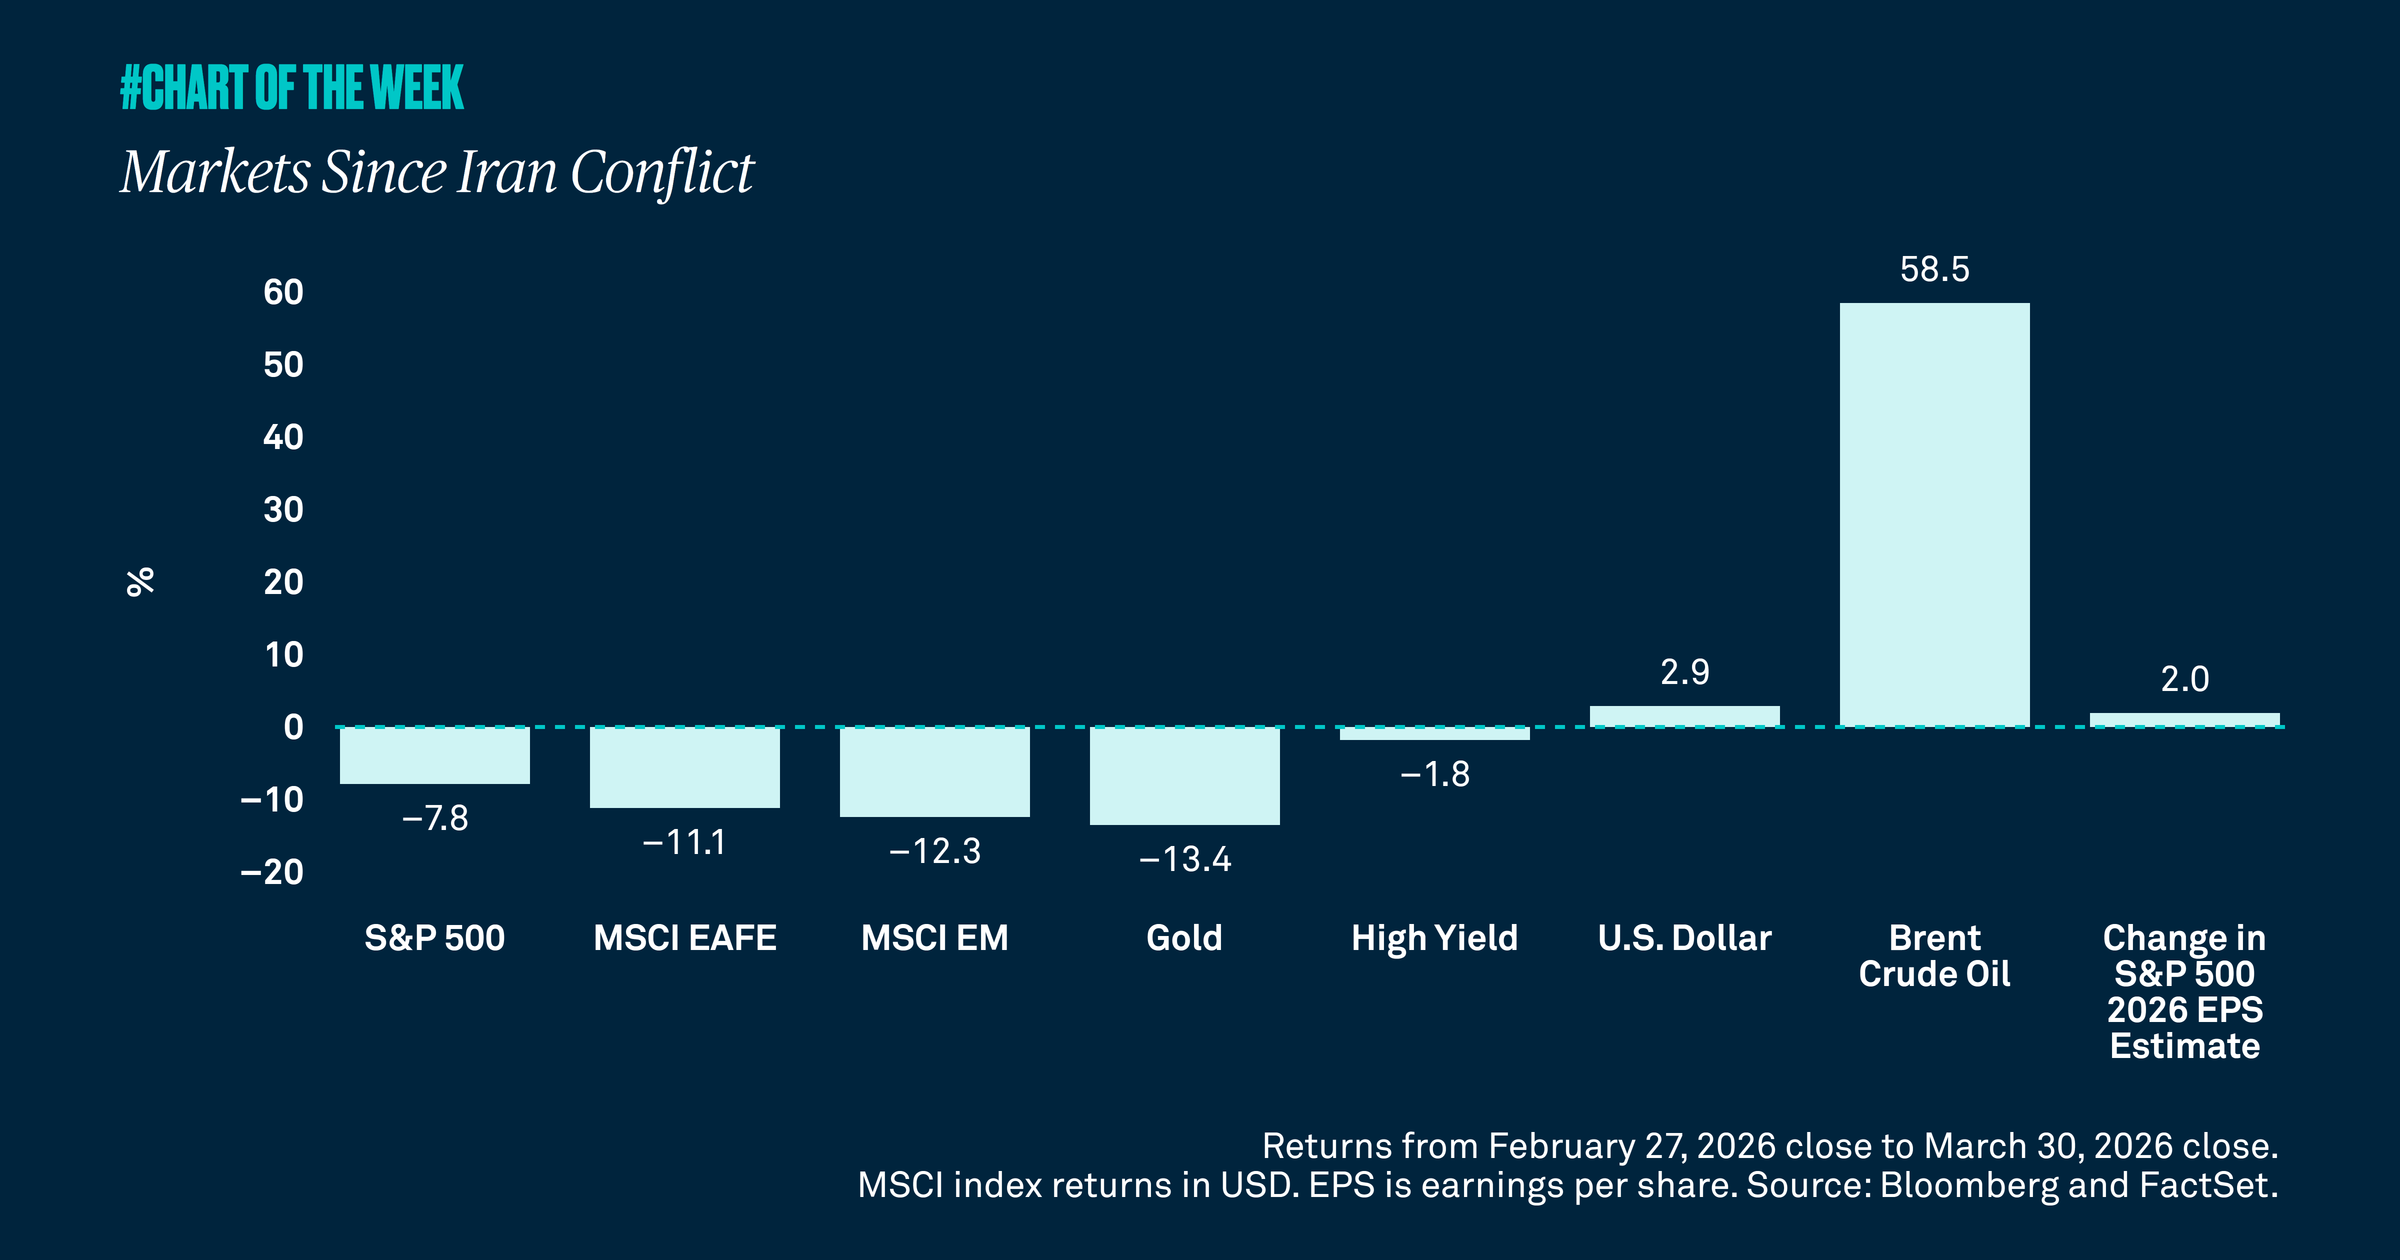
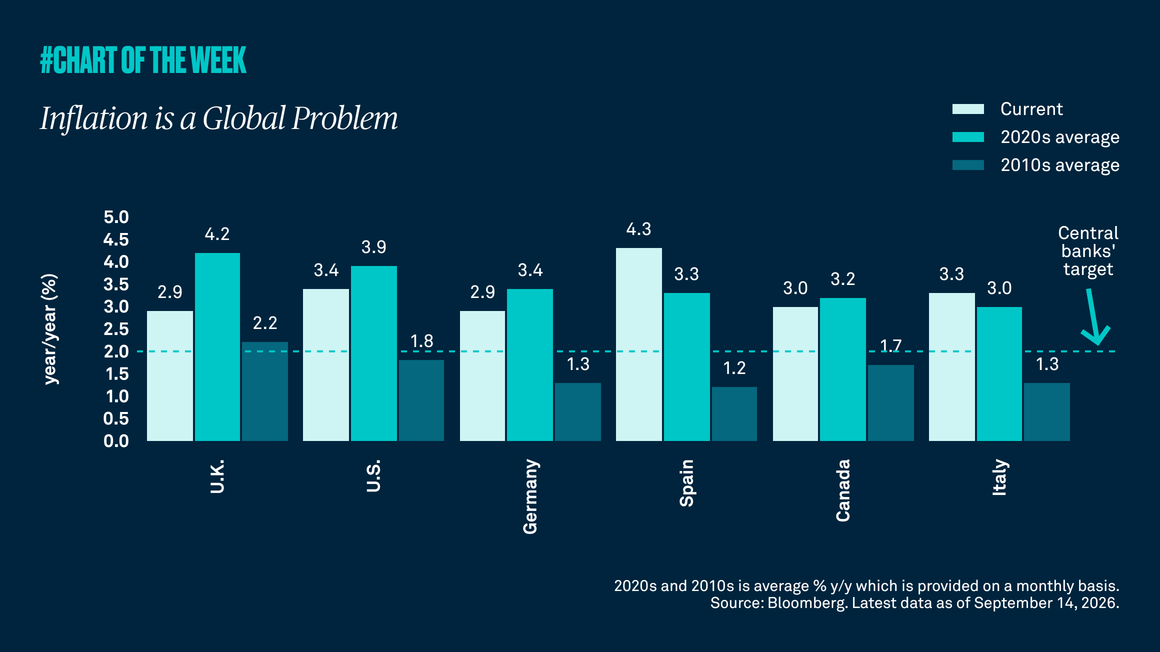
The conflict in the Middle East is evolving rapidly, and the market impact spans key asset classes and indices. Oil prices have appreciated roughly 50%, U.S. equities are 7-10% lower and U.S. Treasury yields are about 50 basis points higher, suggesting investors are not seeking safety there. Additionally, Treasury yields have reached their highest levels in almost a year due to the concern surrounding persistent inflation. Gold — traditionally a safe haven and inflation hedge — is down 15%. However, the U.S. dollar is 2.6% stronger. These moves reflect a broad risk repricing and shifting safe-haven dynamics.
Volatility has risen meaningfully and is likely to remain elevated until there is a clear path to resolution. The CBOE Volatility Index, the primary fear gauge of the market, has exceeded 30 for the first time since April 2, 2025, when investors digested the implications of “Liberation Day.” As long as conditions in the Middle East remain unstable and negotiations continue, we expect volatility to persist; following a resolution, we anticipate a gradual normalization.
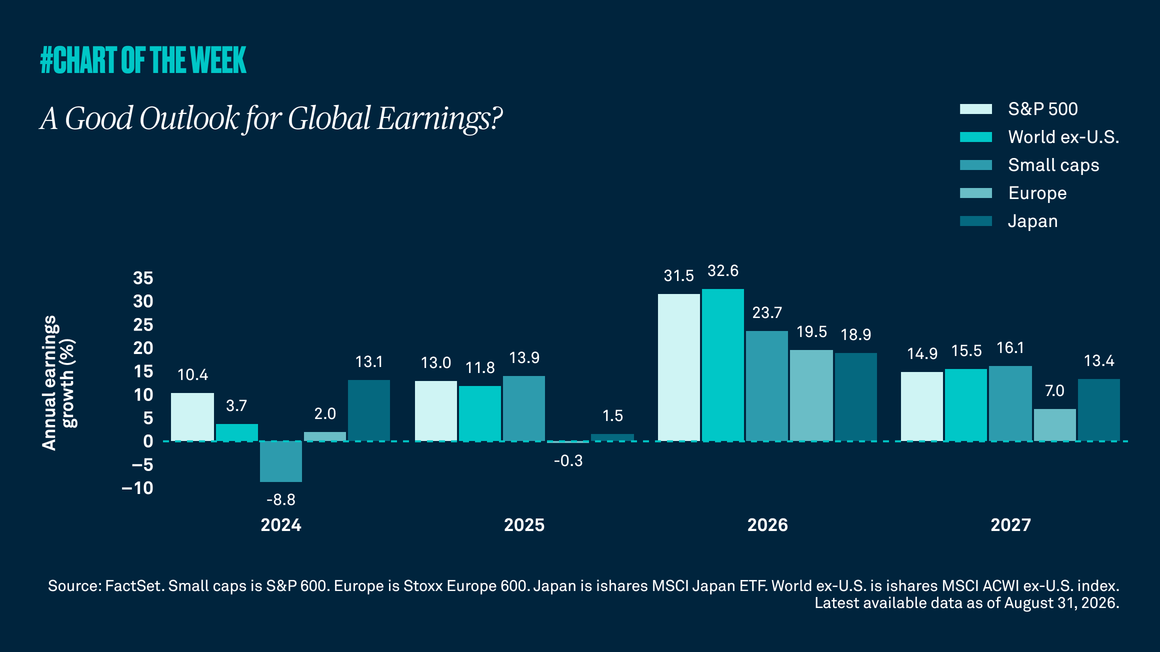
Even so, our outlook remains constructive. S&P 500 price-to-earnings ratios have compressed to 19 times with earnings growth estimates for 2026 still above 15%High yield bonds, typically viewed as relatively risky, are down only 2%. International equities, which were outperforming before the war began, have sold off more than the U.S. and are now in a correction.
Despite reduced risk tolerance, current signals point to a temporary disruption in oil prices, near-term pressure on inflation and uneven economic activity rather than the onset of a recession. The longer the conflict persists and oil prices remain elevated, the greater the potential impact; however, historically, markets have priced out oil shocks and geopolitical events over time. We anticipate U.S. growth of roughly 2% this year, and our guidance to clients is to stay the course as volatility often creates buying opportunities for long-term investors.