Please ensure Javascript is enabled for purposes of website accessibility Behind the Numbers: Q4 GDP
master-copy
es
noticias-y-perspectivas
false
true

Behind the numbers: Q4 GDP

Behind the numbers: Q4 GDP

Gross domestic product undershot expectations last quarter, but the shortfall appears driven more by the temporary government shutdown than broad-based weakness. Consumer demand remains resilient, and with supportive fiscal policy, easing financial conditions and a steady labor market, the outlook points to a modest acceleration in economic activity this year. 


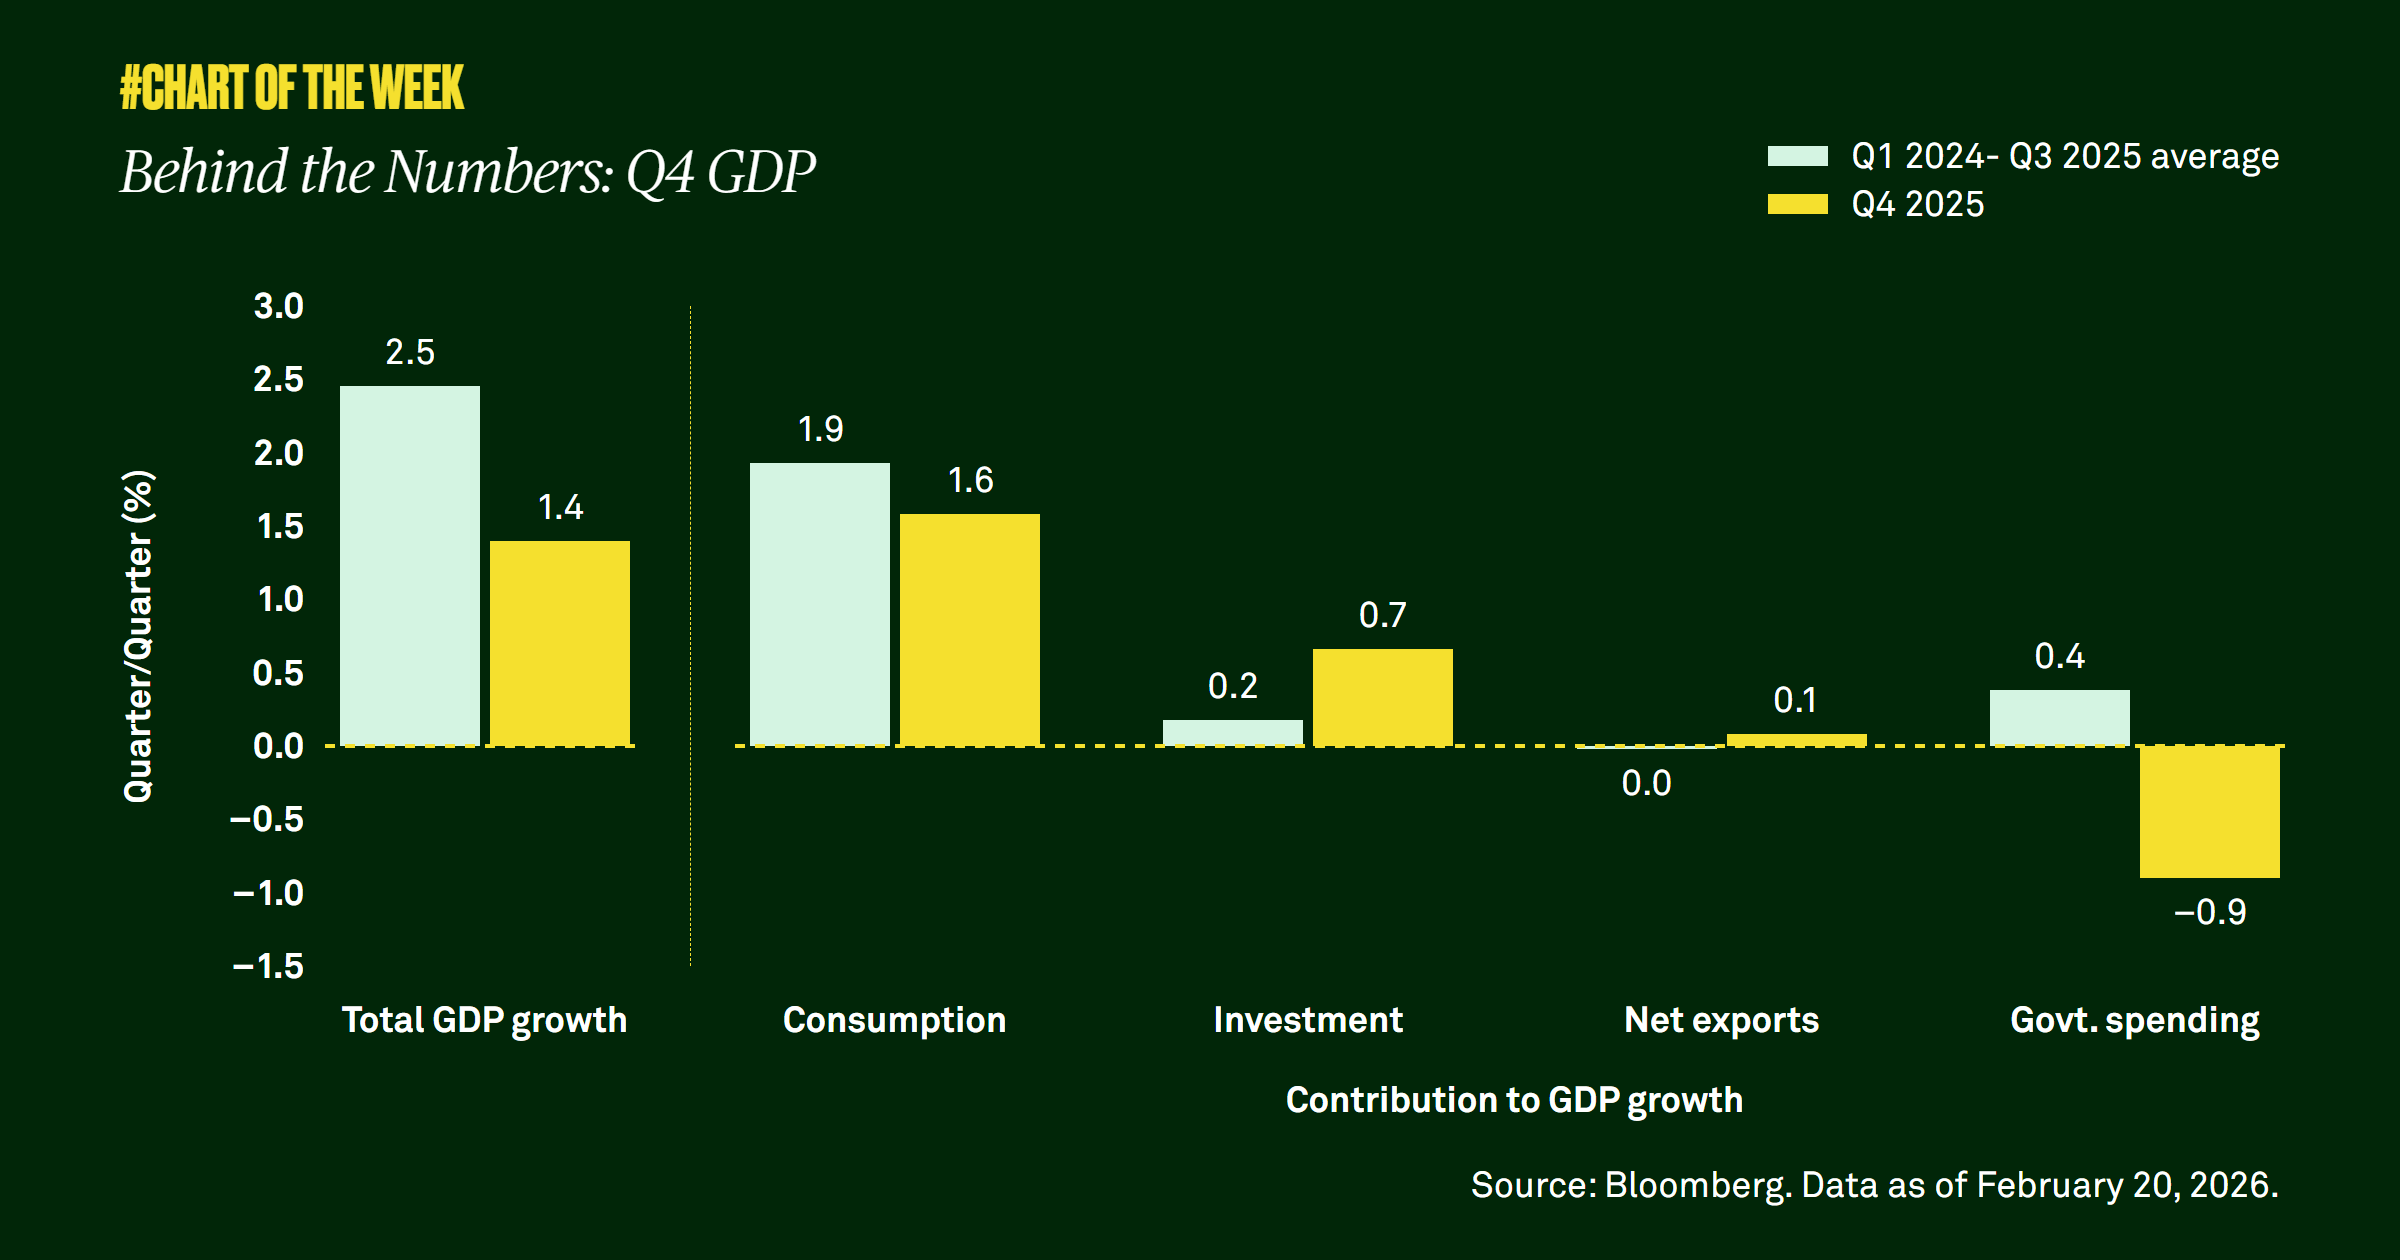
Last week’s fourth quarter gross domestic product (GDP) report came in at annualized pace of 1.4%, disappointing many Wall Street analysts who had anticipated 2.8%. For some investors, the news renewed concerns about an economic slowdown.

Growth was indeed softer than the 3% or more recorded in the previous two quarters, but the drivers of the miss are clear. The biggest drag was government spending at −0.9%, an unusually weak contribution that suggests the fourth quarter could have ended near 2.3% — above trend — absent the 43‑day government shutdown.

Consumption, the largest driver of GDP with a 70% share, slowed slightly to 1.6%, yet it remains resilient and in line with the average since 2024. We believe fiscal stimulus, lower interest rates and a steady job market will support household balance sheets and spending going forward.

Taken together, the evidence suggests the government shutdown — rather than a broad slowdown — drove the shortfall. Consensus GDP is 2.5% this year, and our target of 2.3% closely matches, reflecting our confidence in the economy amid a steady job market and sustained consumer spending.

CONTENIDO RELACIONADO
cotw-30-03-2026-thumbnail-580x326px
Chart of the week | Macroeconómico

Markets are reacting to the Middle East conflict with sharp moves across asset classes, signaling broad risk repricing and shifting safe haven behavior. While volatility is elevated, fundamentals like earnings growth continue to support our constructive outlook.

Signals from spreads
Chart of the week | Macroeconómico

Credit spreads have risen yet remain historically low, reinforcing our view that the oil shock is likely temporary — not a driver of long-term growth concerns.

Dollar strength: what does it mean for markets?
Chart of the week | Macroeconómico

Geopolitical tensions have lifted oil prices, sent U.S. stocks slightly lower and driven flows into the safety of the U.S. dollar, which has strengthened versus peers. While a weaker dollar previously supported international equity outperformance, dollar stabilization now suggests that tailwind is fading, underscoring the importance of diversification across regions and asset classes.

Returns after oil spikes
Chart of the week | Macroeconómico

The Strait of Hormuz, which moves about 20% of global oil, has seen many ships that normally travel through it curtail their activity. Consequently, WTI oil was up over 36% in the five days after the oil supply shock began. Yet equities barely budged, signaling a temporary supply shock, not a larger crisis. Historically, after similar price spikes equities tend to move higher while oil prices decline — further evidence for avoiding emotion-driven investing.

Gathering data
Disclaimer Not Available