Please ensure Javascript is enabled for purposes of website accessibility Signs from sales
lu
en
intermediary
intermediary
false
true
Gathering data
Disclaimer Not Available

Signs from sales

Signs from Sales

Year-to-date stock market returns have been driven by robust earnings growth. But when assessing the equity outlook, it’s important to ask what’s supporting the strong earnings trend.
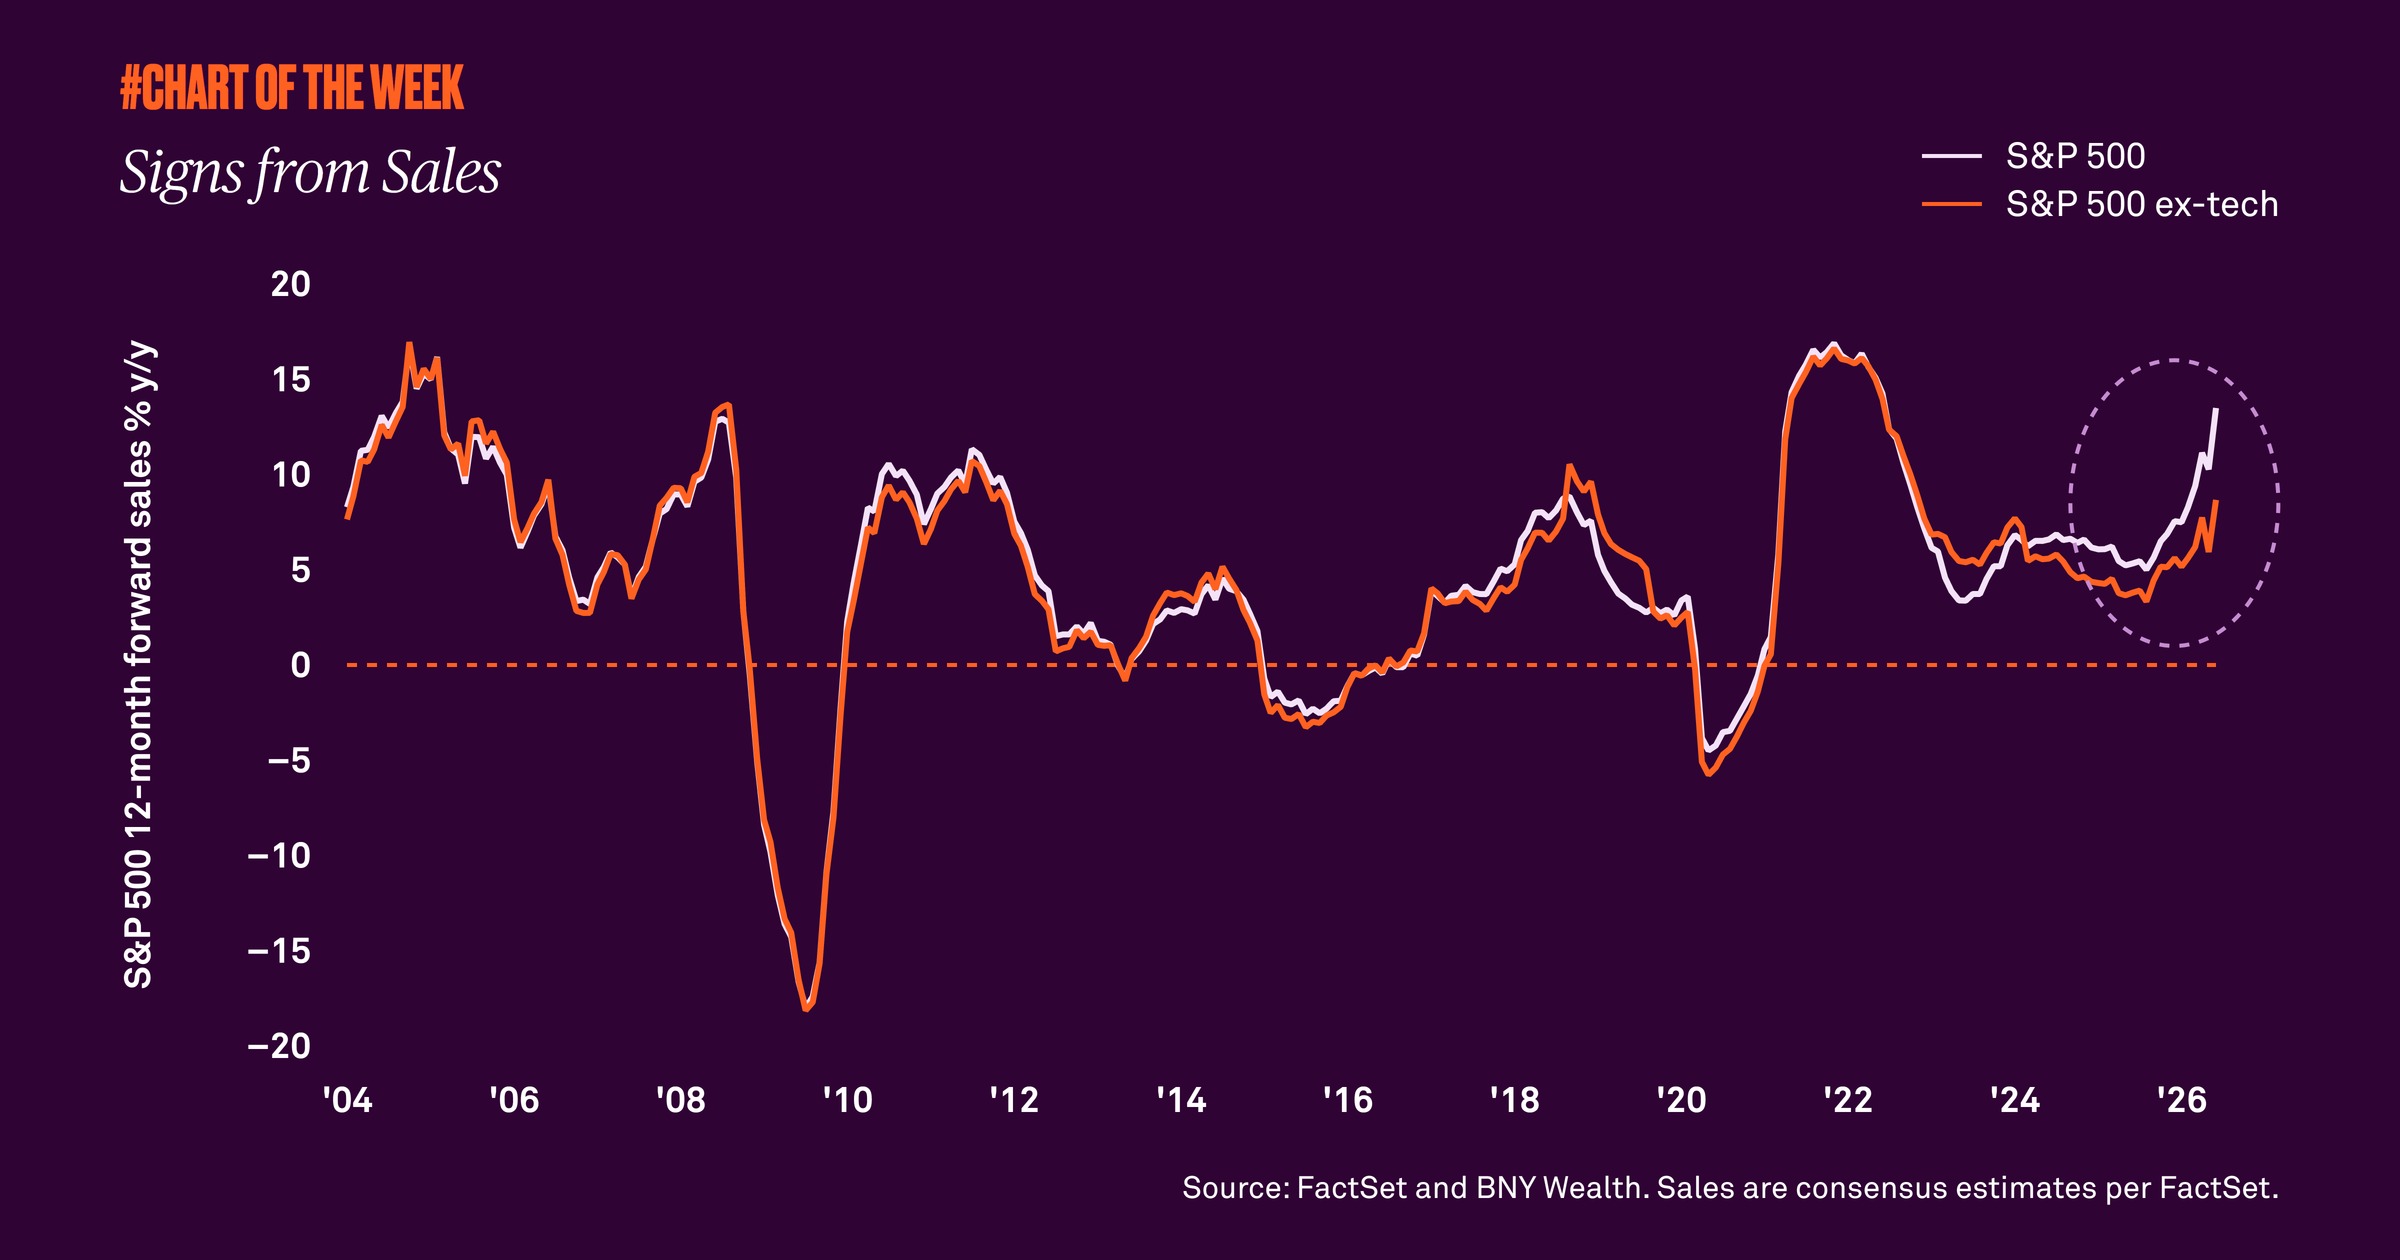

As second quarter earnings season gets underway, we look at the historically important variable of sales to understand performance. Corporate earnings are a function of both sales and margins. As we’ve highlighted before, S&P 500 margins are at or near all-time highs because of cost cutting and efficiency gains. But even as margins improve, sales growth remains essential to sustaining earnings momentum.

After a softer period following the post-pandemic boom, sales expectations are improving.  Consensus estimates for 12-month forward sales have moved up this year and are nearly 14% higher than a year ago, highlighting the resilience of the broader economy. While sector-specific tailwinds such as AI adoption are helping drive sales and earnings growth, the trend is not limited to technology. Sales for S&P 500 companies outside the technology sector are still expected to increase 8.7% from a year earlier.

In short, rising sales expectations are a positive signal for markets. They suggest analysts expect companies to generate more revenue in the coming year, which can support earnings growth, strengthen corporate fundamentals and renew investor confidence. Although sales growth is nearing the upper end of its historical range and may slow at some point, its broad-based, continued momentum remains a positive signal for our 2026 outlook.
RELATED CONTENT
Is AI productivity hiding in the data?
Chart of the Week | Macroeconomic

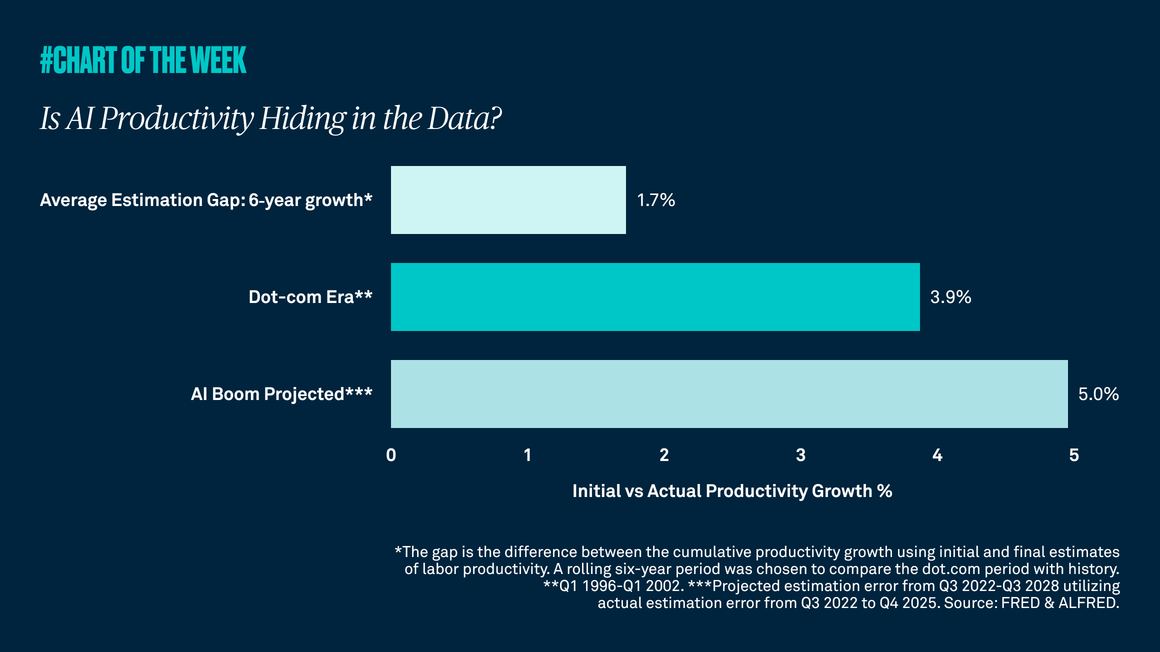
Both the dot-com era and the rise of artificial intelligence suggest that early productivity data can understate the actual economic impact of transformative technologies. In the case of the internet, later revisions to productivity gains surpassed early estimates. The same may prove true for AI, implying stronger support for growth.

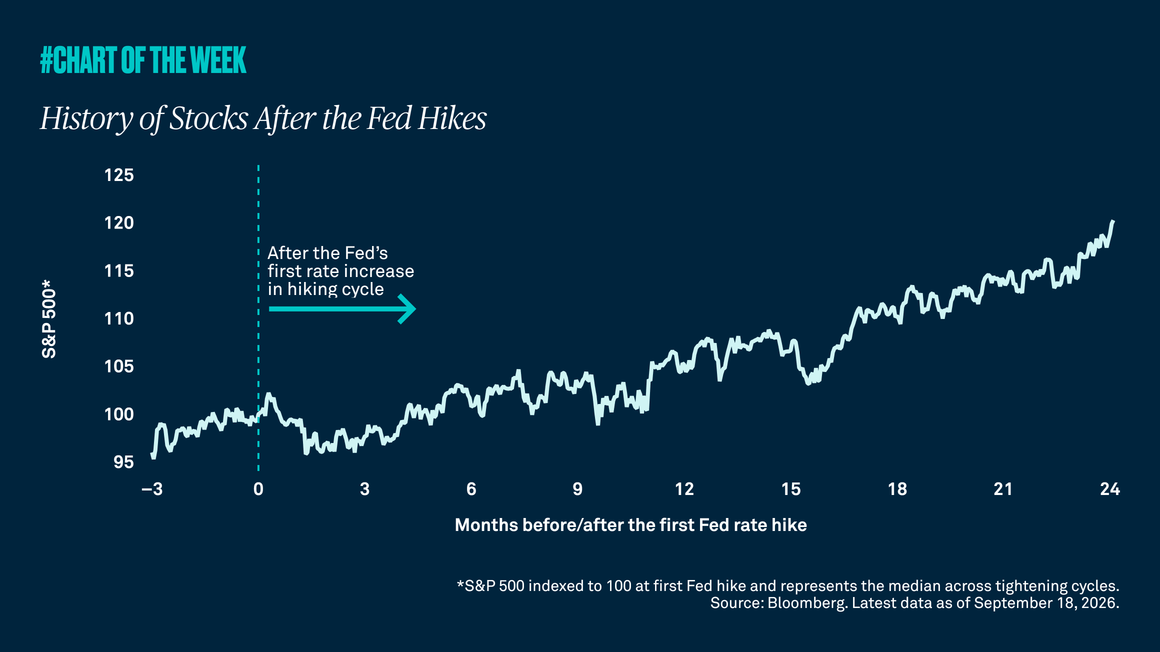
History of stocks after the fed hikes
Chart of the Week | Macroeconomic

Sticky inflation and resilient growth have revived monetary tightening, increasing the risk of higher-for-longer rates and near-term volatility. We continue to believe economic resilience and strong corporate profits should continue to provide a favorable backdrop for stocks, and would use periods of market weakness to add selectively to equities. Additionally, owning real assets can help hedge against inflation.

Inflation is a global problem
Chart of the Week | Macroeconomic

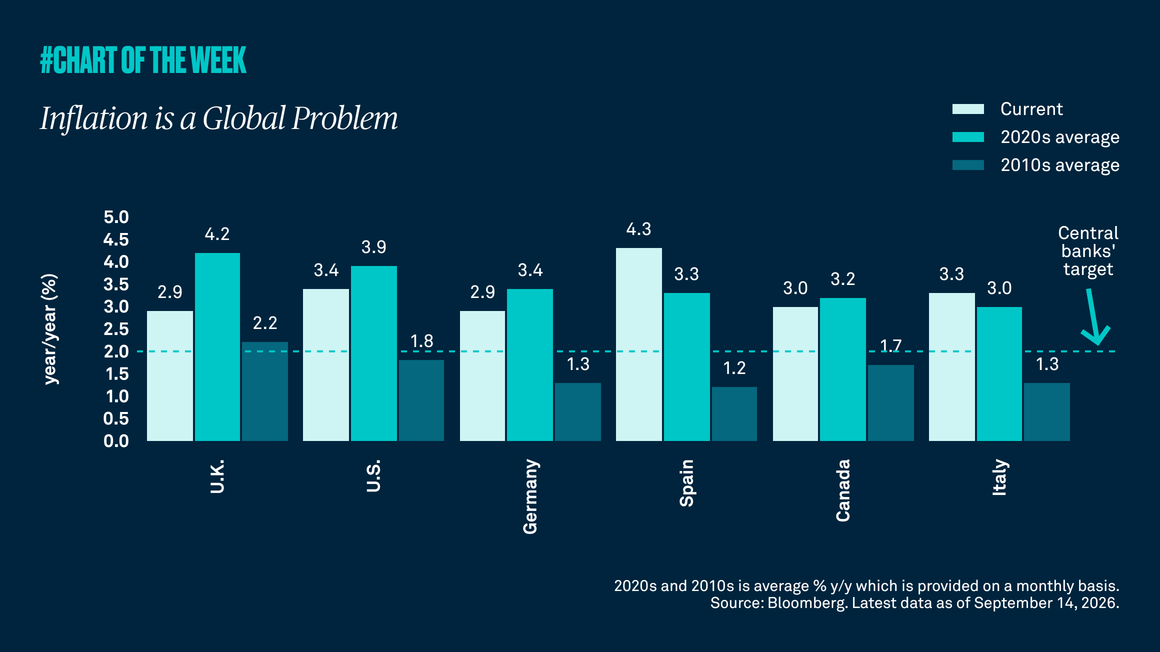
Resilient economic growth, sticky inflation driven by higher energy prices and continued geopolitical uncertainty are complicating the path back to central-bank price targets. We believe policymakers are likely to adopt a tightening bias but remain data dependent.

A good outlook for global earnings
Chart of the Week | Macroeconomic

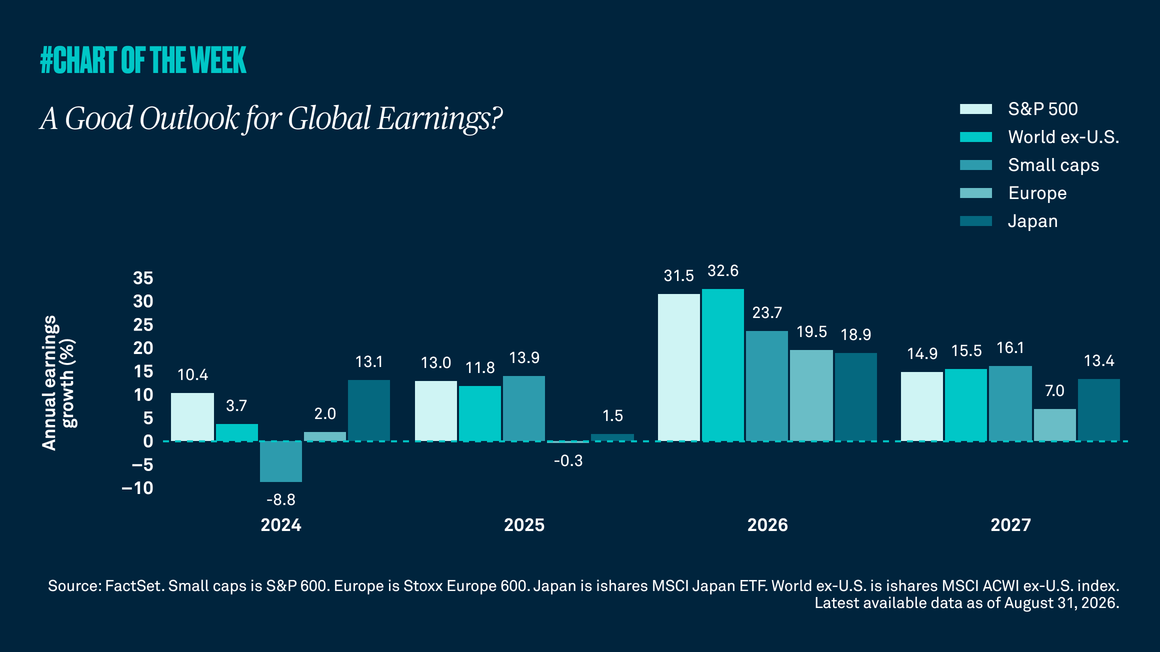
Global earnings growth has been strong this year, led by the U.S. and reinforced by improving profit growth across Europe, Japan and other major markets. While volatility may rise in the near term, above-average earnings and broader global participation remain supportive of global equities.

Gathering data
Disclaimer Not Available

This is a marketing communication