QUARTERLY
INVESTMENT OUTLOOK
Intelligence for Your Portfolios
|
| Internet safety and fraud reminder BNY has become aware of incidents in various parts of the Asia Pacific region involving unauthorized use of our brand names (e.g., BNY) and impersonation of BNY leadership or employees. These schemes often involve third parties offering financial services and requesting personal or banking information via social media platforms, messaging applications, emails, or phone calls. Please be advised that BNY and its affiliates do not solicit business or payments through these channels. These activities are not authorized, endorsed, or associated with BNY. |

Checkpoints is a comprehensive monthly chartbook highlighting major top-of-mind themes that could shape financial markets in the near term. In addition to the broader macroeconomic discussion, Checkpoints delivers detailed views on major asset classes, including global equities, fixed income and real assets.

As interest rates have normalised following an extended low-rate period, insurers in Asia are reassessing how they manage liquidity.
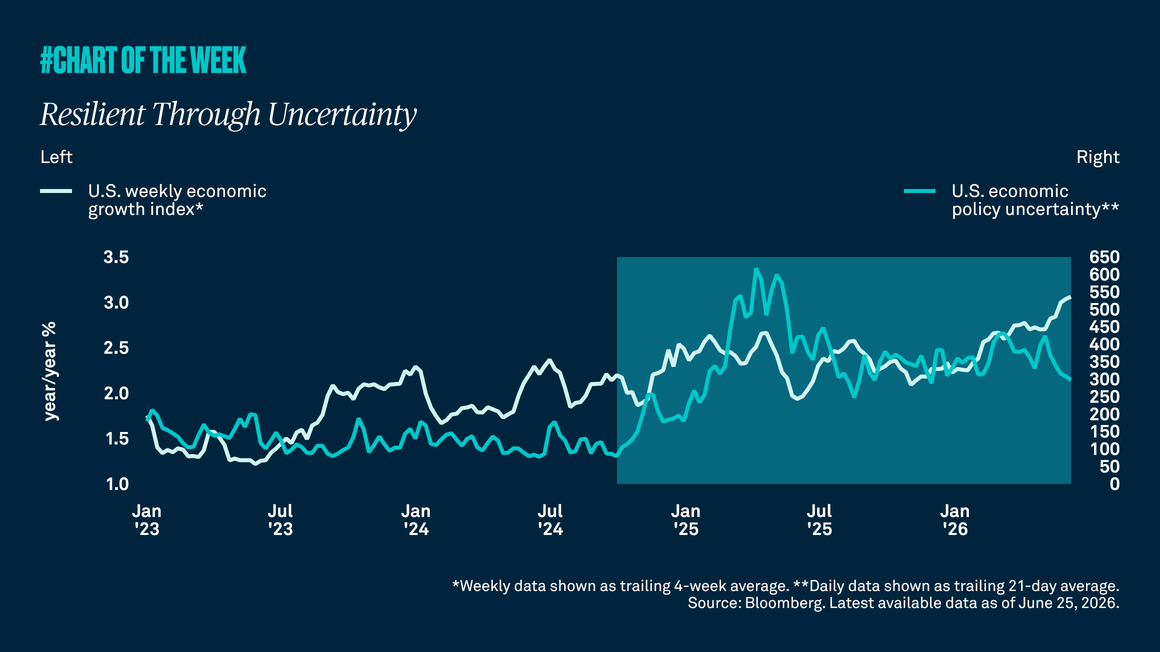
U.S. policy uncertainty has remained elevated and consumer sentiment has weakened. Even so, the economy has stayed resilient, and because growth has held up better than sentiment and headlines suggest, we continue to forecast 2% U.S. growth in 2026, in line with trend.

The rules of the market may have changed. How should multi-asset investors respond?
CONTACT US | +852 3926 0600