Please ensure Javascript is enabled for purposes of website accessibility Returns after oil spikes
fi
en
intermediary
intermediary
false
true
Gathering data
Disclaimer Not Available

Returns after oil spikes

Returns after oil spikes

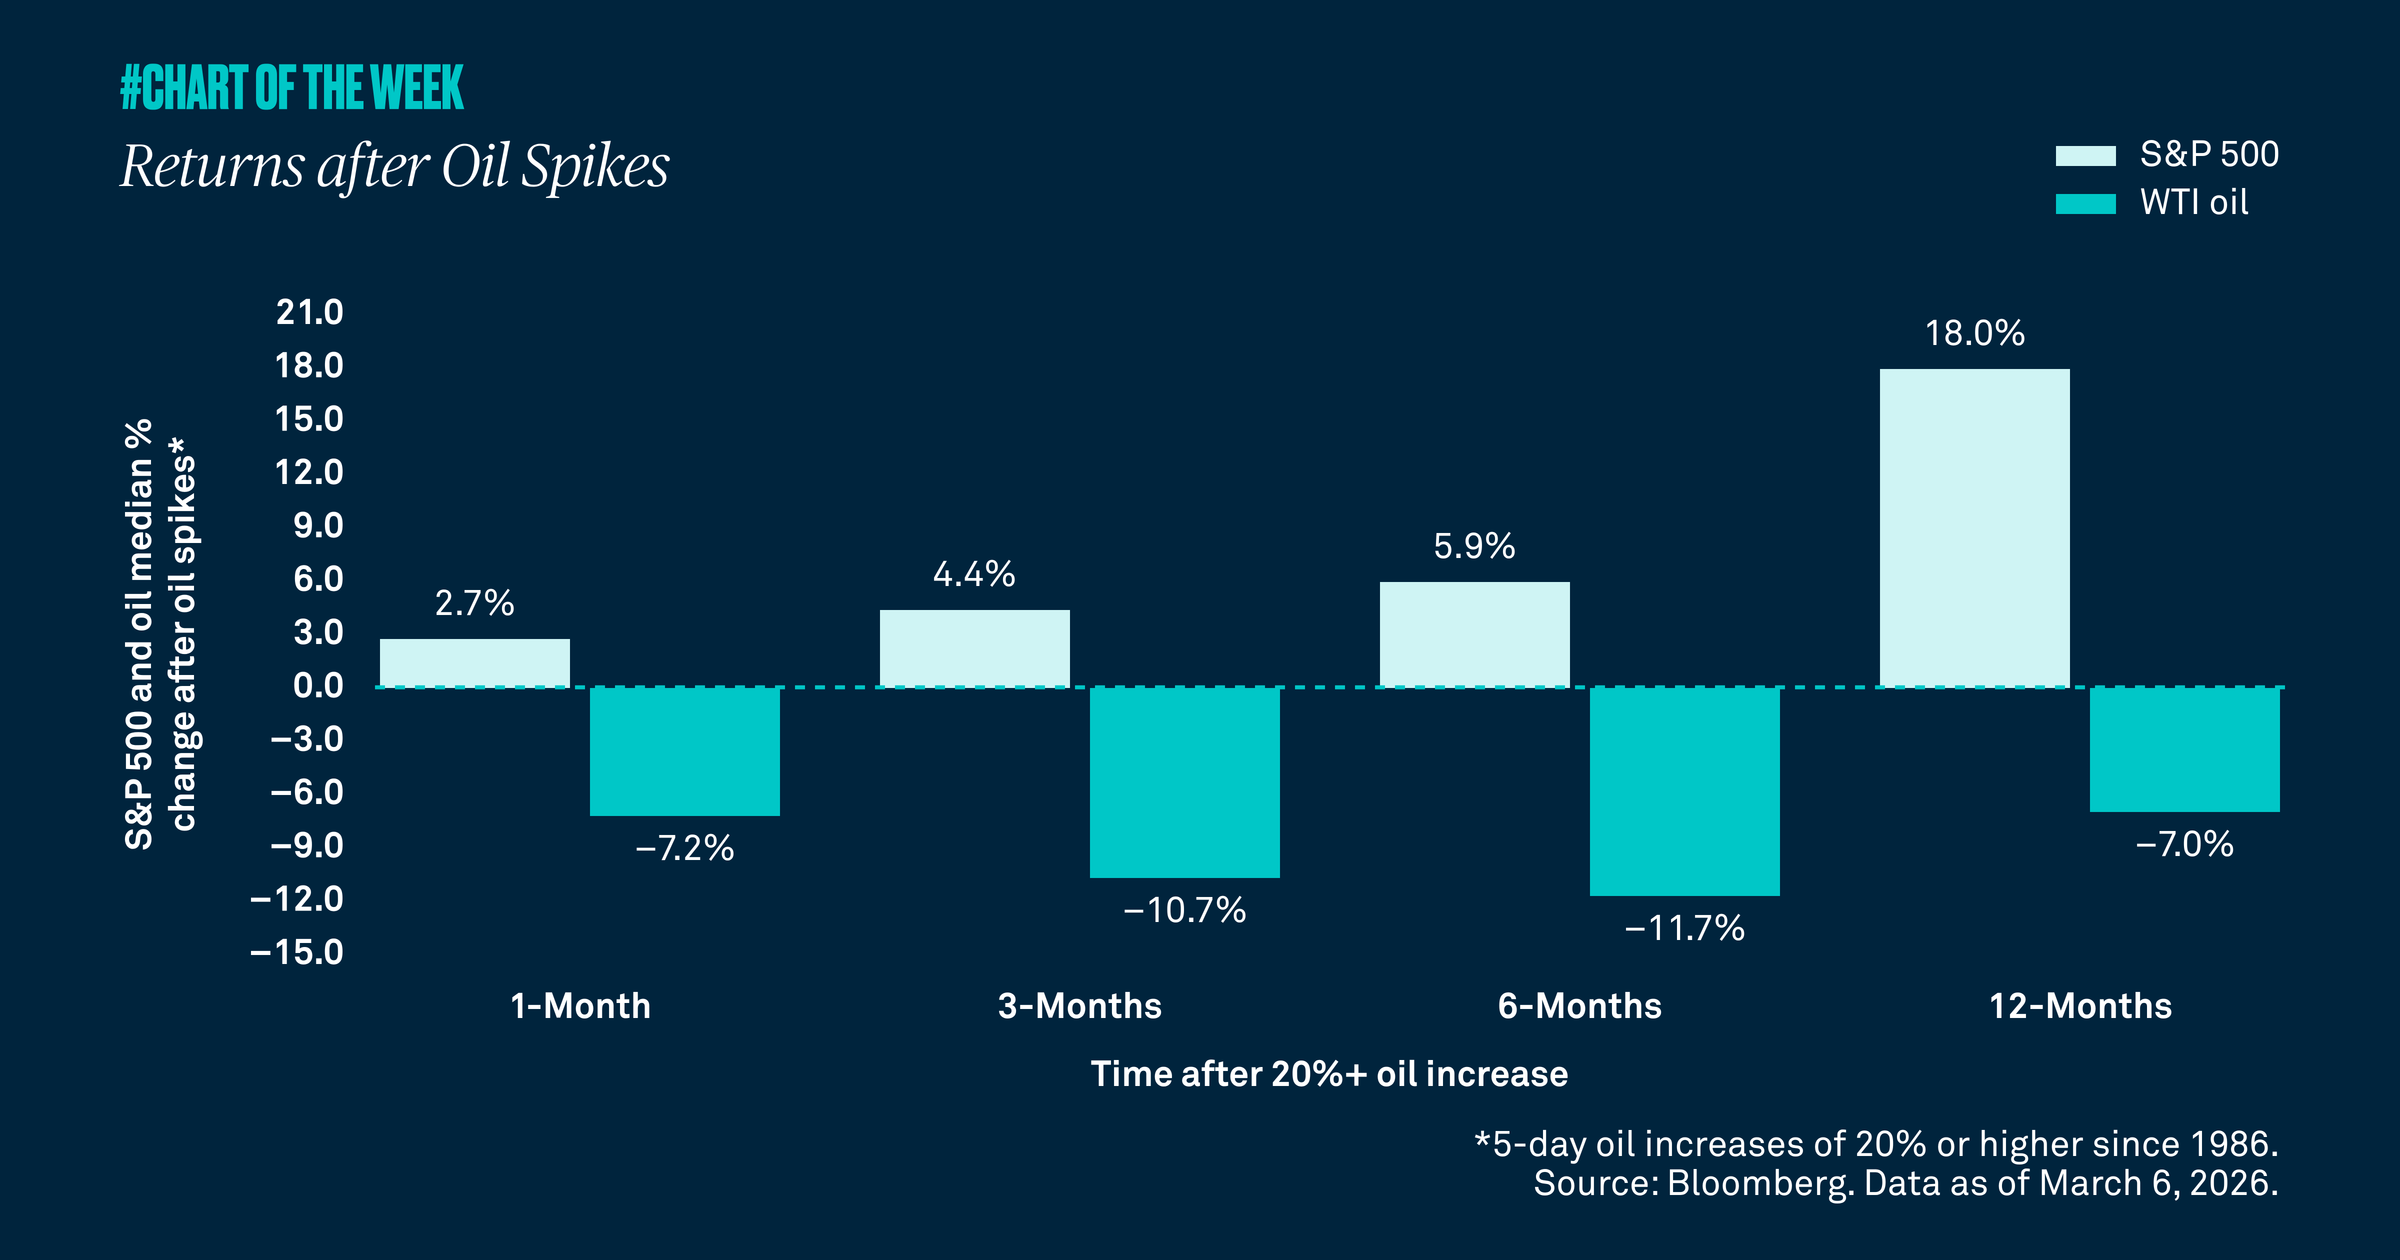
The Strait of Hormuz, which moves about 20% of global oil, has seen many ships that normally travel through it curtail their activity. Consequently, WTI oil was up over 36% in the five days after the oil supply shock began. Yet equities barely budged, signaling a temporary supply shock, not a larger crisis. Historically, after similar price spikes equities tend to move higher while oil prices decline — further evidence for avoiding emotion-driven investing. 

The Strait of Hormuz, which links the Persian Gulf to the Indian Ocean, sits at the heart of today’s Middle East tensions. It moves roughly 20% of global oil, yet ships are increasingly skirting the route amid Iranian attack risk. WTI oil surged more than 36% in the five days after the initial shock. Despite the hit to supply, the S&P 500 is down just 2.0% and energy stocks are up only 1.0%. These moves suggest markets see a temporary oil supply shock, not a broader crisis. If it were systemic, equities would sell off more sharply and energy would rally harder.

Our research supports this. After five‑day oil spikes of 20%+, equities have typically risen while oil prices declined. Since the 1980s, the median six‑month S&P 500 gain is about 6% as oil has fallen nearly 12% following such shocks.  

Historically, equities have looked right through oil shocks and geopolitics — and we expect the same this year as Middle East shipping normalizes and markets refocus on oversupply combined with softer long‑term demand. It’s a reminder: emotion-driven investing doesn’t pay because markets often tune out oil headlines that tend to rattle investors.
RELATED CONTENT
A good outlook for global earnings
Chart of the Week | Macroeconomic

Global earnings growth has been strong this year, led by the U.S. and reinforced by improving profit growth across Europe, Japan and other major markets. While volatility may rise in the near term, above-average earnings and broader global participation remain supportive of global equities.

In a real regime shift?
Chart of the Week | Macroeconomic

Higher inflation has been a dominant theme of the current decade. In addition to price shocks, it is being shaped by secular investment trends in infrastructure, defense spending, onshoring and the ongoing AI buildout. These structural changes reinforce the case for looking beyond traditional 60/40 portfolios to include real assets as a source of diversification and return potential in portfolios.

Getting real with real assets
Chart of the Week | Macroeconomic

Inflation appears to have transitioned from its pre-Covid average of 2% to a stickier point closer to 3%, and we do not expect a near-term return to prior levels. In this environment, we believe real assets, such as commodities, infrastructure and REITs, can provide inflation protection, diversification and return potential.

Not in a bubble
Chart of the Week | Macroeconomic

As the S&P 500 approaches all-time highs, there are renewed concerns among investors about elevated valuations. However, historically strong profitability and expected earnings growth appear to support current pricing. In addition, the current S&P 500 price-to-earnings (P/E) ratio is roughly equal to the average since Covid. As a result, we do not view U.S. equities as being in bubble territory and we remain constructive on the asset class.

Gathering data
Disclaimer Not Available

This is a marketing communication